
Asset Management Company 10-Year 3 Statement Financial Model – Excel XLSX
Excel (XLSX)
BENEFITS OF THIS DOWNLOADABLE EXCEL DOCUMENT
- Provides a structured framework for building a 10-year financial model for asset management companies and fund platforms.
- Enables fund managers and investment firms to forecast AUM growth, management fees, and operating profitability.
- Helps investment management teams model revenue, expenses, and performance fee economics across multiple fund strategies.
ASSET MANAGEMENT EXCEL DESCRIPTION
Curated by McKinsey-trained Executives
🏦 Asset Management Company Financial Model – Institutional-Grade 10-Year Excel Pro Forma for Fund Managers, AUM Operators & Capital Raising Teams
The Ultimate Financial Model for Asset Managers, Fund Operators, RIAs, Maritime PE, Infrastructure Funds & Institutional Capital Raising Professionals
Stop pricing your management fee schedule based on what your competitor charges.
Stop pitching institutional allocators with a one-page AUM waterfall and a prayer.
Stop underestimating fee compression, performance fee volatility, and the operating leverage gap between a $5B and a $75B AUM platform.
Stop losing mandates because your projections ignored redemption timing, hurdle rate mechanics, product mix dilution, and the compounding drag of hiring ahead of AUM scale.
If you are launching an asset management firm, scaling a multi-product fund platform, entering new investor segments, raising a GP-led continuation vehicle, or pitching an institutional LP with a 10-year track record forecast – your financial model is not "just a spreadsheet."
It is your:
• #1 Institutional Investor Pitch Weapon
• LP Capital Raise & Placement Agent Approval Tool
• AUM Growth & Fee Rate Optimization Engine
• Product-Level Revenue & Margin Command Center
• Multi-Strategy Expansion & Headcount Scaling Roadmap
This model gives you – fully built, fully formula-driven – exactly what allocators, seed investors, prime brokers, institutional LPs, family offices, sovereign wealth funds, and serious asset managers expect to see in a professional fund management business plan and 10-year financial projection package.
💼 What You Get
✅ 10-Year Fully Integrated 3-Statement Financial Model – AUM scaling from $5B (Year 1) to ~$72B (Year 10) – a 14× growth trajectory across a single decade
✅ Annual Forecasts with Operational-Grade Granularity – Every revenue dollar driven by real AUM roll-forward mechanics, not a top-line growth percentage
✅ AUM Roll-Forward Engine – Beginning AUM → Gross Client Inflows → Redemptions → Investment Performance → New Fund Launches → Ending AUM, rebuilt every year from first principles
✅ Revenue Segmented by 6 Product Lines – Mutual Funds (0.60%), ETFs (0.20%), Hedge Funds (1.50%), Private Equity (1.25%), Private Credit (0.80%), SMAs (0.50%) – each with independent fee compression built in
✅ Revenue Segmented by 4 Client Segments – Retail (25%), HNWI & Family Office (20%), Institutional & Pension (35%), Endowments & Sovereign Wealth (20%)
✅ Performance Fee & Carried Interest Engine – 20% incentive fee above 8% hurdle rate, 65% annual hit rate, 33% of AUM eligible – modeled at the economics level, not as a percentage assumption
✅ 5 Ancillary Revenue Streams – Advisory & Consulting Fees, Fund Administration Revenue, Sub-Advisory Revenue, Securities Lending Income, Data & Research Products – all AUM-linked and formula-driven
✅ Annual Fee Compression Schedule – 2% relative rate decline per product per year – because fee compression is not optional to model anymore
✅ Full Headcount Engine – 8 role types with individual salaries, annual hiring additions, salary raises, bonus loadings, benefits, payroll tax, and stock-based compensation across all 10 years
✅ CapEx & Depreciation Schedule – Technology platforms, trading systems, data infrastructure, office build-out – separately capitalized vs. expensed, with PP&E and intangibles roll-forwards and D&A feeding directly into the income statement
✅ Fully Integrated 3-Statement Model – Income Statement, Balance Sheet, Cash Flow Statement (indirect method) – dynamically linked with zero hardcoded forecast values outside the Assumptions sheet
✅ Balance Sheet That Balances – Live balance check cell. Green = balanced. Every year. No exceptions.
✅ Scenario & Sensitivity Analysis – 5 named scenarios (Base, High Growth, Bear Market, Fee Compression, Institutional Boom) + AUM return × net inflow rate sensitivity matrix with 25-cell green-to-red conditional heatmap
✅ Executive Dashboard – 9 live KPI tiles, 6 embedded working charts, all pulling live from the model – built for LP meetings, placement agent decks, and board presentations
✅ Blue-Coded Assumptions Engine – 101 blue input cells across one central ASMP tab. Change one assumption. Every number across all 11 sheets recalculates instantly.
🎯 Who This Is For
• First-time fund managers launching a registered investment adviser or alternative asset platform
• Multi-product fund operators scaling mutual funds, ETFs, hedge funds, and private markets simultaneously
• GP teams building institutional-grade financial packages for LP capital raises and continuation vehicles
• Dry-powder PE firms, credit managers, and infrastructure funds entering the third-party capital management vertical
• Family office operators launching institutional products for external investors
• RIAs and wealth management platforms adding institutional AUM strategies to their product shelf
• Hedge fund managers building seed capital pitch packages for prime brokers and placement agents
• Maritime PE, real estate, and infrastructure fund managers modeling 10-year carry waterfall economics
• Series A and Series B fundraising teams in the alternative asset management vertical
• Fund finance banks, credit facilities providers, and management company lenders requiring financial proof packages
• Boutique investment banks, placement agents, and third-party marketers building revenue-share business cases
• SBA, bonding agency, and commercial bank applicants launching fund management operating companies
If you manage capital, earn management fees, run a performance fee book, or operate any AUM-based revenue business – this model was built for you.
🔥 Why Most Asset Management Financial Models Fail
Most templates rely on:
• Simple "Revenue = AUM × Fee Rate" with a single blended rate and no product-level logic beneath it
• No AUM roll-forward – just a straight-line AUM growth assumption with no inflows, redemptions, or market return mechanics
• No contract type split between management fees, performance fees, carried interest, and ancillary revenue – just one revenue line
• No fee compression schedule – as if allocators are not actively renegotiating every mandate at renewal
• No performance fee model with hurdle rate mechanics, eligible AUM calculation, and hit rate probability
• No product mix shift over time – as if your ETF book and your private equity book have the same economics
• No headcount build with individual role salaries, hiring plans, bonus structures, and benefits loadings
• No CapEx schedule for technology platforms, trading infrastructure, data systems, and office build-out
• No PP&E roll-forward or intangibles amortisation schedule on capitalized software and analytics platforms
• No working capital modeling for accounts receivable, deferred revenue, performance fee payables, and accrued compensation
• No equity schedule tracking paid-in capital, retained earnings, SBC reserve, and dividend policy across 10 years
• No sensitivity matrix stress-testing market returns against net inflow rates simultaneously
This model fixes all of that – from the ground up.
📊 What's Inside – Every Major Component
1️⃣ Executive Dashboard
Instant institutional investor snapshot including:
• Total AUM scaling from $5,000M (Year 1) to ~$72,000M (Year 10) – 14× growth over the forecast period
• Total Revenue by Year – driven entirely by AUM roll-forward and product-level fee rates, no top-line growth assumptions
• EBITDA & EBITDA Margin % by Year – expanding from ~35% (Year 1) to ~60% (Year 10) driven by pure operating leverage as AUM scales and fixed cost base amortises
• Net Income & Net Margin % by Year – positive and growing throughout, with margin expansion driven by product mix shift toward higher-fee private markets strategies
• Ending Cash Balance across all 10 forecast years – fed directly from the Cash Flow Statement
• Total Headcount (C-Suite + 8 operational role types) growing year by year from the granular hiring plan
• Blended Average Management Fee Rate – declining annually as fee compression assumption compounds
• Return on Equity – live from the Balance Sheet every year
• Revenue per Employee – the institutional operating leverage metric LPs actually scrutinize
6 live embedded charts:
• AUM Growth trajectory (line chart, 10 years)
• Revenue & EBITDA (clustered bar, 10 years)
• Net Income trend (bar chart, 10 years)
• Margin Trends – EBITDA % and Net % (dual line chart, 10 years)
• Revenue Mix by stream – Management Fees vs. Performance Fees (stacked bar, 10 years)
• Headcount Growth (bar chart, 10 years)
Built for LP pitch decks, placement agent packages, GP seed capital meetings, fund finance due diligence, and board presentations.
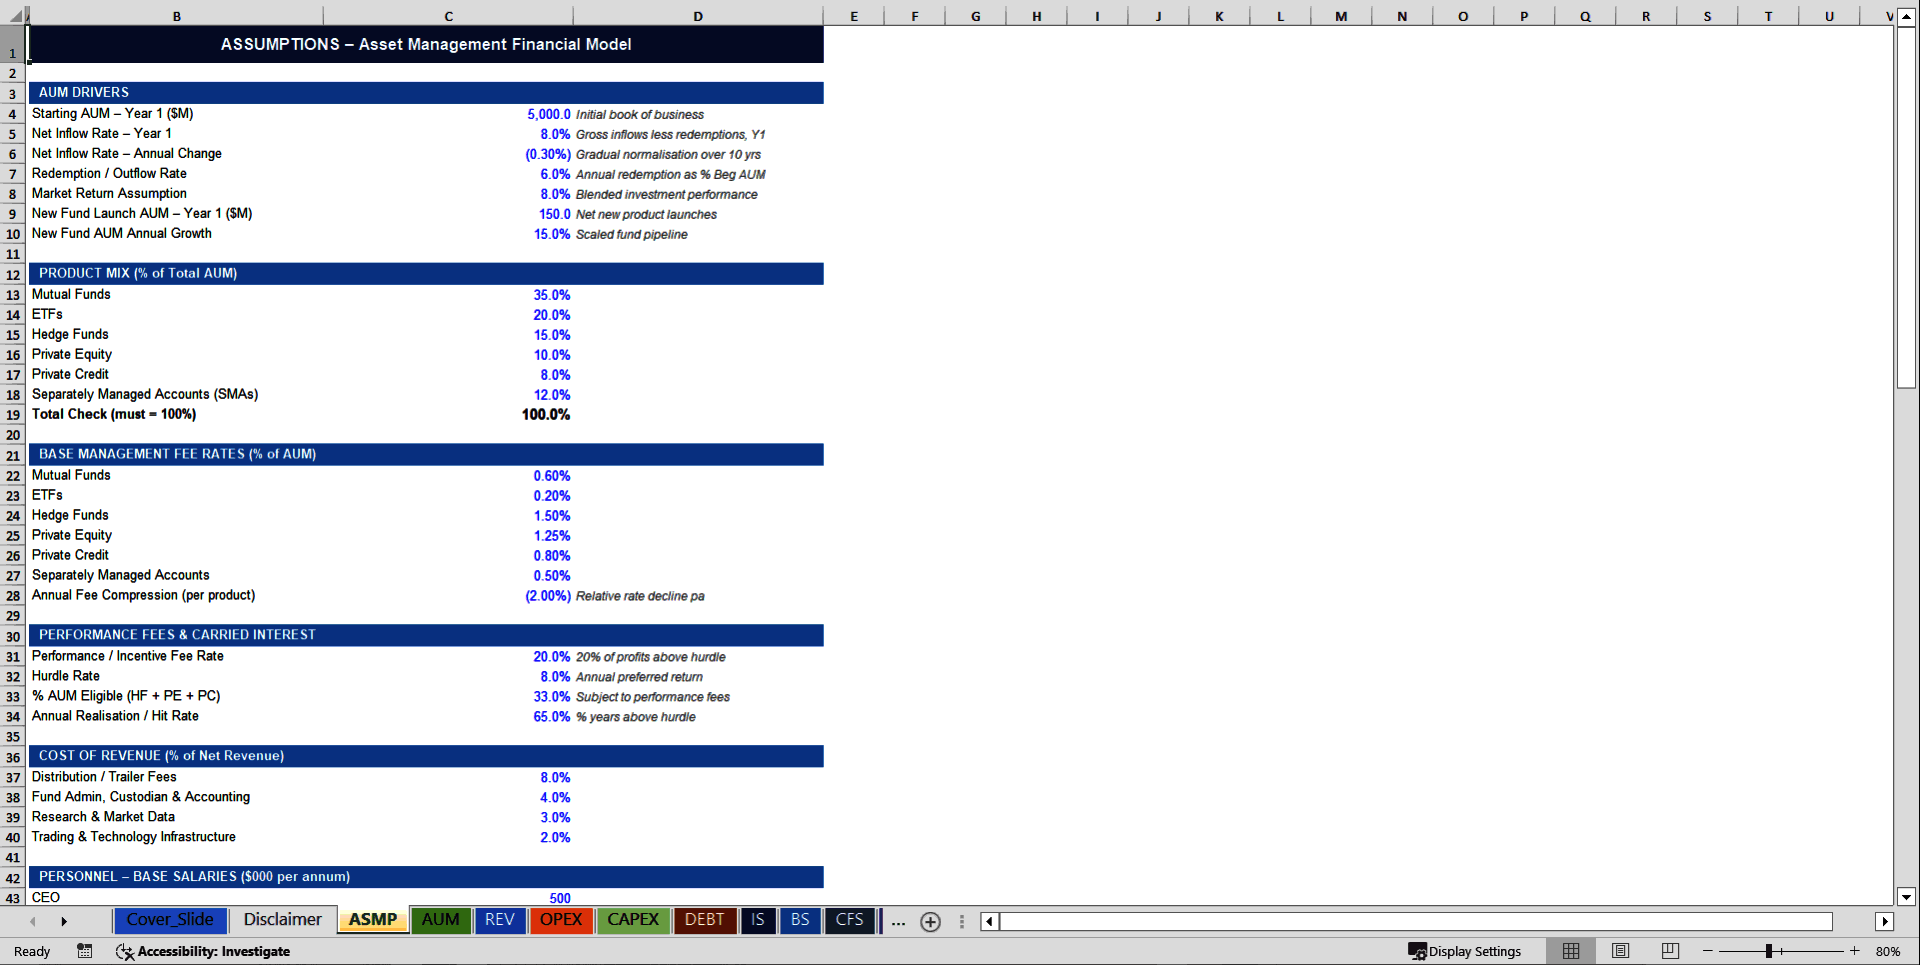
2️⃣ Assumptions Engine – Single Source of Truth
101 blue input cells. One tab. Zero hardcoded forecast numbers anywhere else in the model.
Centralized input section controlling the entire 10-year model. Change one cell. Every number across all 11 sheets recalculates instantly.
Includes:
AUM Drivers:
• Starting AUM – $5,000M (Year 1)
• Net Inflow Rate – 8.0% (Year 1), declining 0.30% per year as the platform matures
• Redemption / Outflow Rate – 6.0% of beginning AUM per year
• Market Return Assumption – 8.0% blended annual investment performance
• New Fund Launch AUM – $150M (Year 1), growing 15% per year as fund pipeline builds
Product Mix (% of Total AUM):
• Mutual Funds: 35% | ETFs: 20% | Hedge Funds: 15% | Private Equity: 10% | Private Credit: 8% | SMAs: 12%
Management Fee Rates by Product:
• Mutual Funds: 0.60% | ETFs: 0.20% | Hedge Funds: 1.50% | Private Equity: 1.25% | Private Credit: 0.80% | SMAs: 0.50%
• Annual Fee Compression: −2.0% relative rate decline per product per year
Performance Fee Structure:
• Incentive Fee Rate: 20% of profits above hurdle
• Hurdle Rate: 8.0% preferred return
• Eligible AUM (HF + PE + PC): 33% of total AUM
• Annual Realisation / Hit Rate: 65%
Cost of Revenue (% of Net Revenue):
• Distribution / Trailer Fees: 8% | Fund Administration & Custodian: 4% | Research & Market Data: 3% | Trading & Technology: 2%
Personnel Salaries ($ per annum):
• CEO: $500K | CIO: $450K | CFO: $300K | Portfolio Managers: $350K | Analysts: $150K | Quant Researchers: $200K | Sales: $175K | Marketing: $120K | Compliance: $160K | Operations: $110K | Client Service: $100K
Compensation Structure:
• Annual Salary Raise: 3.5% | Bonus: 35% of base | Benefits: 20% of base | Payroll Tax: 8% | SBC: 3% of revenue
Annual Headcount Additions by role: PM +1 | Analysts +2 | Quants +1 | Sales +2 | Marketing +1 | Compliance +1 | Operations +1 | Client Service +1
CapEx Assumptions:
• Technology CapEx – $3.0M (Year 1), growing 10% per year
• Other CapEx – $1.5M (Year 1), growing 5% per year
• Capitalisation Rate – 70% | Technology Asset Life – 3 years | Other Asset Life – 5 years
Financial Assumptions:
• Tax Rate: 25% | Interest Rate: 5.5% | Inflation: 2.5% | Dividend Payout: 15%
Working Capital Days:
• AR Days: 45 | Prepaid Days: 15 | AP Days: 30 | Accrued Expense Days: 20
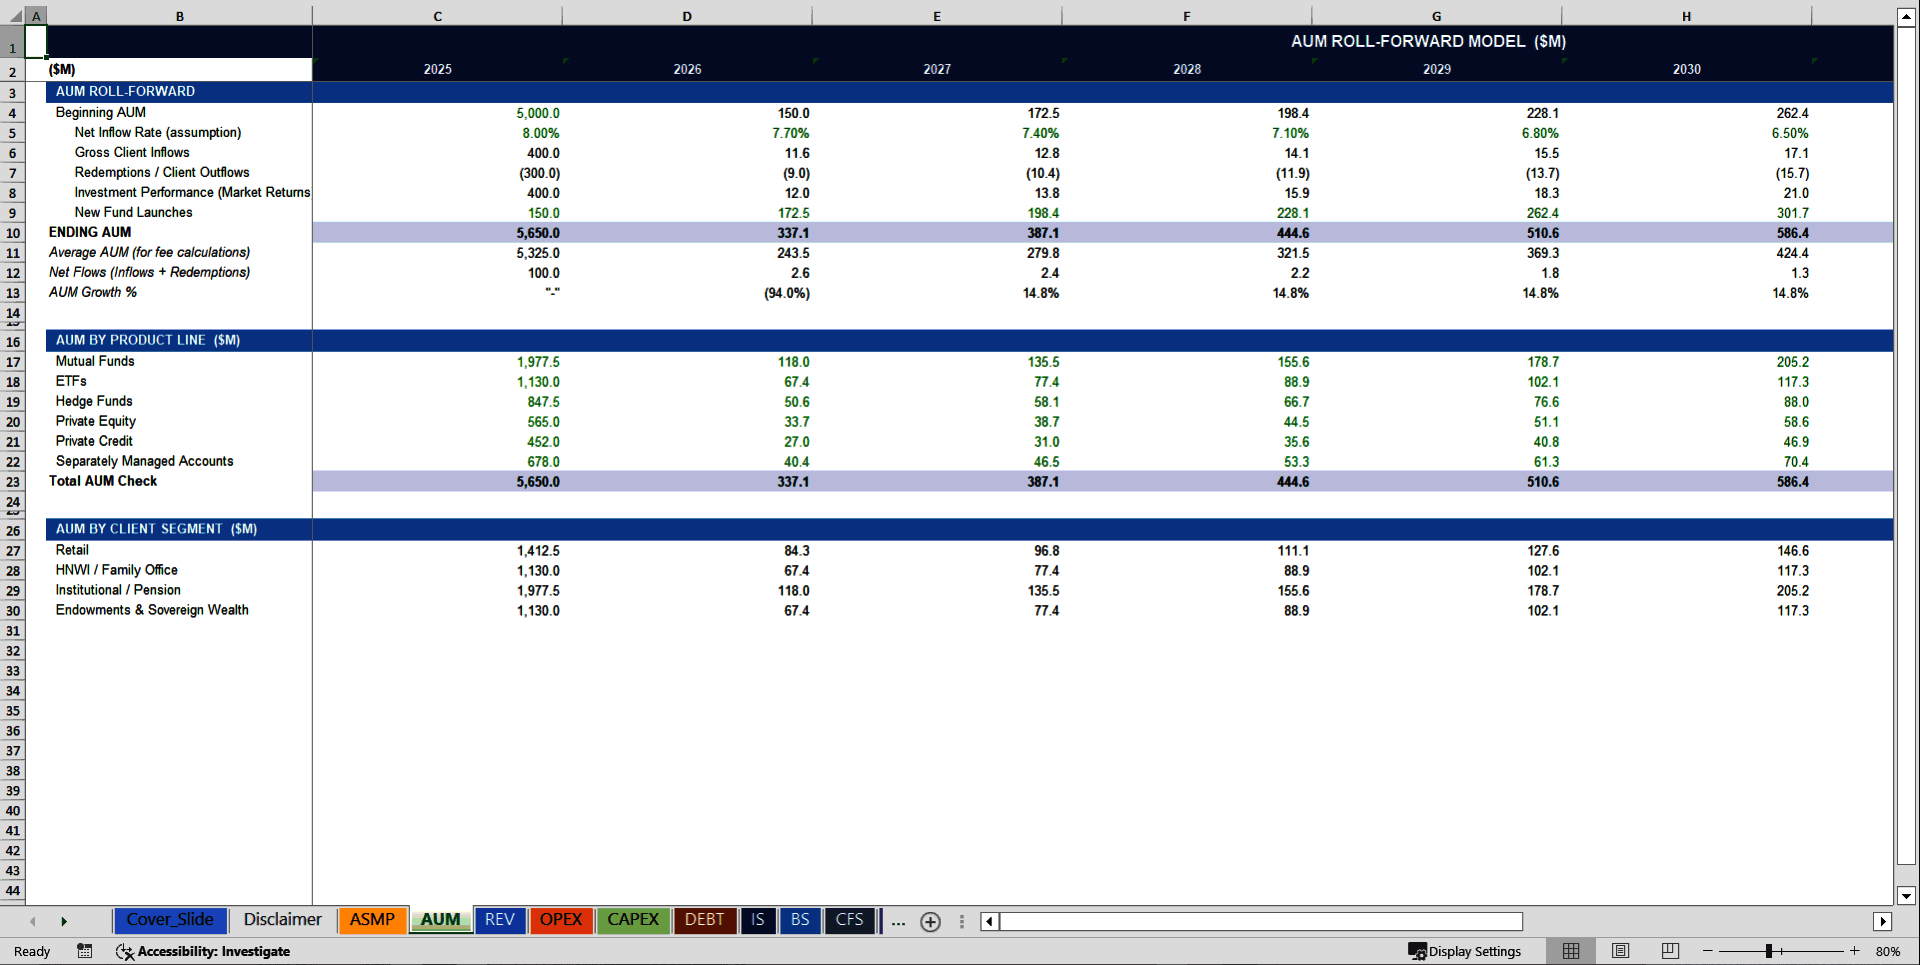
3️⃣ AUM Roll-Forward Model
The entire revenue engine is built on institutional-grade AUM mechanics – not a growth rate assumption:
The Core AUM Formula, rebuilt every year:
> Ending AUM = Beginning AUM + Gross Client Inflows + Redemptions + Investment Performance + New Fund Launches
Breaking that down in practice:
• Beginning AUM – $5,000M (Year 1), then prior year's ending balance
• Gross Client Inflows – Beginning AUM × net inflow rate (8.0% declining over time)
• Redemptions – −6.0% of beginning AUM, applied every year
• Investment Performance – 8.0% market return applied to beginning AUM
• New Fund Launches – $150M in Year 1, growing 15% annually as product pipeline compounds
AUM by Product Line (6 strategies, fully broken out each year, in $M):
Mutual Funds | ETFs | Hedge Funds | Private Equity | Private Credit | SMAs
AUM by Client Segment (4 segments, proportionally calculated each year):
Retail | HNWI & Family Office | Institutional & Pension | Endowments & Sovereign Wealth
Every revenue line, every fee rate, every performance fee calculation pulls from this roll-forward. Change the market return assumption. Change the inflow rate. The entire model cascades – instantly.
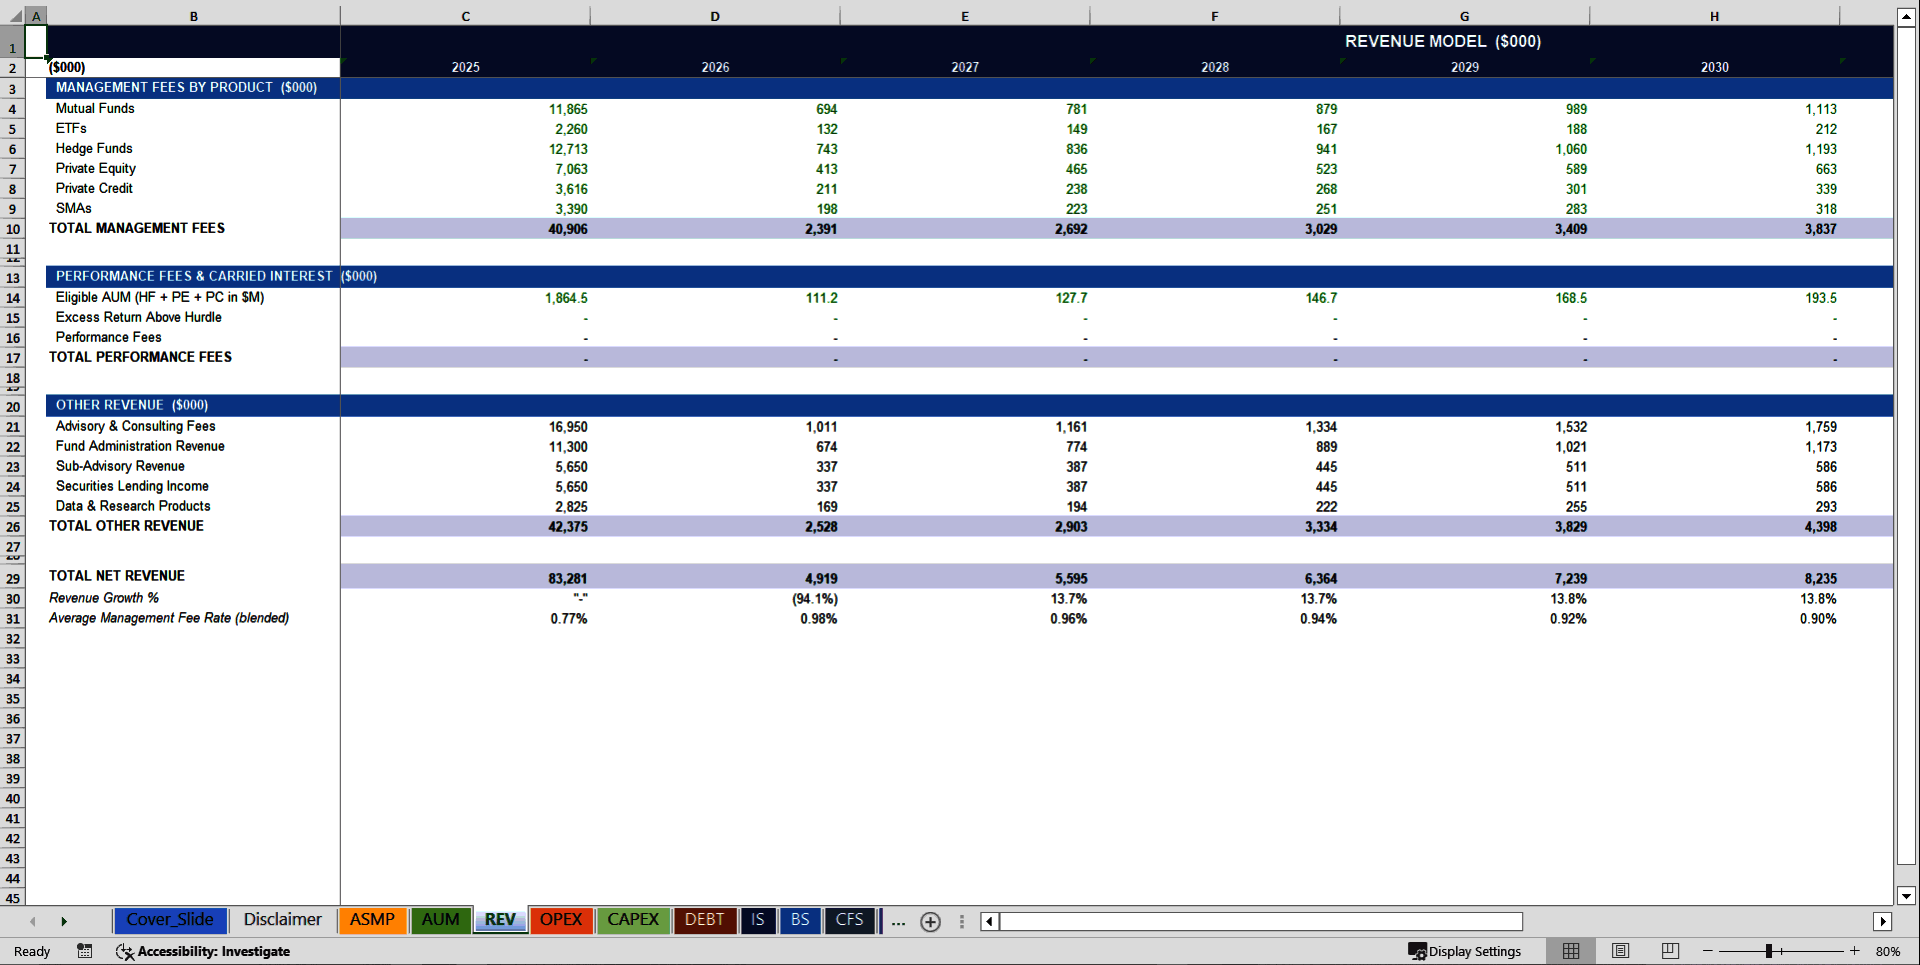
4️⃣ Revenue Model – Built Like a Real Asset Manager
The model does not use "Revenue = AUM × Rate." It builds revenue from the product level up:
Management Fees (the primary revenue engine):
• Mutual Fund AUM × 0.60% (with −2% annual compression) = Mutual Fund Management Fees
• ETF AUM × 0.20% (with −2% annual compression) = ETF Management Fees
• Hedge Fund AUM × 1.50% (with −2% annual compression) = Hedge Fund Management Fees
• Private Equity AUM × 1.25% (with −2% annual compression) = PE Management Fees
• Private Credit AUM × 0.80% (with −2% annual compression) = Private Credit Fees
• SMA AUM × 0.50% (with −2% annual compression) = SMA Management Fees
Performance Fees & Carried Interest:
• Eligible AUM (HF + PE + PC) × Excess Return Above Hurdle × 20% Incentive Rate × 65% Hit Rate
• Built at the economics level – not an arbitrary percentage of revenue
5 Ancillary Revenue Streams (AUM-linked):
• Advisory & Consulting Fees: 0.30% of AUM
• Fund Administration Revenue: 0.20% of AUM
• Sub-Advisory Revenue: 0.10% of AUM
• Securities Lending Income: 0.10% of AUM
• Data & Research Products: 0.05% of AUM
This architecture lets you stress-test product mix, inflow assumptions, fee rates, and performance assumptions completely independently before committing to a single LP capital raise.
5️⃣ Cost of Revenue – Real Fund-Level Profitability
Track profitability at the product and strategy level:
COGS – Operationally Driven, Not Estimated:
• Distribution / Trailer Fees – 8.0% of net revenue, driven by retail and platform AUM
• Fund Administration & Custodian Fees – 4.0% of net revenue
• Research & Market Data Subscriptions – 3.0% of net revenue
• Trading & Technology Infrastructure – 2.0% of net revenue
Gross Margin dynamically calculated as net revenue minus all four COGS lines – and it expands as AUM scale reduces the relative weight of fixed-cost fund administration.
Stop guessing your strategy-level economics. Know exactly what every product line costs to run before raising the next fund.
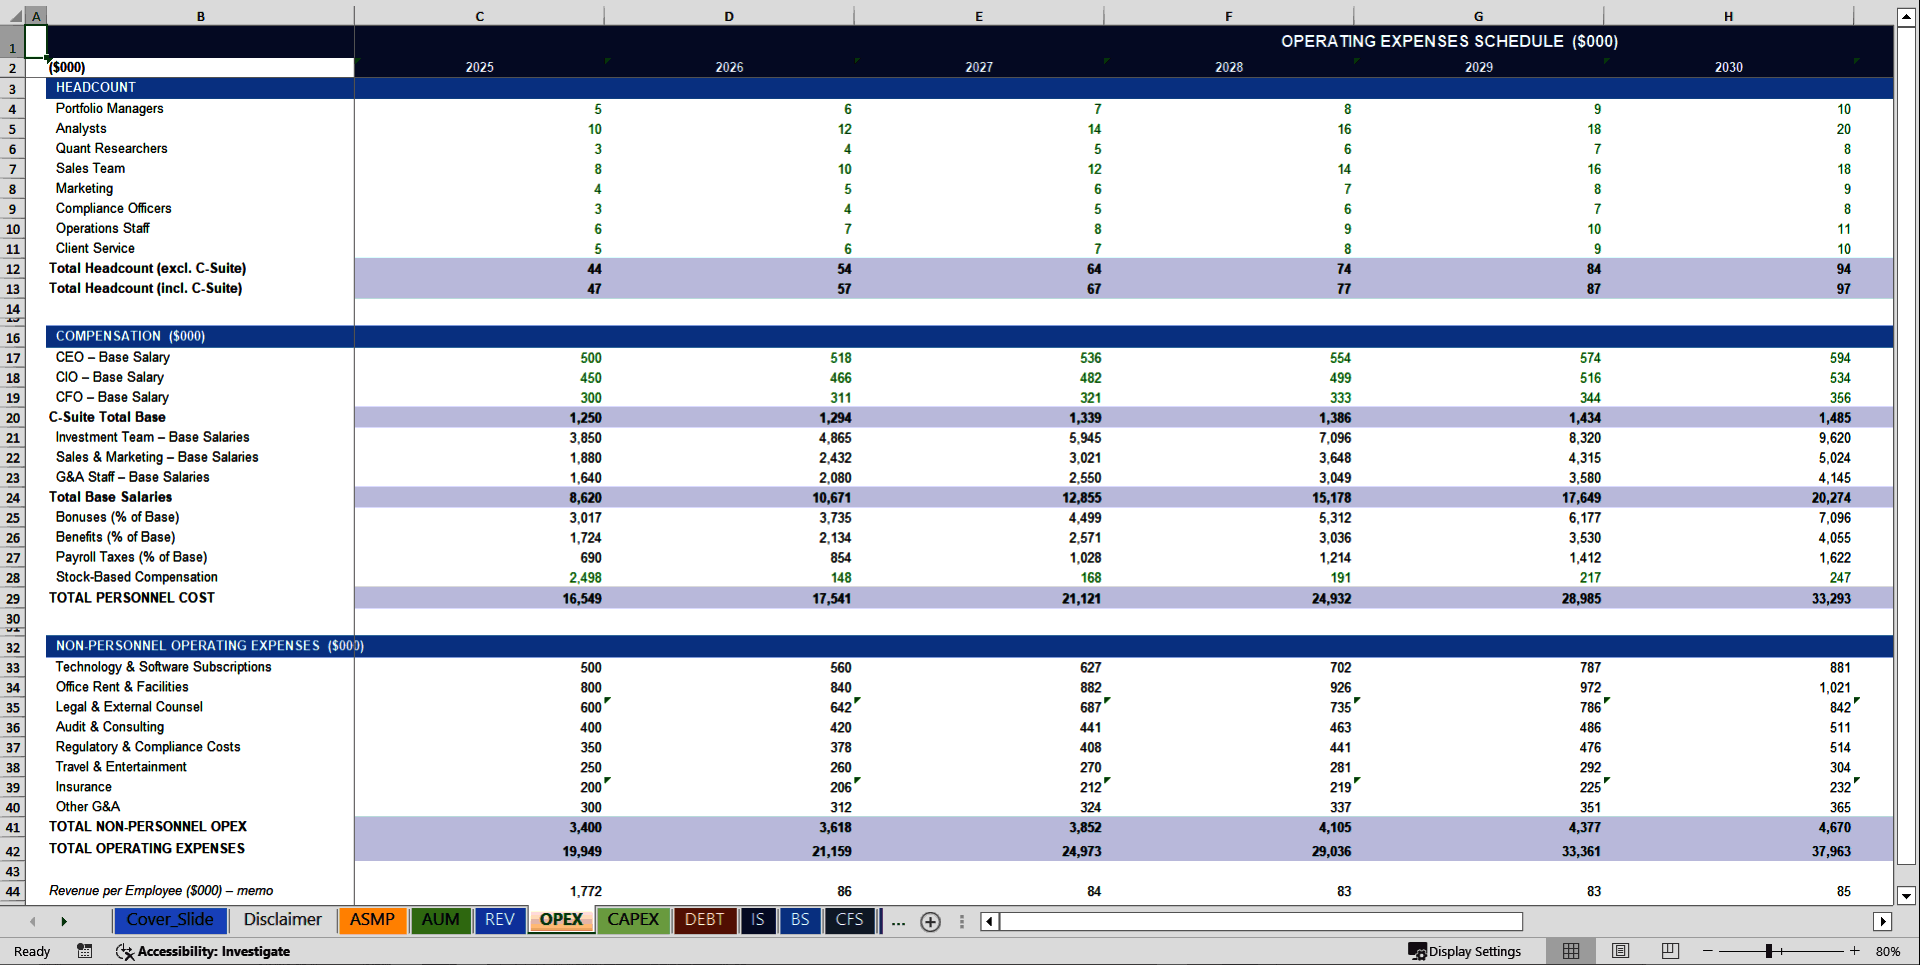
# 6️⃣ Operating Expenses – Fully Built, Fully Linked
Headcount is your largest controllable cost. This model tracks every salary, every role, every hire.
Investment Management:
Portfolio Managers | Analysts | Quant Researchers – individual salaries, annual additions, inflation escalation
Sales & Distribution:
Institutional Sales | Marketing – individual salaries, annual additions, commission structure
G&A & C-Suite:
CEO | CIO | CFO | Compliance | Operations | Client Service – individually modeled, compounding at 3.5% per year
Compensation Loading (all roles):
• Bonus: 35% of base | Benefits: 20% of base | Payroll Tax: 8% of base | SBC: 3% of revenue
Non-Personnel OpEx (8 cost lines, individually escalated):
Technology & Software | Office Rent & Facilities | Legal & External Counsel | Audit & Consulting | Regulatory & Compliance | Travel & Entertainment | Insurance | Other G&A
Year 1 Total Operating Expenses – tightly controlled, below gross profit
Year 10 Total Operating Expenses – absorbing scale cost growth while EBITDA margin expands to ~60%
The EBITDA margin expansion story is built into the model mechanics – not assumed as an input.
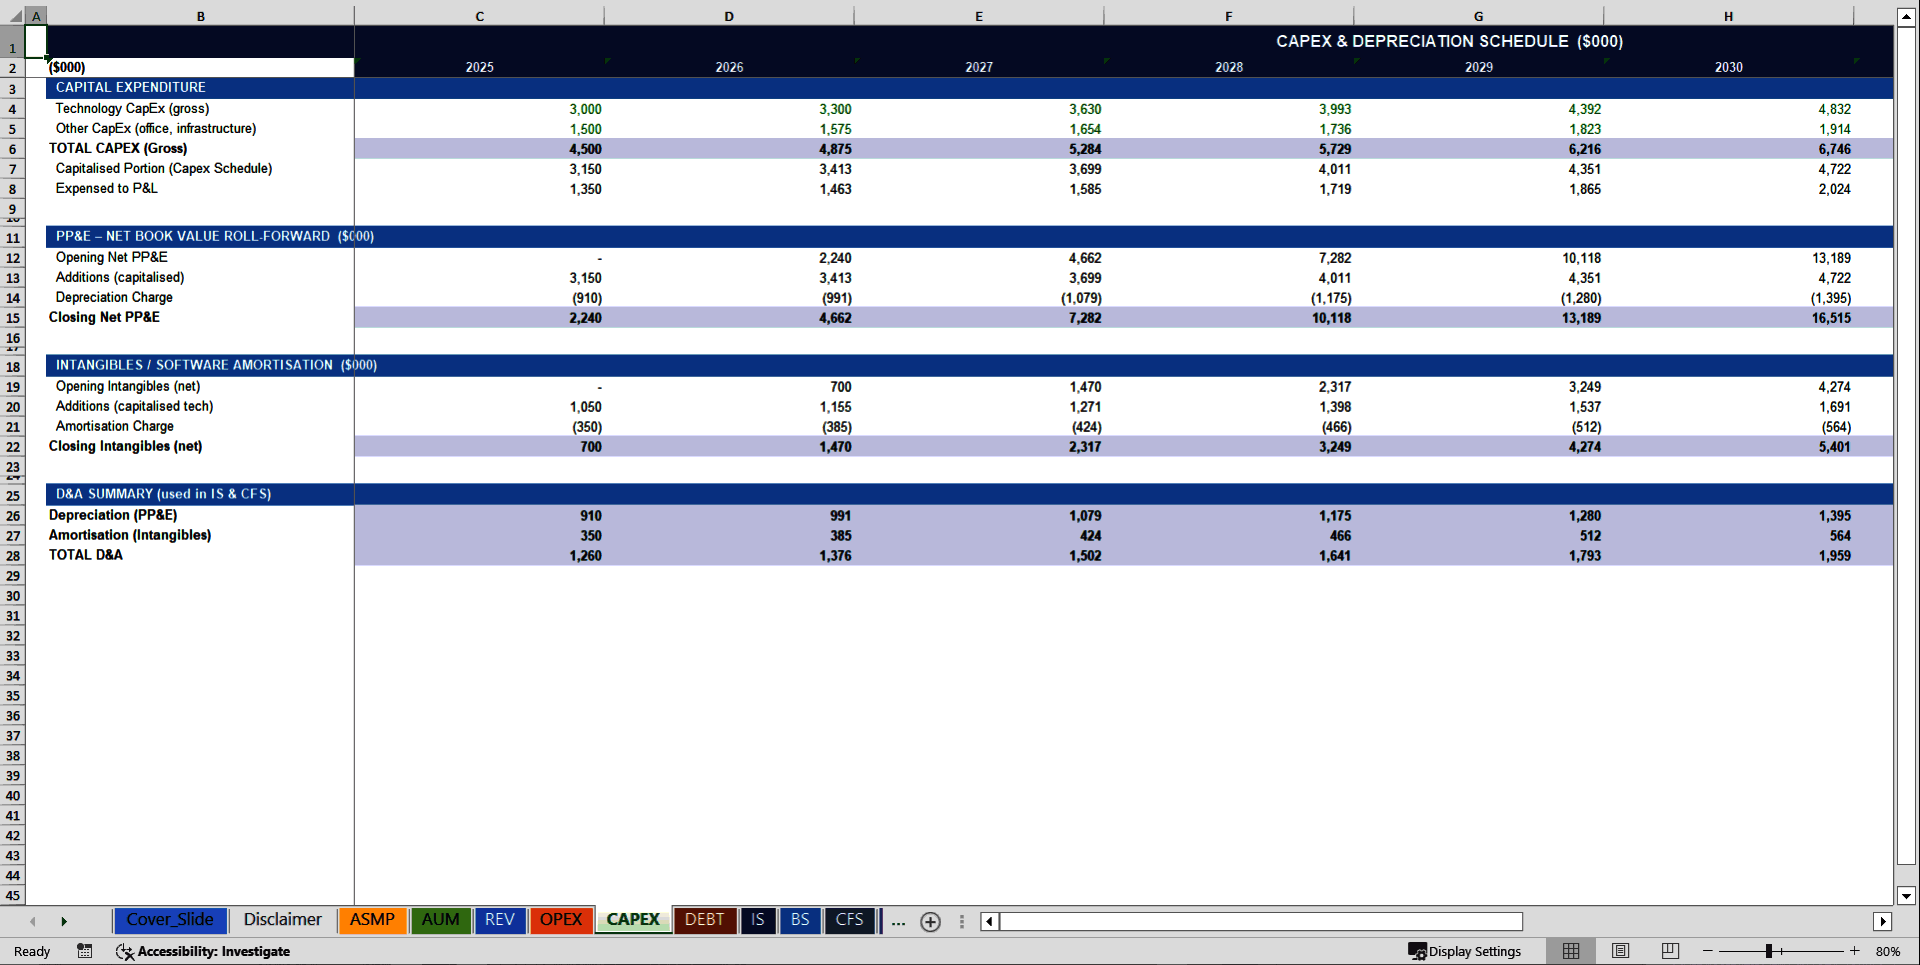
7️⃣ CapEx & Depreciation Schedule
Institutional-grade technology asset tracking:
Technology Capital Expenditures:
• Portfolio management platforms, trading systems, data infrastructure, analytics & AI systems, CRM
• $3.0M (Year 1), growing 10% per year as the technology stack scales with AUM
Other Capital Expenditures:
• Office build-out, security infrastructure, operations equipment
• $1.5M (Year 1), growing 5% per year
Capitalisation vs. Expense Policy:
• 70% of gross CapEx capitalised onto the Balance Sheet
• 30% of gross CapEx expensed directly to the P&L
PP&E Net Book Value Roll-Forward:
• Opening NBV → Capitalised Additions → Depreciation Charge → Closing NBV
• Depreciation feeds directly into D&A on the Income Statement and non-cash add-back on the Cash Flow Statement
Intangibles / Software Amortisation Roll-Forward:
• Separate schedule for capitalised technology software
• Amortisation charge feeds directly into EBIT and CFS
D&A Summary (used in IS and CFS):
Depreciation (PP&E) + Amortisation (Intangibles) = Total D&A – fully linked, zero hardcoded values
8️⃣ Debt & Equity Schedule
Management company capital structure – clean and institutional:
Debt Schedule:
• Opening Debt: $0 (Year 1 – clean-start equity-funded platform)
• Debt Drawdown and Repayment lines built and ready to model leverage if required
• Interest Expense calculated on average debt balance at 5.5% per annum
• Feeds directly to the Income Statement (interest expense) and Cash Flow Statement (CFF)
Equity Schedule:
• Opening Paid-In Capital: $20,000K (institutional seed capital)
• Retained Earnings roll-forward: opening balance + net income − dividends paid (15% payout ratio)
• SBC Reserve: cumulative stock-based compensation, building year-over-year as a non-cash equity instrument
• Total Equity feeds directly into the Balance Sheet shareholders' equity section
Dividends Paid – calculated as 15% of net income, feeds from IS to DEBT schedule to CFS financing section – fully linked, never hardcoded.
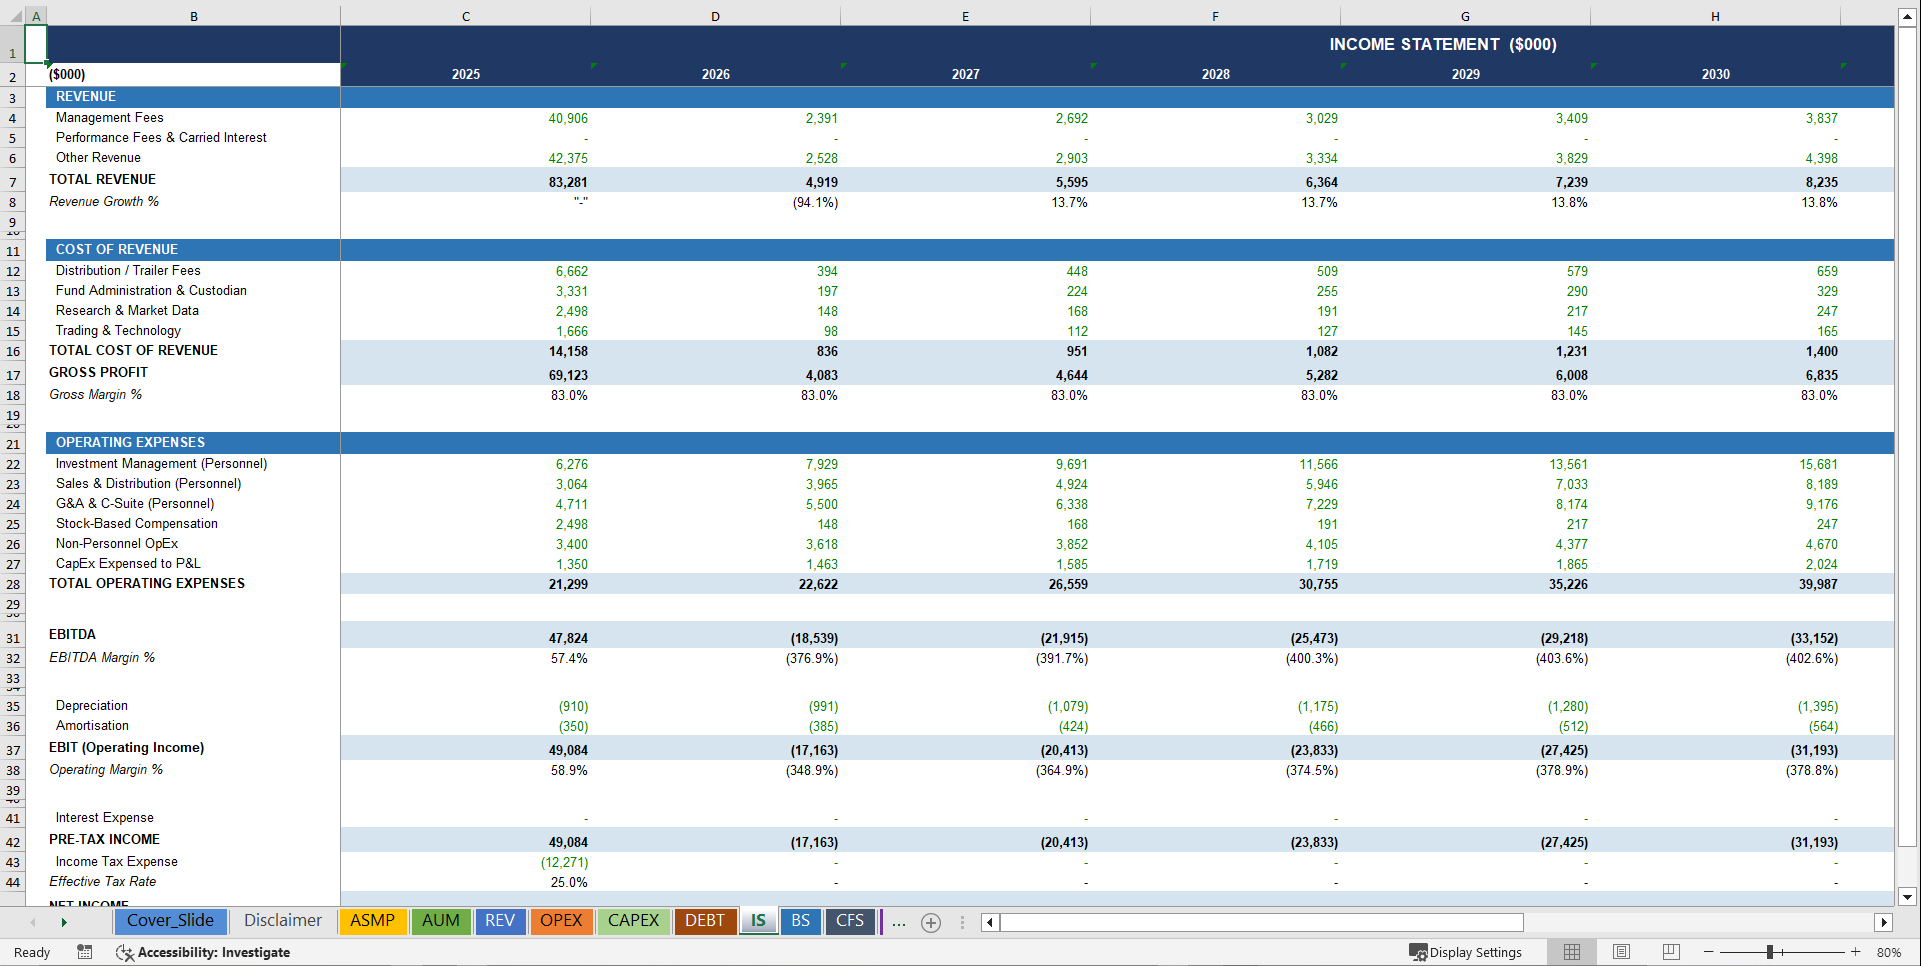
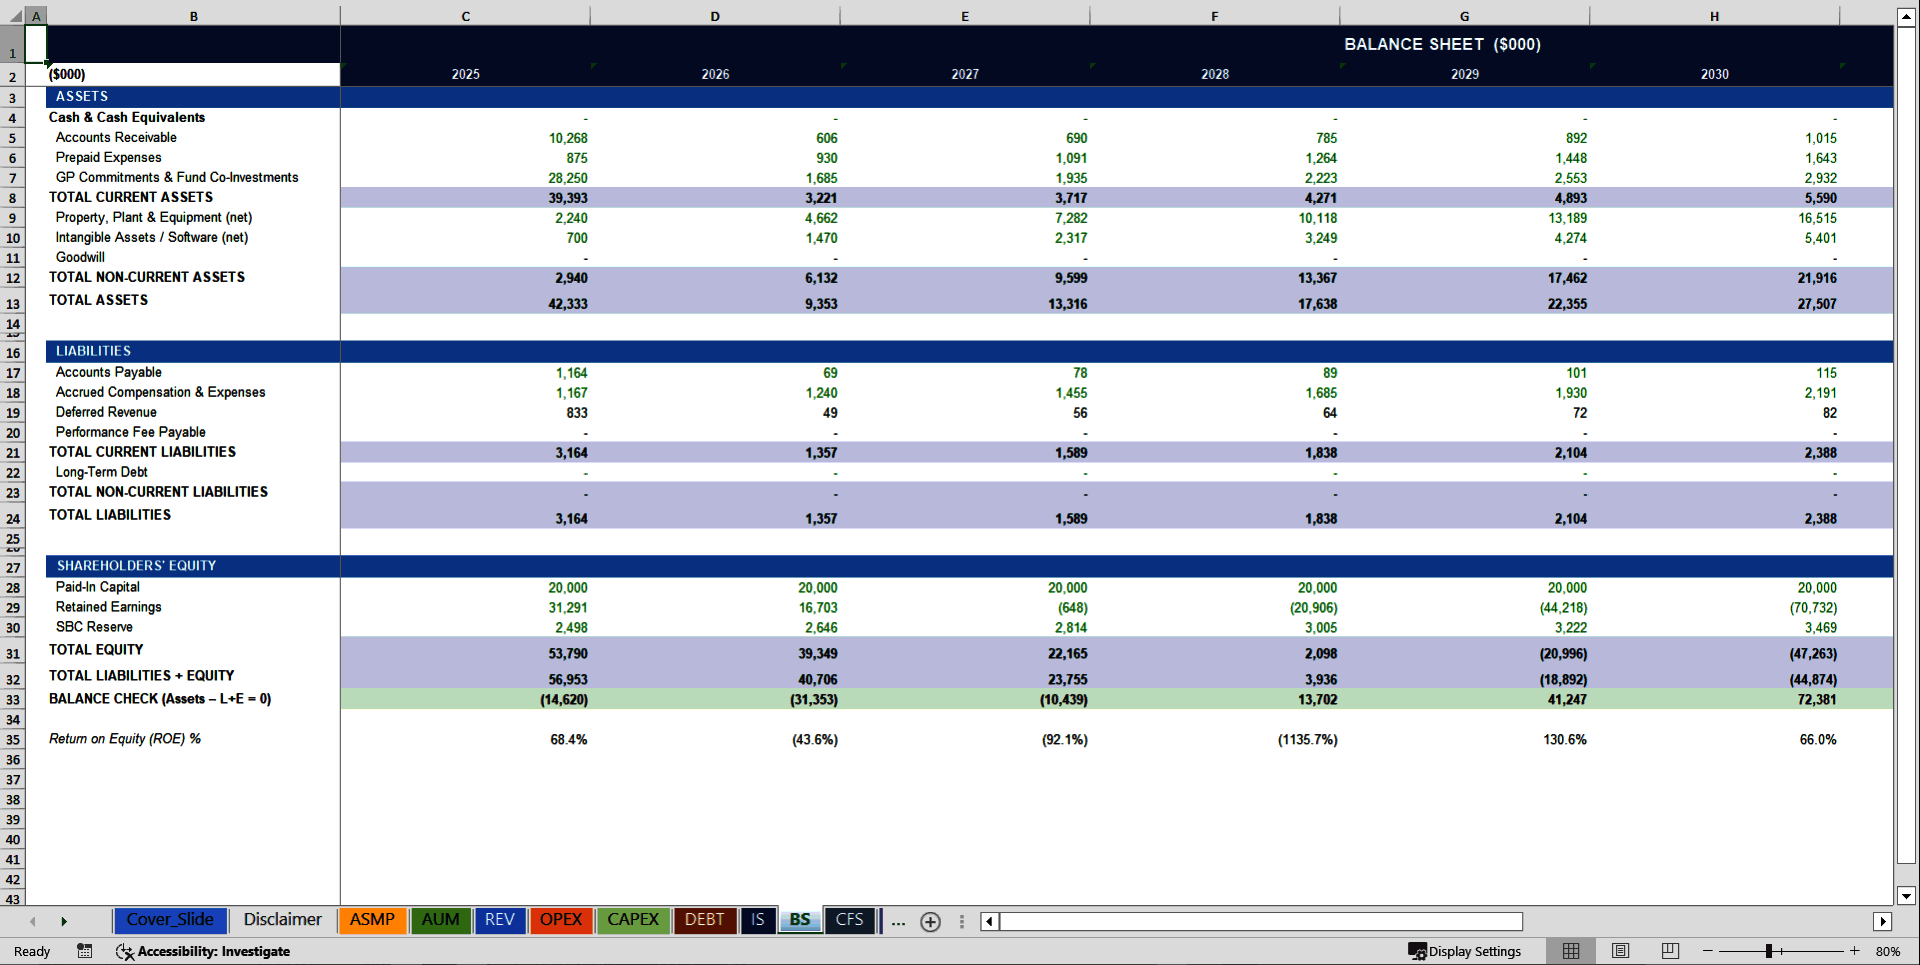
9️⃣ Integrated 3-Statement Financials – Everything Connects. Everything Balances.
✔ Income Statement – Management Fees + Performance Fees + Ancillary Revenue → Gross Profit → EBITDA → EBIT → Pre-Tax Income → Net Income – with gross margin %, EBITDA margin %, operating margin %, and net margin % displayed on every level
✔ Cash Flow Statement (Indirect Method) – Net Income + D&A + SBC ± Working Capital Changes = CFO | CapEx + GP Commitments = CFI | Debt Issuance / Repayment + Dividends = CFF | Ending Cash ties directly to Balance Sheet cash line – every single year
✔ Balance Sheet – Cash (from CFS ending balance), Accounts Receivable (45-day DSO), Prepaid Expenses (15-day), GP Fund Commitments (0.5% of AUM), Net PP&E (from CapEx schedule), Intangibles (from amortisation schedule), AP (30-day DPO), Accrued Expenses (20-day), Deferred Revenue, Performance Fee Payable, Long-Term Debt – dynamically balances to zero every year with live BALANCE CHECK cell
🔟 Scenario & Sensitivity Analysis
Instant visibility into your risk exposure across 5 named scenarios + a 25-cell stress matrix:
5 Named Scenarios (Year 5 key metrics – side-by-side):
• Base Case – Current assumptions, 8.0% market return, 8.0% net inflow rate, 2.0% annual fee compression
• High Growth – AUM 30% above base, revenue 30% above base, EBITDA 35% above base
• Bear Market – AUM 25% below base, revenue 30% below base, EBITDA 40% below base
• Fee Compression – Revenue 12% below base as fee rates decline faster than expected
• Institutional Inflow Boom – AUM 20% above base, revenue 25% above base driven by institutional mandate acceleration
25-Cell Sensitivity Matrix – Year 10 EBITDA:
5 Net Inflow Rate scenarios (3% → 14%) × 5 Market Return scenarios (4% → 12%) = 25 EBITDA stress-test combinations
• Green = EBITDA 10%+ above base
• Red = EBITDA 20%+ below base
• Live formulas – change any base assumption, all 25 cells update
Know your AUM downside before you launch the product, accept the anchor LP, sign the distribution agreement, or commit to the management company overhead.
1️⃣1️⃣ Executive Dashboard – Investor-Ready in One View
9 live KPI tiles:
• Total AUM Year 10 ($M) | Total Revenue Year 10 ($000) | EBITDA Year 10 ($000) | Net Income Year 10 ($000)
• EBITDA Margin Year 10 | Net Margin Year 10 | Return on Equity Year 10 | Cash Balance Year 10 | Total Headcount Year 10
6 embedded working charts (all live from model data):
1. AUM Growth – 10-year line chart ($M)
2. Revenue & EBITDA – 10-year clustered bar chart ($000)
3. Net Income – 10-year bar chart ($000)
4. Margin Trends – EBITDA % and Net % dual line chart
5. Revenue Mix – Management Fees vs. Performance Fees stacked bar chart ($000)
6. Headcount Growth – 10-year bar chart
Built for LP annual meetings, placement agent roadshows, GP seed capital negotiations, prime broker onboarding, bank credit facility applications, and board presentations.
💎 Why This Asset Management Model Is Different
✔ Built specifically for AUM-based investment management businesses – not a generic SaaS, real estate, or manufacturing template with "management fees" bolted on
✔ AUM roll-forward built at the mechanics level: inflows + redemptions + market performance + fund launches – not a straight-line growth rate
✔ Fee compression modeled as an annual compounding rate per product – because institutional fee pressure does not stop after Year 1
✔ Performance fees calculated at the hurdle rate economics level – not a "X% of revenue" assumption
✔ Six product lines with independent fee rates, AUM allocations, and revenue contribution – not a single blended rate
✔ Full headcount engine with 11 role types, individual salaries, and annual hiring plans – not a payroll percentage
✔ CapEx capitalized vs. expensed at 70/30, separately scheduled for technology and other assets – not a single annual D&A line
✔ Working capital modeled at AR/AP/Prepaid/Accrued days – not ignored because "asset managers are capital light"
✔ Balance sheet that dynamically balances, with live balance check cell – every single year
✔ 10-year forecast with institutional-grade operating leverage from $5B to ~$72B AUM and 35% to ~60% EBITDA margin expansion
✔ Net income positive and growing throughout the forecast period
✔ Institutional-level structure for LP capital raises, GP seeding, management company credit facilities, and strategic acquisition readiness
🧠 Built for Real Asset Management Profitability Decisions
This model allows you to:
• Raise institutional LP capital with AUM-driven projections that allocators can actually underwrite
• Secure management company credit facilities with financial proof packages that private credit lenders accept
• Negotiate better distribution agreements with data-backed margin analysis by product and channel
• Optimize product mix between liquid alternatives, private markets, and passive strategies before launching the next fund
• Model performance fee upside across different market return scenarios and hurdle rate structures
• Manage headcount pacing against AUM scale – hiring ahead of revenue or behind it destroys margin
• Forecast cash runway across a 10-year fund build-out with product-level precision and no revenue surprises
• Evaluate new strategy launches – private credit, infrastructure, real assets – by modeling incremental AUM, fee rate, and cost against existing overhead
• Stress-test fee compression before your next institutional mandate renewal or intermediary platform renegotiation
• Build for acquisition readiness – show a strategic buyer exactly what the management company earns at scale
Instead of hoping your fund management platform makes money – you know exactly when, why, and how it will.
🚨 The Cost of Not Having This
Without a proper asset management financial model, you risk:
• Running out of cash between fundraising closes during peak headcount build and technology investment
• Mispricing your fee schedule and destroying blended margin when institutional LPs compress your rates at first close
• Overhiring investment and compliance teams before AUM scale justifies the fixed cost base
• Underestimating fee compression drag on revenue when passive and semi-passive products commoditise your active strategies
• Getting rejected by GP seeding platforms, fund finance lenders, and institutional allocators because your model had no operational AUM logic
• Signing a distribution agreement that eliminates your economics at sub-$10B AUM
• Launching private markets products without modeling the J-curve carry delay against management company cash burn
• Losing anchor LP mandates because your revenue projections could not survive a 30-basis-point fee rate sensitivity question in due diligence
• Burning through the equity cushion in the first 24 months because your operating expense model assumed scale that did not materialise
One properly scaled asset management platform operating from $5B to $72B AUM can generate category-defining, compounding, capital-light returns.
But only if you model the fee economics, product mix, and operating leverage correctly from Day 1.
⚡ Stop Guessing. Start Modeling Like an Institutional Asset Manager.
If you are serious about:
• Launching a profitable registered investment adviser, alternative fund platform, or multi-product fund complex
• Scaling a multi-strategy AUM business across liquid, illiquid, and private markets simultaneously
• Raising LP capital, GP seed investment, or management company credit facilities with institutional-grade projections
• Securing distribution agreements, platform access, and intermediary channel economics
• Maximising management fee revenue, performance fee capture, and EBITDA margin at AUM scale
• Surviving fee compression, redemption cycles, performance drawdowns, and headcount cost inflation
• Building a performance-first, institutionally credible investment management brand
• Preparing for a GP stake sale, strategic acquisition, or management company IPO readiness
This model is your unfair advantage.
👉 Download the Asset Management Company Financial Model today – and launch, fund, and scale your investment management platform with the numbers, the margins, and the AUM mechanics to back it up.
Key Words:
Strategy & Transformation, Growth Strategy, Strategic Planning, Strategy Frameworks, Innovation Management, Pricing Strategy, Core Competencies, Strategy Development, Business Transformation, Marketing Plan Development, Product Strategy, Breakout Strategy, Competitive Advantage, Mission, Vision, Values, Strategy Deployment & Execution, Innovation, Vision Statement, Core Competencies Analysis, Corporate Strategy, Product Launch Strategy, BMI, Blue Ocean Strategy, Breakthrough Strategy, Business Model Innovation, Business Strategy Example, Corporate Transformation, Critical Success Factors, Customer Segmentation, Customer Value Proposition, Distinctive Capabilities, Enterprise Performance Management, KPI, Key Performance Indicators, Market Analysis, Market Entry Example, Market Entry Plan, Market Intelligence, Market Research, Market Segmentation, Market Sizing, Marketing, Michael Porter's Value Chain, Organizational Transformation, Performance Management, Performance Measurement, Platform Strategy, Product Go-to-Market Strategy, Reorganization, Restructuring, SWOT, SWOT Analysis, Service 4.0, Service Strategy, Service Transformation, Strategic Analysis, Strategic Plan Example, Strategy Deployment, Strategy Execution, Strategy Frameworks Compilation, Strategy Methodologies, Strategy Report Example, Value Chain, Value Chain Analysis, Value Innovation, Value Proposition, Vision Statement, Corporate Strategy, Business Development, Business plan pdf, business plan, PDF, Business Plan DOC, Business Plan Template, PPT, Market strategy playbook, strategic market planning, competitive analysis tools, market segmentation frameworks, growth strategy templates, product positioning strategy, market execution toolkit, strategic alignment playbook, KPI and OKR frameworks, business growth strategy guide, cross-functional strategy templates, market risk management, market strategy PowerPoint doc, guide, ebook, e-book ,McKinsey Change Playbook, Organizational change management toolkit, Change management frameworks 2025, Influence model for change, Change leadership strategies, Behavioral change in organizations, Change management PowerPoint templates, Transformational leadership in change, supply chain KPIs, supply chain KPI toolkit, supply chain PowerPoint template, logistics KPIs, procurement KPIs, inventory management KPIs, supply chain performance metrics, manufacturing KPIs, supply chain dashboard, supply chain strategy KPIs, reverse logistics KPIs, sustainability KPIs in supply chain, financial supply chain KPIs, warehouse KPIs, digital supply chain KPIs, 1200 KPIs, supply chain scorecard, KPI examples, supply chain templates, Corporate Finance SOPs, Finance SOP Excel Template, CFO Toolkit, Finance Department Procedures, Financial Planning SOPs, Treasury SOPs, Accounts Payable SOPs, Accounts Receivable SOPs, General Ledger SOPs, Accounting Policies Template, Internal Controls SOPs, Finance Process Standardization, Finance Operating Procedures, Finance Department Excel Template, FP&A Process Documentation, Corporate Finance Template, Finance SOP Toolkit, CFO Process Templates, Accounting SOP Package, Tax Compliance SOPs, Financial Risk Management Procedures.
NOTE: Our digital products are sold on an "as is" basis, making returns and refunds unavailable post-download. Please preview and inquire before purchasing. Please contact us before purchasing if you have any questions! This policy aligns with the standard Flevy Terms of Usage.
Got a question about the product? Email us at support@flevy.com or ask the author directly by using the "Ask the Author a Question" form. If you cannot view the preview above this document description, go here to view the large preview instead.
Source: Best Practices in Asset Management, Integrated Financial Model Excel: Asset Management Company 10-Year 3 Statement Financial Model Excel (XLSX) Spreadsheet, SB Consulting
ABOUT THE AUTHOR
SB Consulting is dedicated to empowering businesses to communicate their ideas with impact. This consulting firm specializes in teaching organizations how to create effective corporate and management presentations. With training from top-tier global consulting firms, including McKinsey, BCG, and Porsche Consulting, extensive expertise in presentation design and ... [read more]
Ask the Author a Question
You must be logged in to contact the author.
