
 Click main image to view in full screen.
AI Adoption Business Case & ROI Model with Thresholds – Excel XLSX
Excel (XLSX) + PowerPoint (PPTX)


BENEFITS OF THIS DOWNLOADABLE EXCEL DOCUMENT
- Produces a net present value, payback month and benefit-to-cost ratio for an AI roll-out across a defined population of employees.
- Solves the two thresholds at which the case fails - the hours saved per user and the adoption rate - and states the headroom above each.
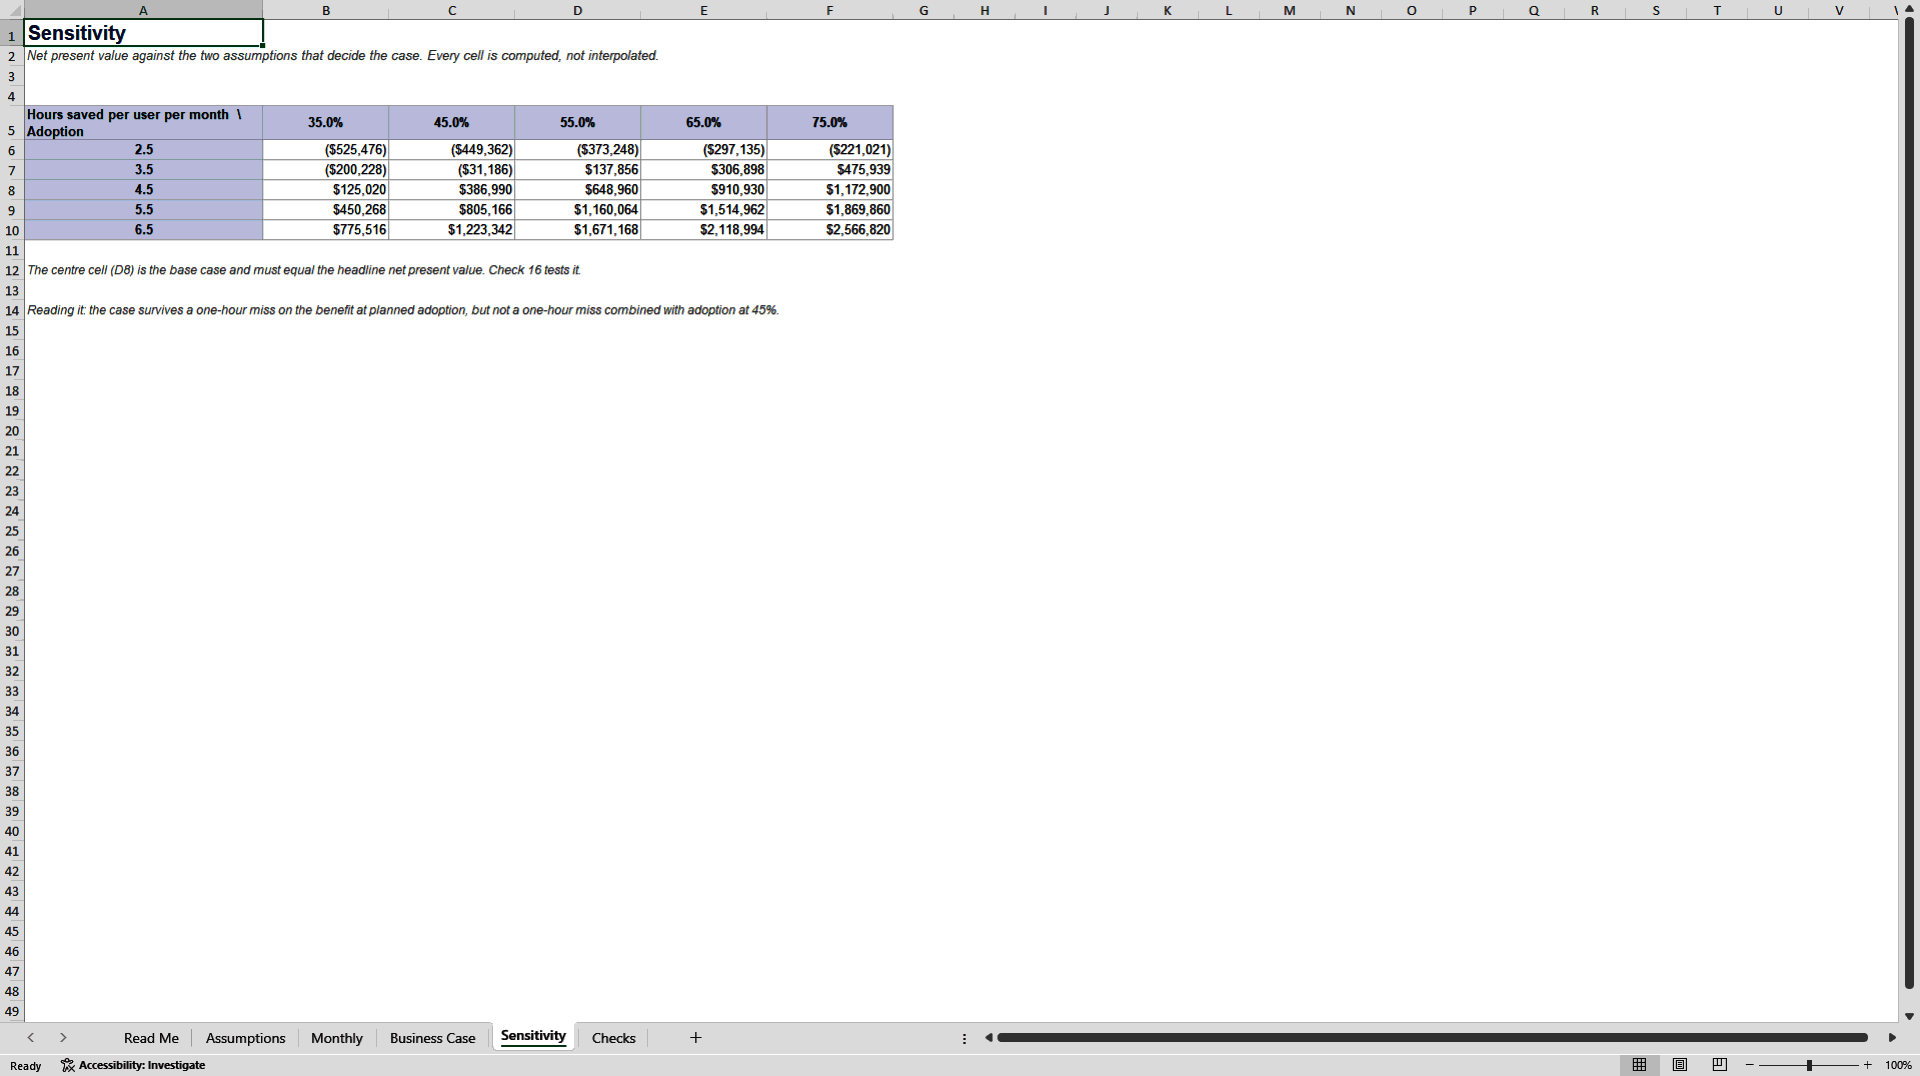
- Ships with an exact five-by-five sensitivity grid and eighteen built-in checks, so the numbers can be defended line by line in committee.
BUSINESS CASE DEVELOPMENT EXCEL DESCRIPTION
Ask most AI business cases what the project is worth and you get a number with no failure condition attached. This workbook produces the number and the two points at which it stops being true.
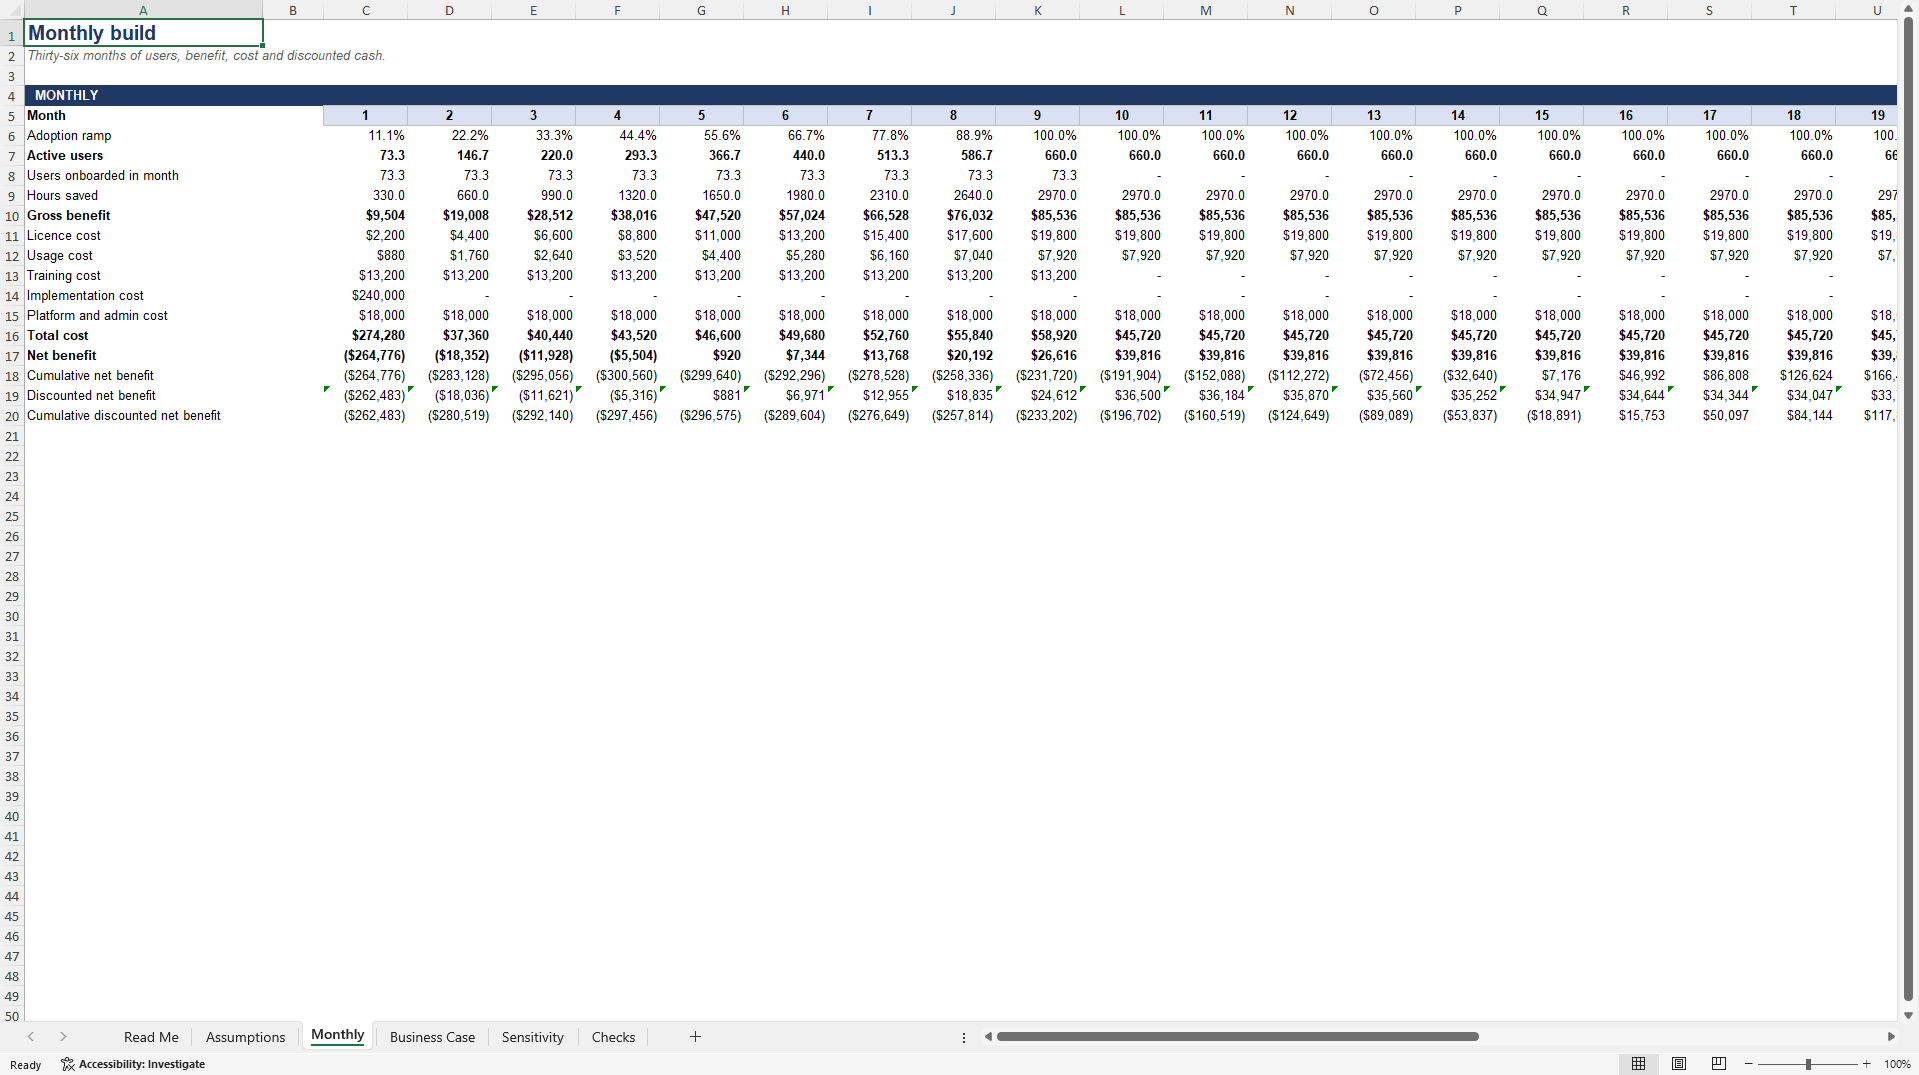
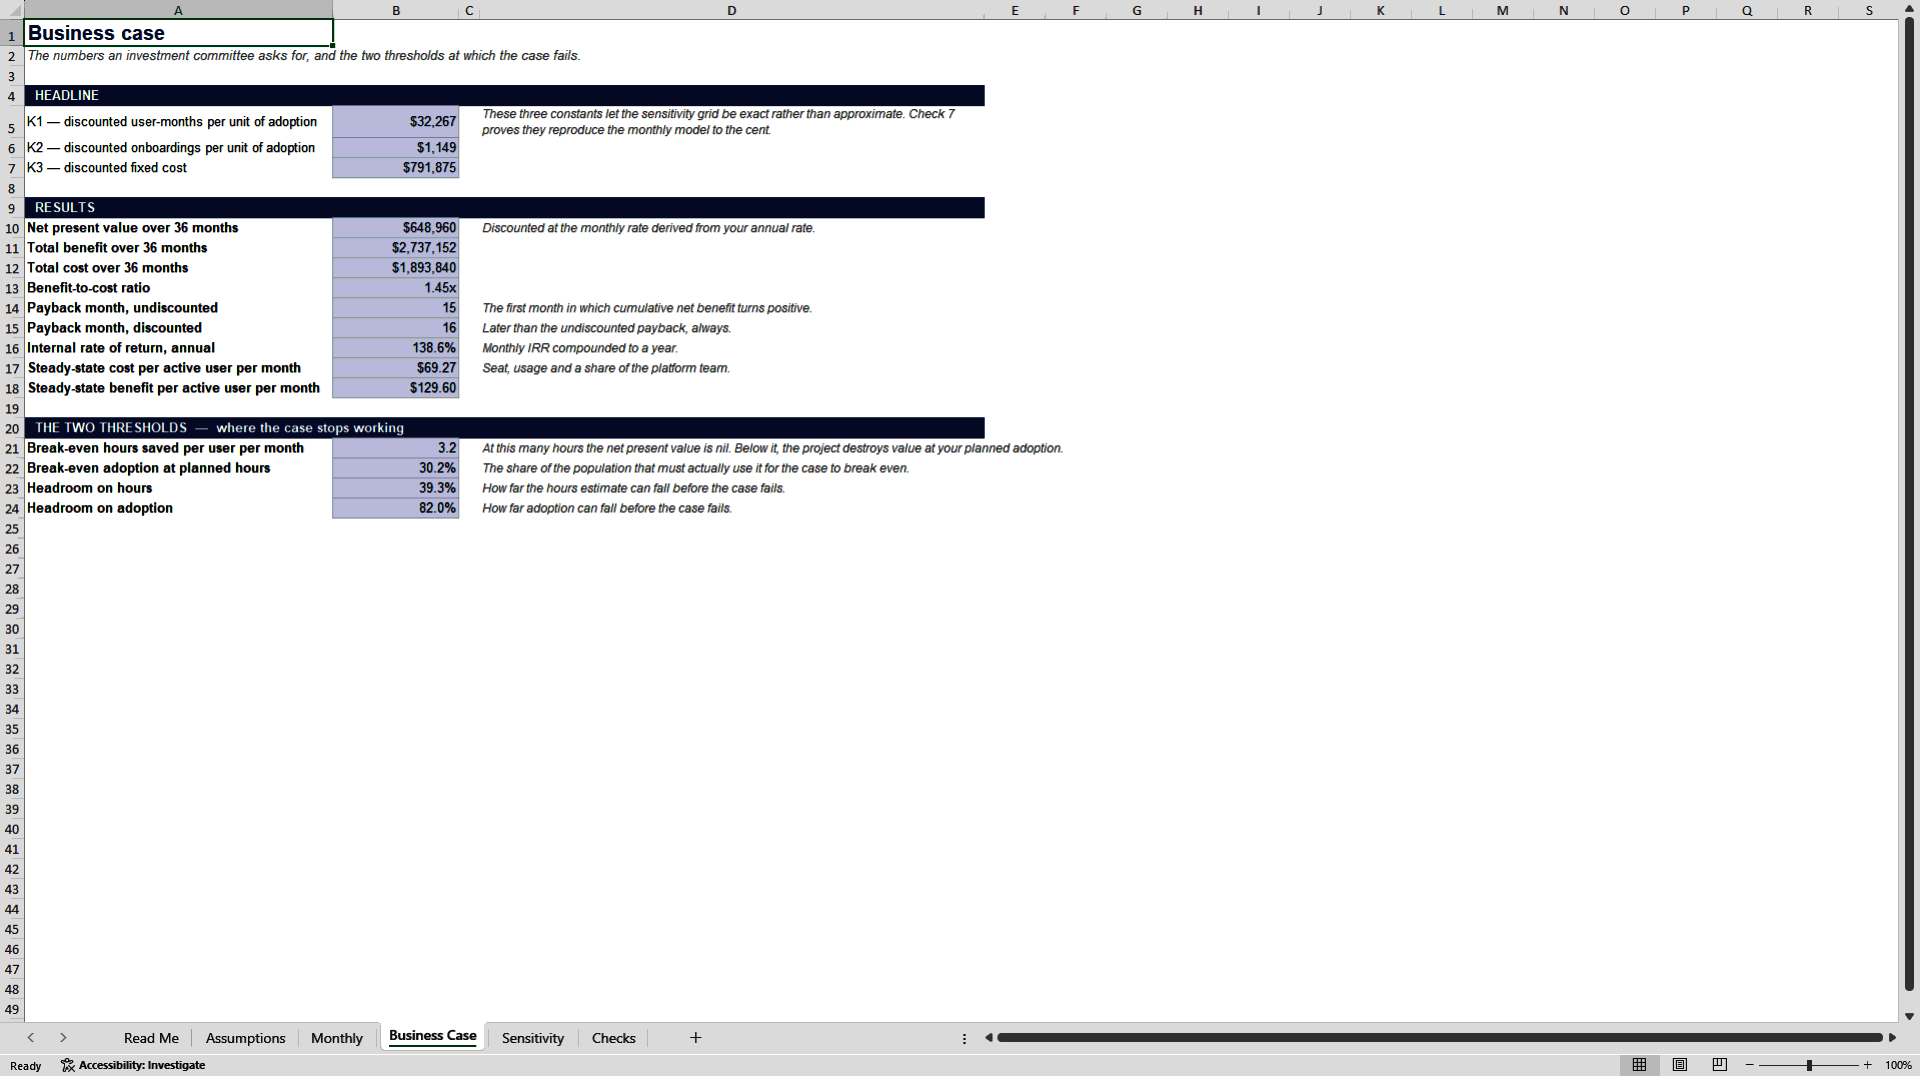
It takes a population of employees, the adoption you expect, the hours you believe each user saves and the price you pay per seat, and builds thirty-six months of users, benefit and cost. Out of that come a net present value, a payback month, a benefit-to-cost ratio, and the two thresholds that matter more than any of them: the hours saved per user at which the case breaks even, and the adoption rate at which it breaks even. Both are solved by inverting the model, not estimated, and both are put back through the model inside the file to prove the answer is nil.
WHAT MAKES IT DIFFERENT
Saved time is not treated as money. Hours saved are multiplied by a realisation rate before they become value, because an hour returned to a team that was not capacity-constrained is slack, not a saving. In the worked example the model counts sixty per cent of the time saved. Omitting that discount is the commonest way an AI business case overstates its return, and most templates on the market omit it entirely.
The sensitivity grid is exact rather than interpolated. Benefit and per-seat cost are linear in active users, so the whole case collapses to three discounted constants, and every cell in the five-by-five grid is the real net present value for that pair of assumptions. A built-in check proves those constants reproduce the monthly model to the cent, and another proves the centre of the grid equals the headline figure.
The committee question is answered before it is asked. The file states how far the hours estimate can fall before the case fails, how far adoption can fall, and what happens when both miss at once. In the worked example the case survives a full hour missed on the benefit, and survives adoption at forty-five per cent, but not both together.
WHAT IS IN IT
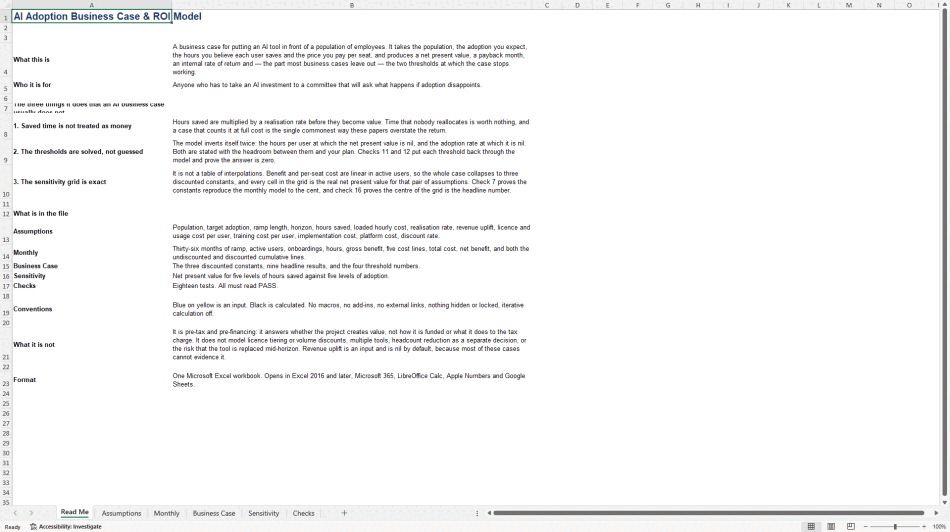
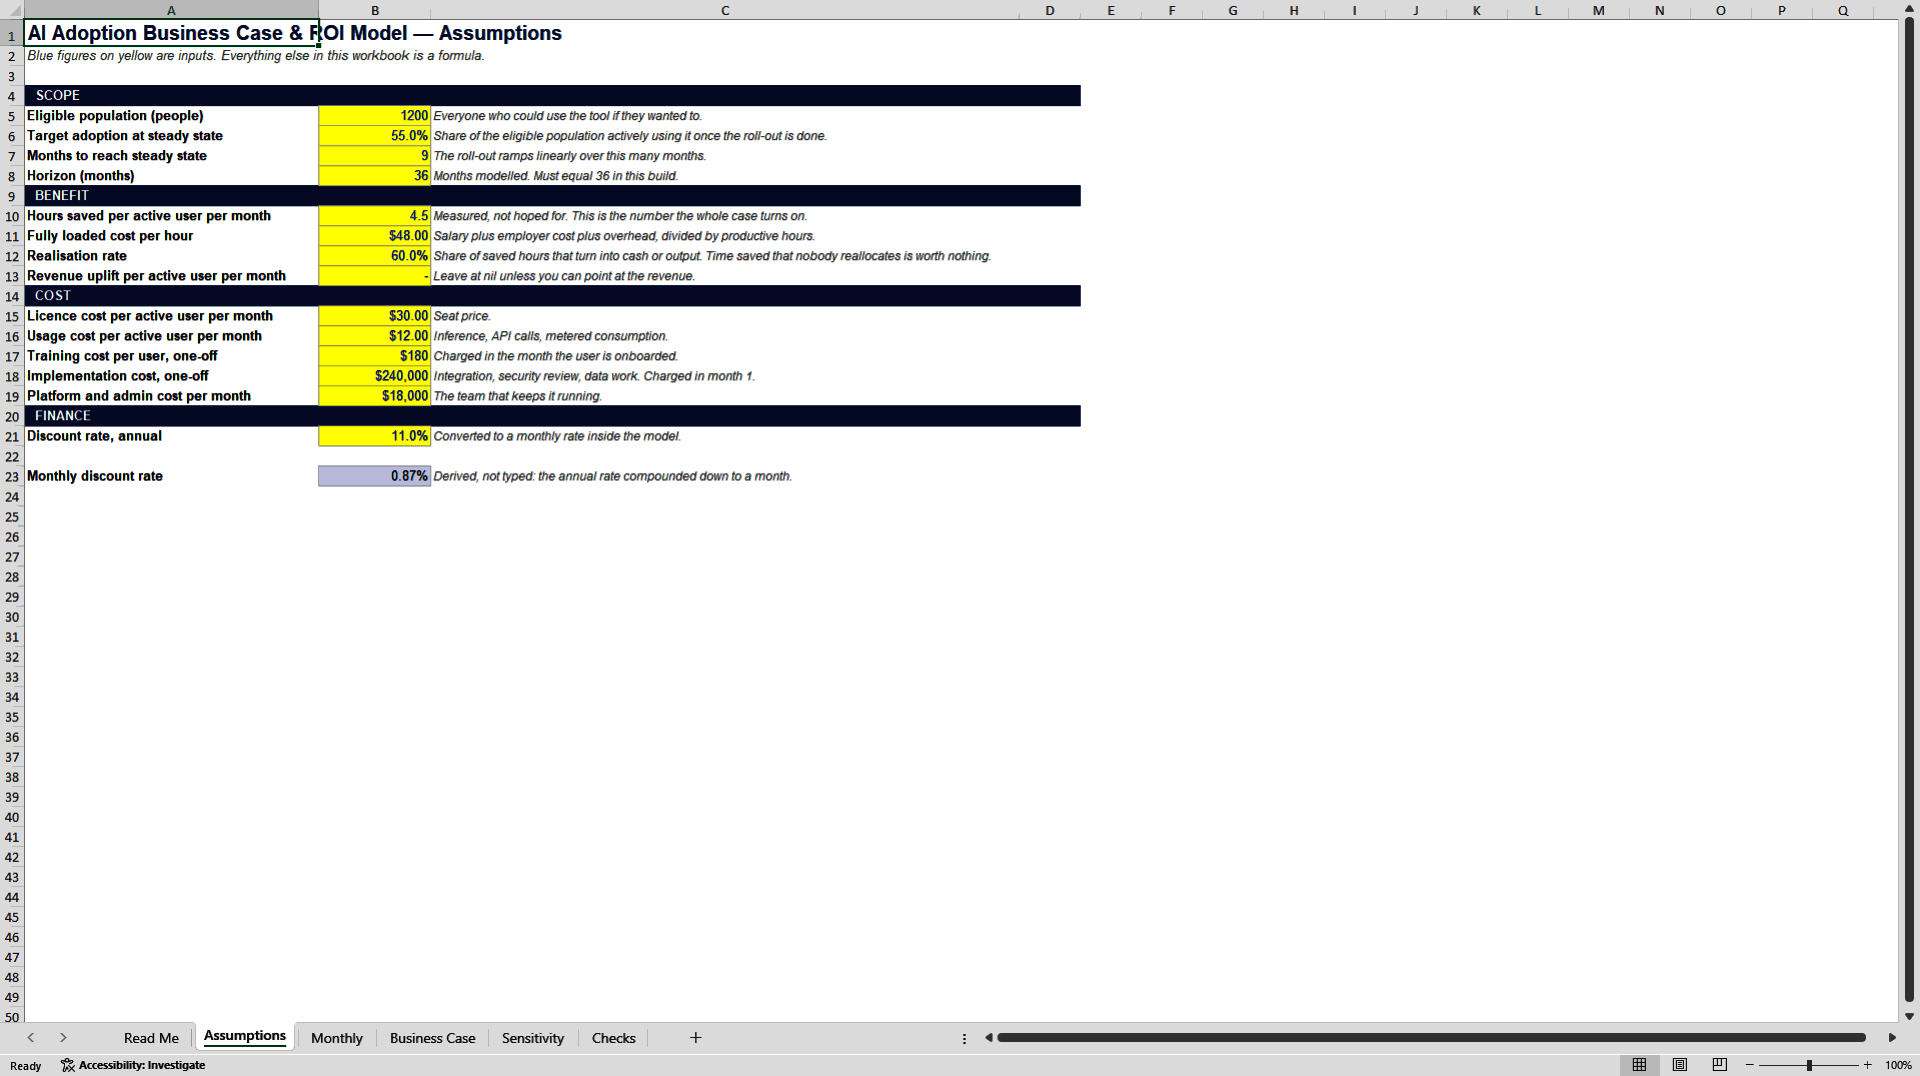
Six tabs. Assumptions holds every input in its own labelled cell: population, target adoption, ramp length, hours saved, fully loaded hourly cost, realisation rate, revenue uplift, licence and usage cost per user, training cost, implementation cost, platform cost and the discount rate. Monthly builds thirty-six months of ramp, active users, onboardings, hours, gross benefit, five separate cost lines, net benefit and both cumulative lines. Business Case holds the three discounted constants, nine headline results and the four threshold figures. Sensitivity shows net present value for five levels of hours against five levels of adoption. Checks holds eighteen tests, each re-deriving a number a different way from the sheet that produced it. Every one must read PASS before the file is used.
The accompanying PowerPoint deck is twenty-three slides in five sections: the decision and the recommendation, the case itself, how it fails, how to run it, and an appendix with every assumption. It is built to be presented to an investment committee as it stands, with the worked example in place, and edited assumption by assumption for your own numbers.
THE WORKED EXAMPLE
Twelve hundred eligible people, fifty-five per cent target adoption reached over nine months, four and a half hours saved per active user per month at forty-eight dollars an hour, sixty per cent realisation. Thirty dollars of licence and twelve of usage per user per month, a hundred and eighty dollars of training per user, two hundred and forty thousand of implementation and eighteen thousand a month of platform cost. Net present value of six hundred and forty-nine thousand dollars over thirty-six months, payback in month fifteen, benefit-to-cost of one point four five. Break-even at three point two hours and at thirty point two per cent adoption.
WHAT IT IS NOT
It is pre-tax and pre-financing: it answers whether the project creates value, not how it is funded. It does not model licence tiering or volume discounts, multiple tools, headcount reduction as a separate decision, or the tool being replaced mid-horizon. Revenue uplift is an input and is nil by default, because most of these cases cannot evidence it.
FORMAT
One Microsoft Excel workbook and one PowerPoint deck. No macros, no add-ins, no external links, no password protection, no locked cells, iterative calculation off. Blue on pale yellow is an input; nothing else should be typed into. Opens in Excel 2016 and later, Microsoft 365, LibreOffice Calc, Apple Numbers and Google Sheets.
Building this from scratch takes a competent financial modeller three to five days.
FREQUENTLY ASKED QUESTIONS
What is a realisation rate and why does it reduce my benefit? It is the share of saved hours that turns into cash or output. Time that nobody reallocates has no value, and counting it at full cost is how these cases overstate the return. Set it to one hundred per cent if you can defend that.
How do I know the sensitivity grid is right? Two of the eighteen checks test it. One proves the three constants behind the grid reproduce the full monthly model to the cent; the other proves the centre cell equals the headline net present value.
Can I change the horizon from thirty-six months? The grid is built for thirty-six. Shorten it by setting later months to nil adoption; extending it means adding columns to the Monthly tab and widening the ranges the checks use.
Does it handle more than one AI tool? One tool, one seat price, one usage rate. Two tools with different economics are two copies of the file.
Why is the internal rate of return so large? A single large outlay in month one followed by a fast ramp produces an arithmetically large rate that means very little. The payback month and the two thresholds are the numbers to present, and the deck leads on those.
Can I use the deck without the model? Yes, but every figure in it comes from the workbook. Change an assumption and the slides need restating; they are not linked.
Is anything locked or hidden? No. There are no macros, no protection, no hidden sheets and no external links. Every formula is visible and editable.
Got a question about the product? Email us at support@flevy.com or ask the author directly by using the "Ask the Author a Question" form. If you cannot view the preview above this document description, go here to view the large preview instead.
Source: Best Practices in Business Case Development, Artificial Intelligence Excel: AI Adoption Business Case & ROI Model with Thresholds Excel (XLSX) Spreadsheet, Paweł Dudek, Balancewright
ABOUT THE AUTHOR

Balancewright is Paweł Dudek. The catalogue covers project finance, fund and waterfall structures, corporate three-statement forecasting, working capital, valuation and FP&A -- built as working models rather than formatted templates.
Every model is formula-driven end to end. No locked cells, no passwords, no macros and no external links, so any calculation can be inspected, adapted and
... [read more]
Ask the Author a Question
You must be logged in to contact the author.




























