
 Click main image to view in full screen. Unlock all 14 preview images:
10-Year Integrated Three-Statement Financial Model – Excel XLSX
Excel (XLSX) + supplemental PDF


BENEFITS OF THIS DOWNLOADABLE EXCEL DOCUMENT
- Connect operating drivers to profit, cash, balance sheet, debt and valuation across ten forecast years.
- Compare Base, Upside and Downside assumptions while controlling the linked statements through one active scenario selector.
- Evaluate liquidity, leverage, break-even, DCF value and valuation sensitivities in one editable financial model.
BUDGETING & FORECASTING EXCEL DESCRIPTION
The 10-Year Integrated Three-Statement Financial Model is a reusable Excel planning tool for an operating business that needs revenue, profitability, cash flow, balance sheet, financing and valuation to move together. It is designed around three revenue streams – products, billable services and subscriptions – and connects those drivers to direct costs, staffing, operating expenses, working capital, capital expenditure, debt, tax and the full financial statements.
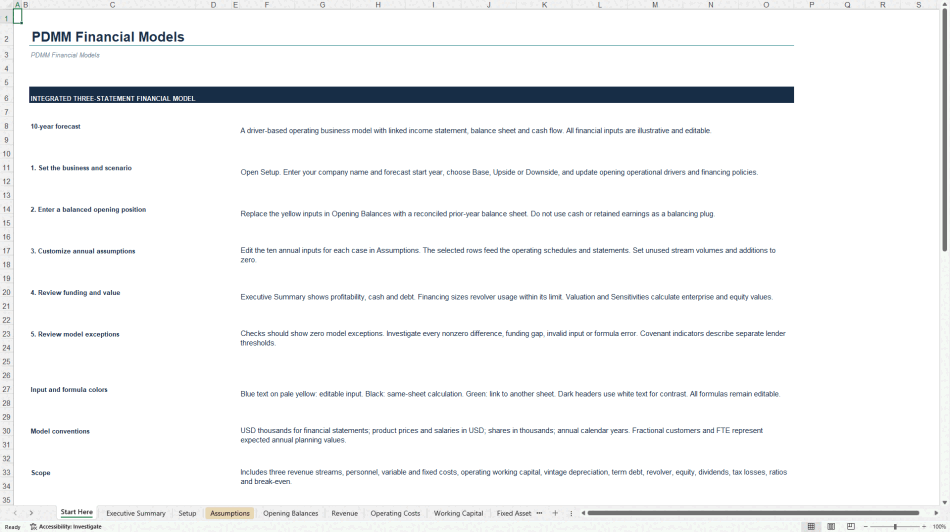
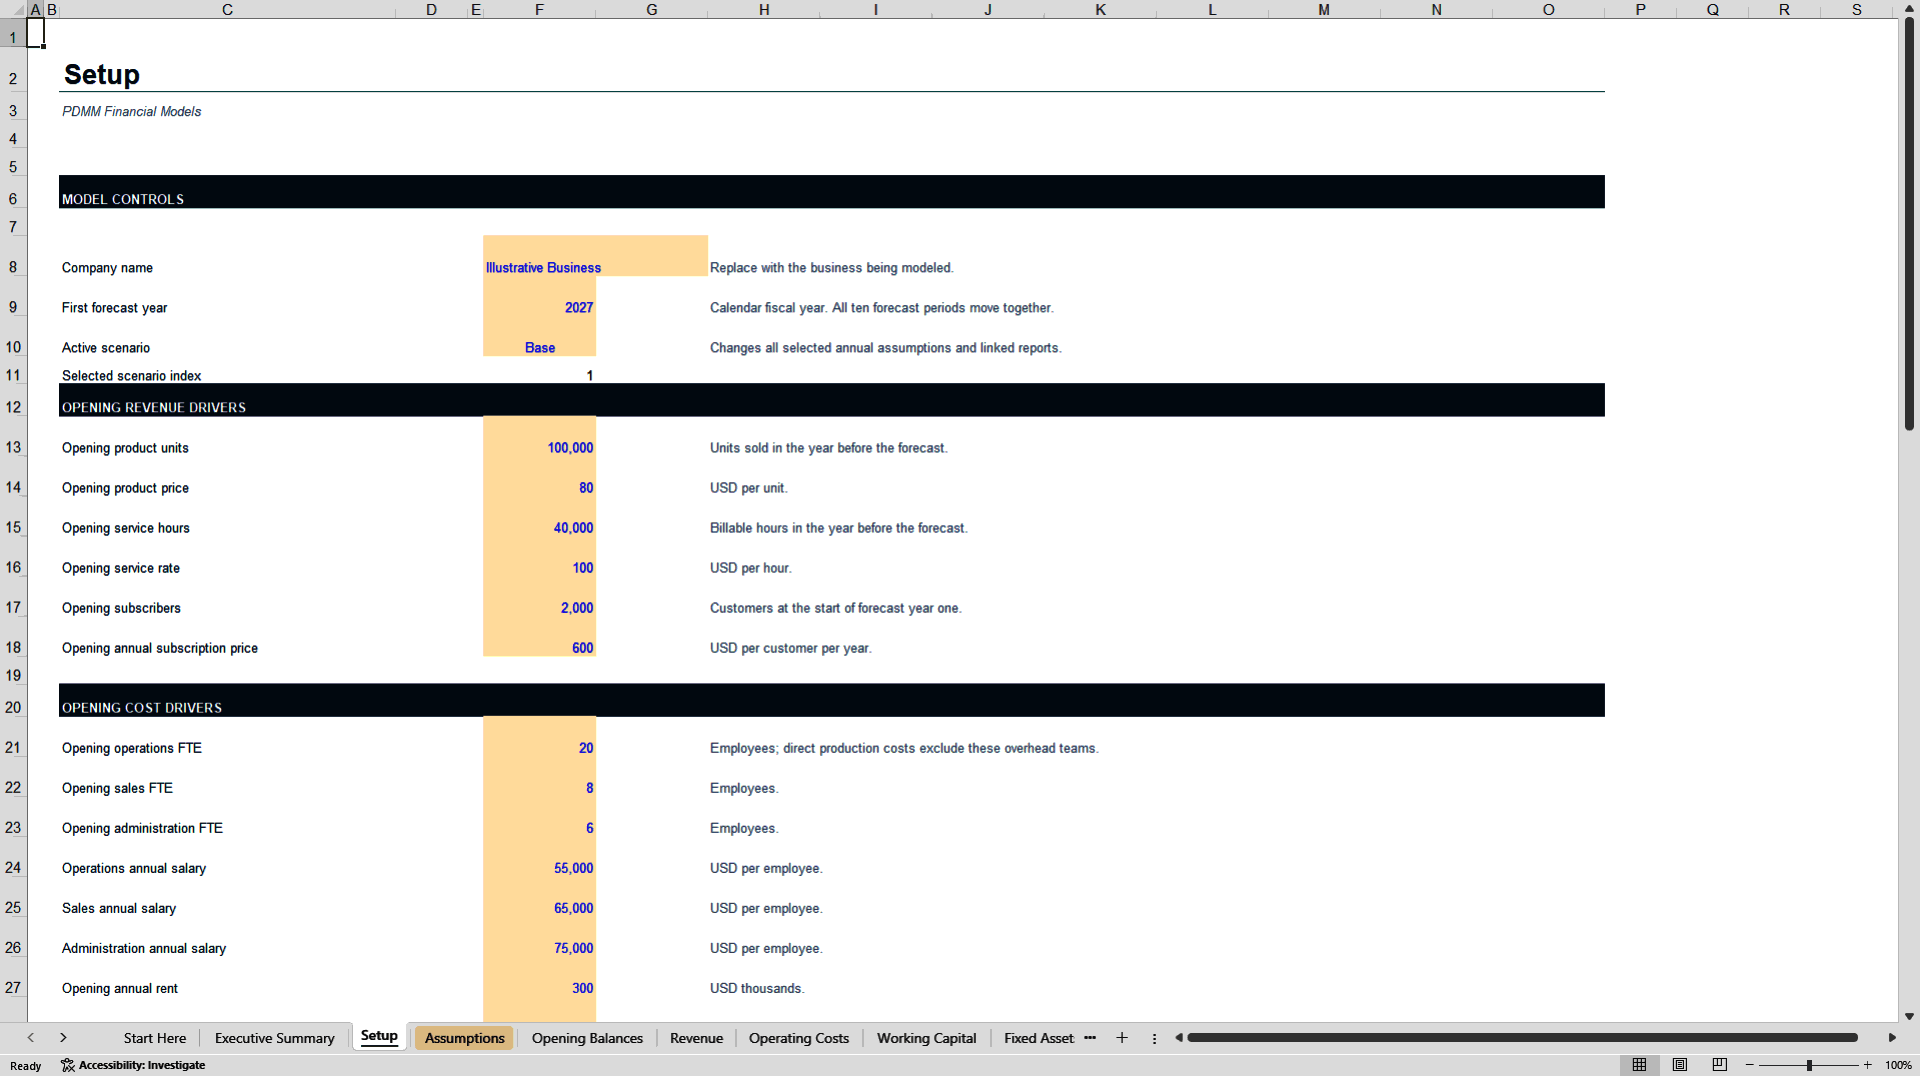
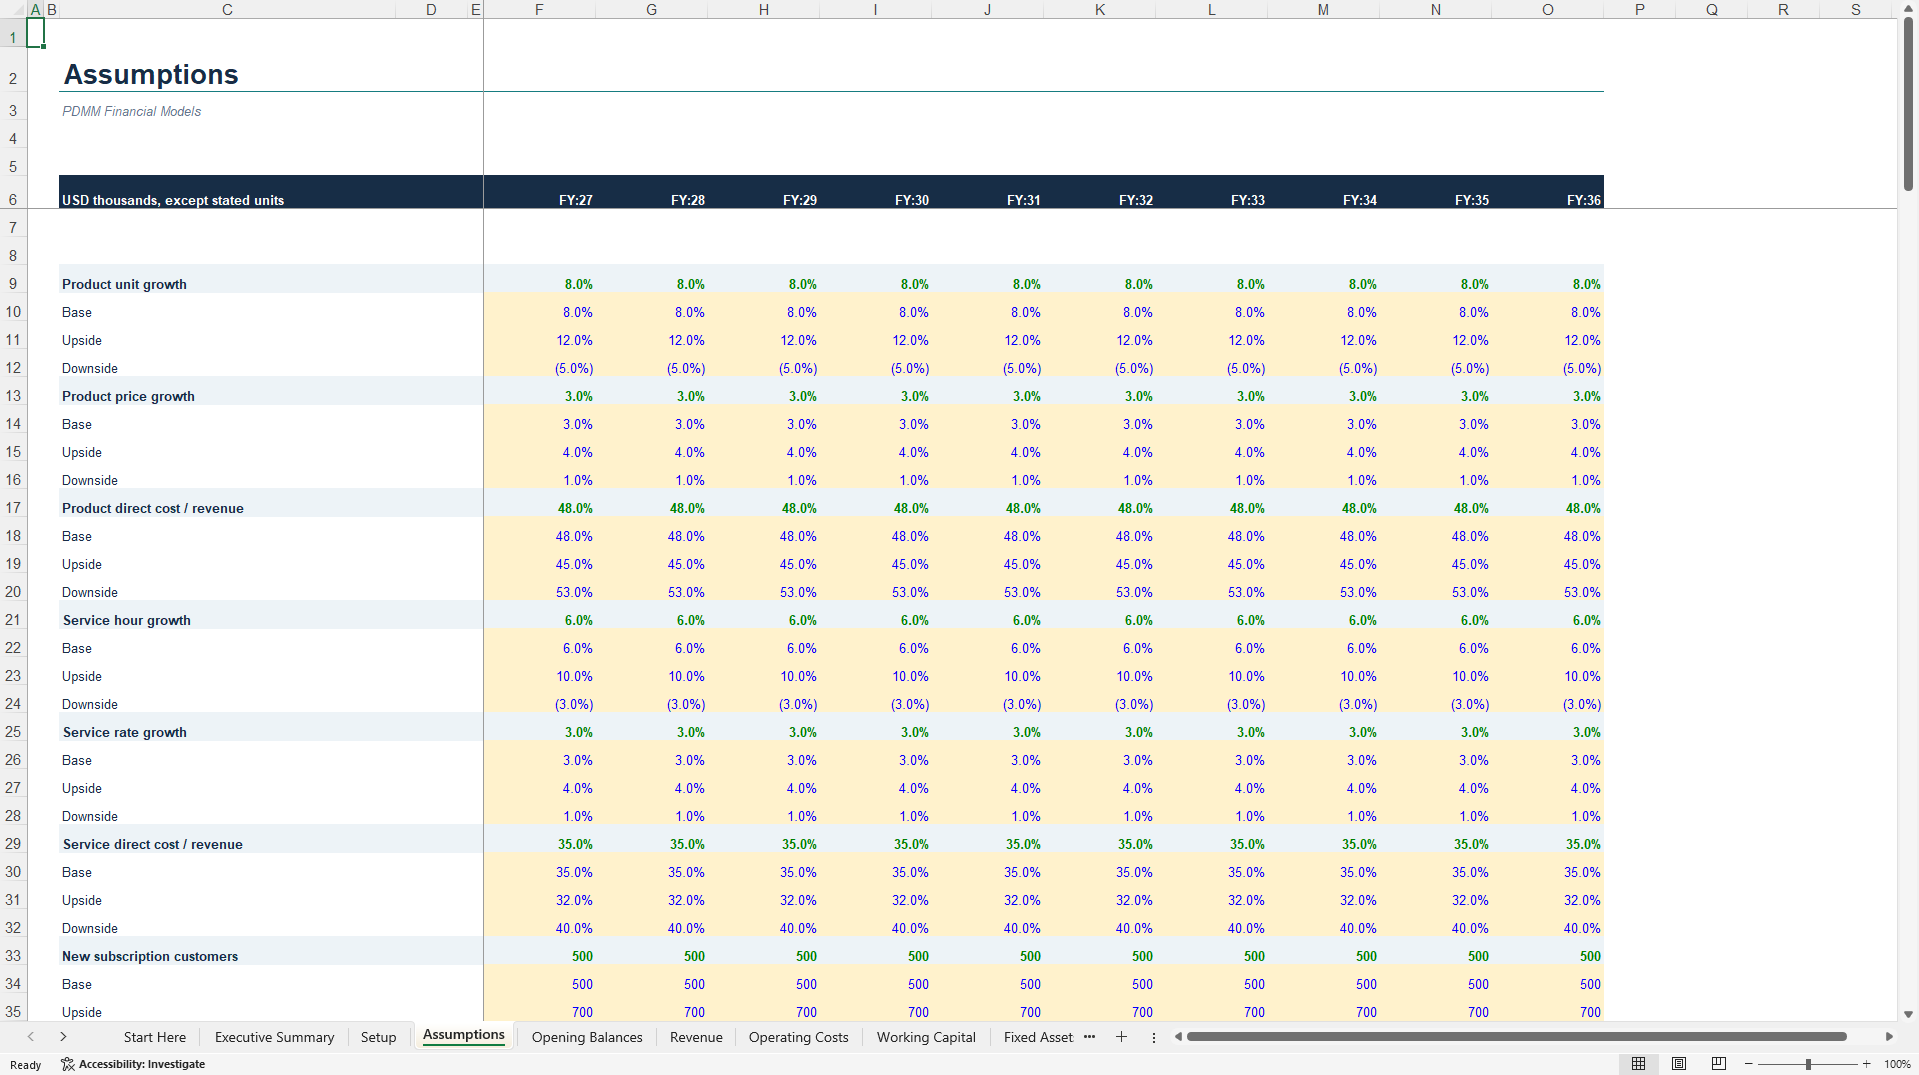
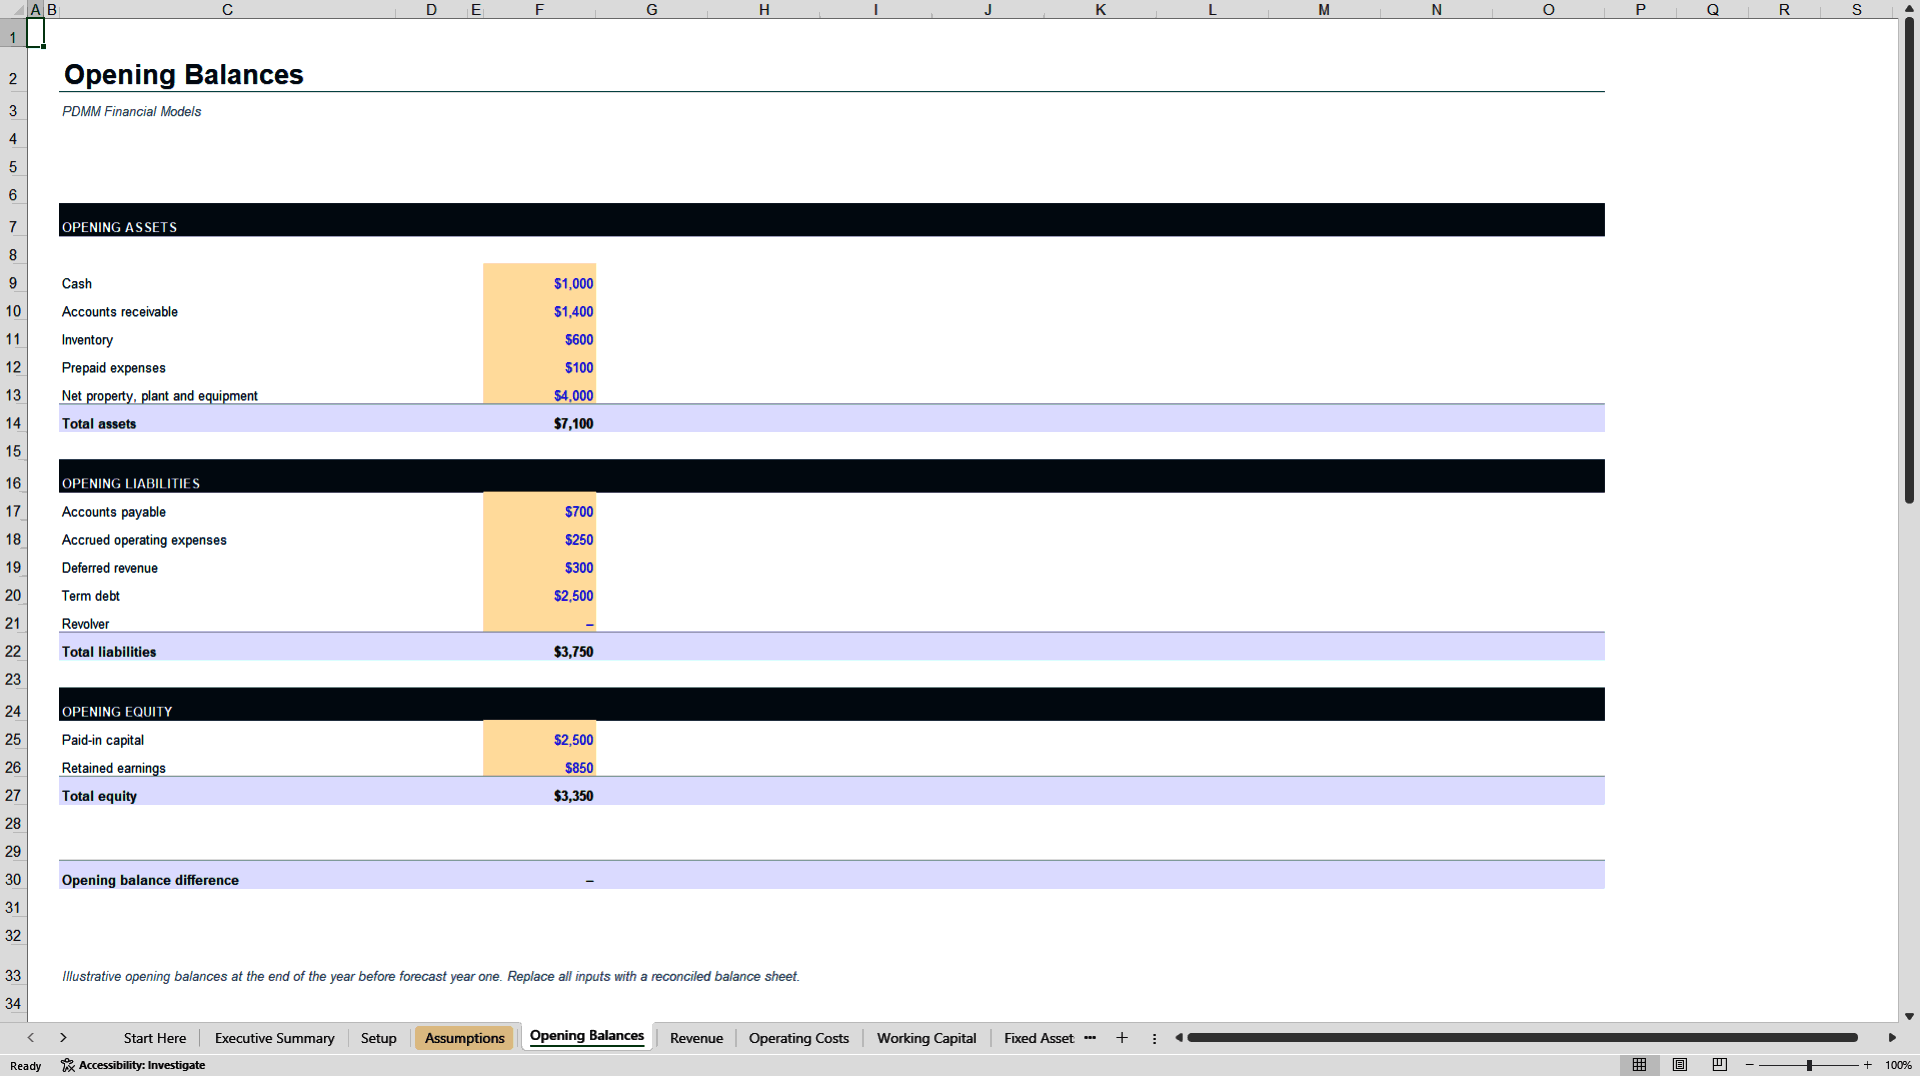
The model begins with a Setup sheet for the company name, first forecast year, active scenario, opening operating drivers and key financing and valuation policies. Opening Balances holds the starting balance sheet. The Assumptions sheet then provides ten annual forecast columns for three independent cases: Base, Upside and Downside. Buyers can change volume growth, pricing, direct-cost margins, new subscribers, churn, headcount growth, salary inflation, overhead, working-capital days, capex, debt terms, minimum cash, dividends, cash sweep, tax and other forecast drivers.
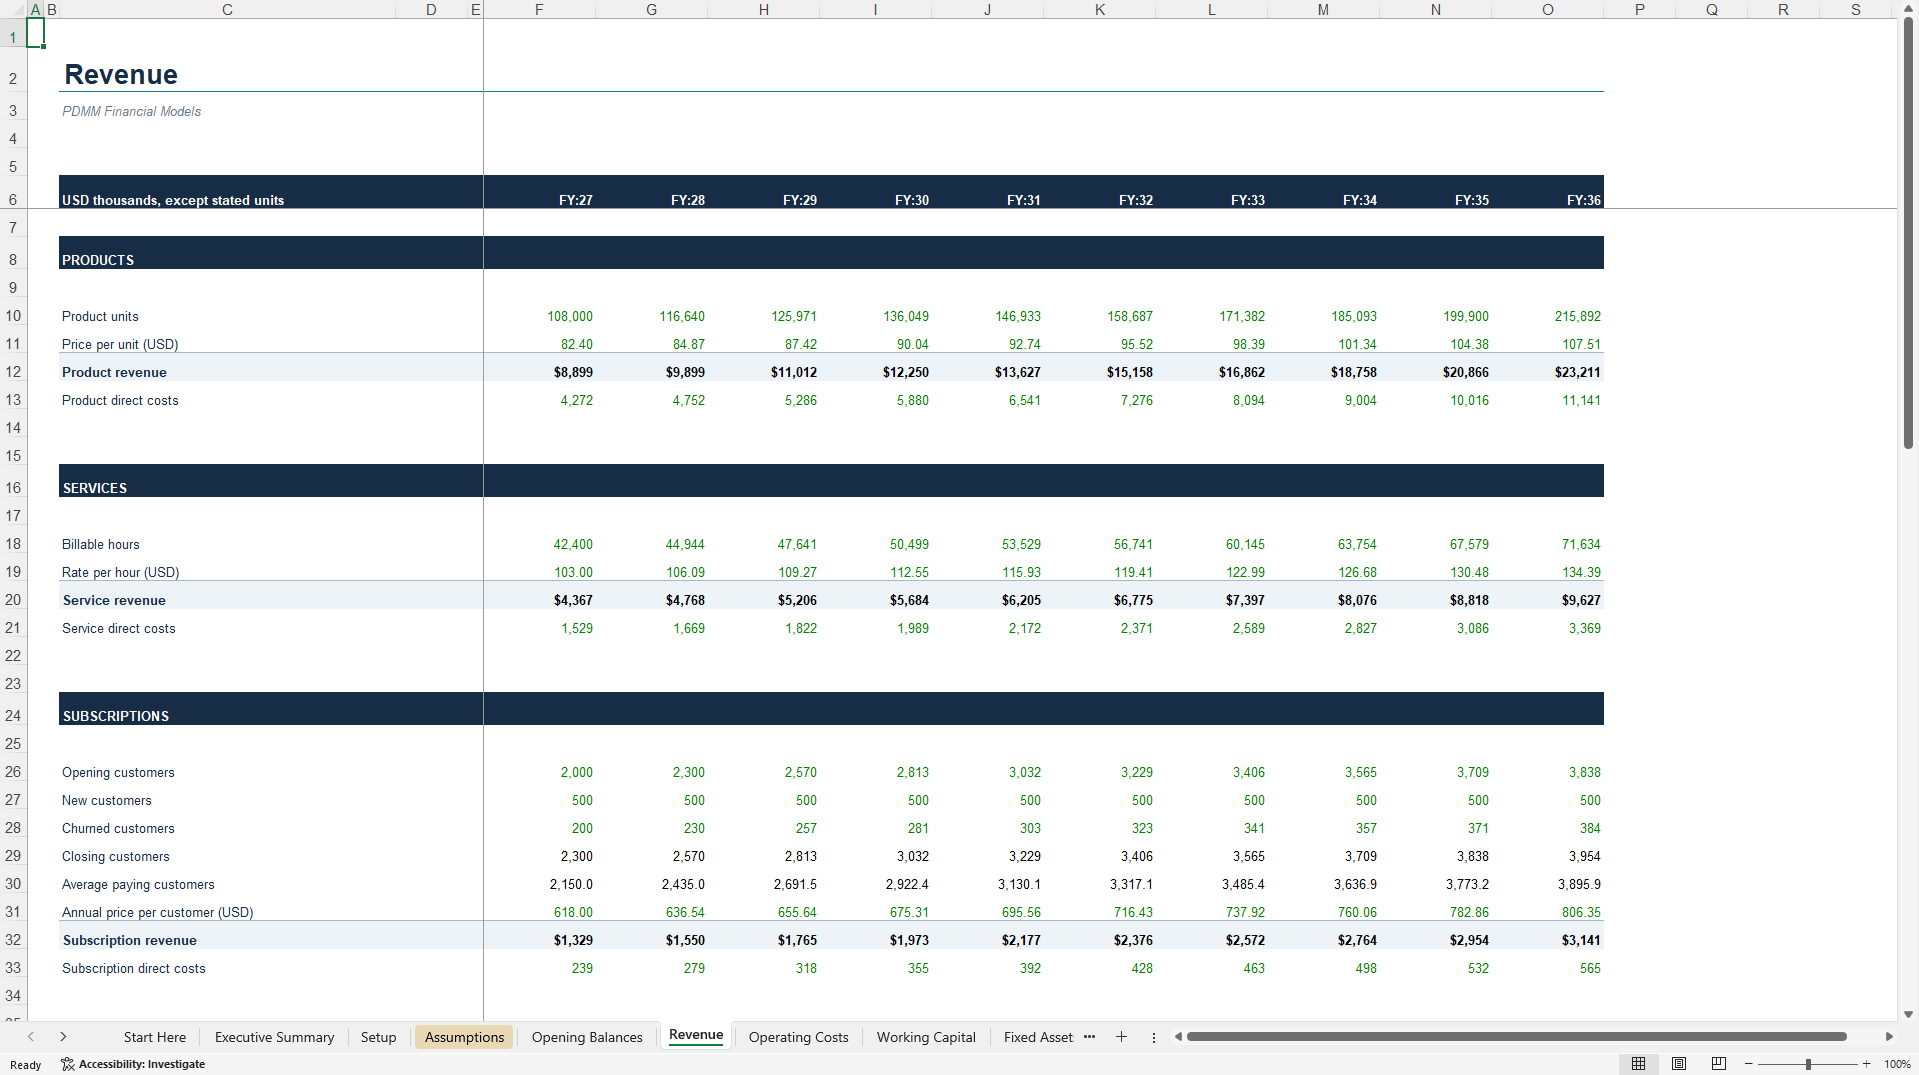
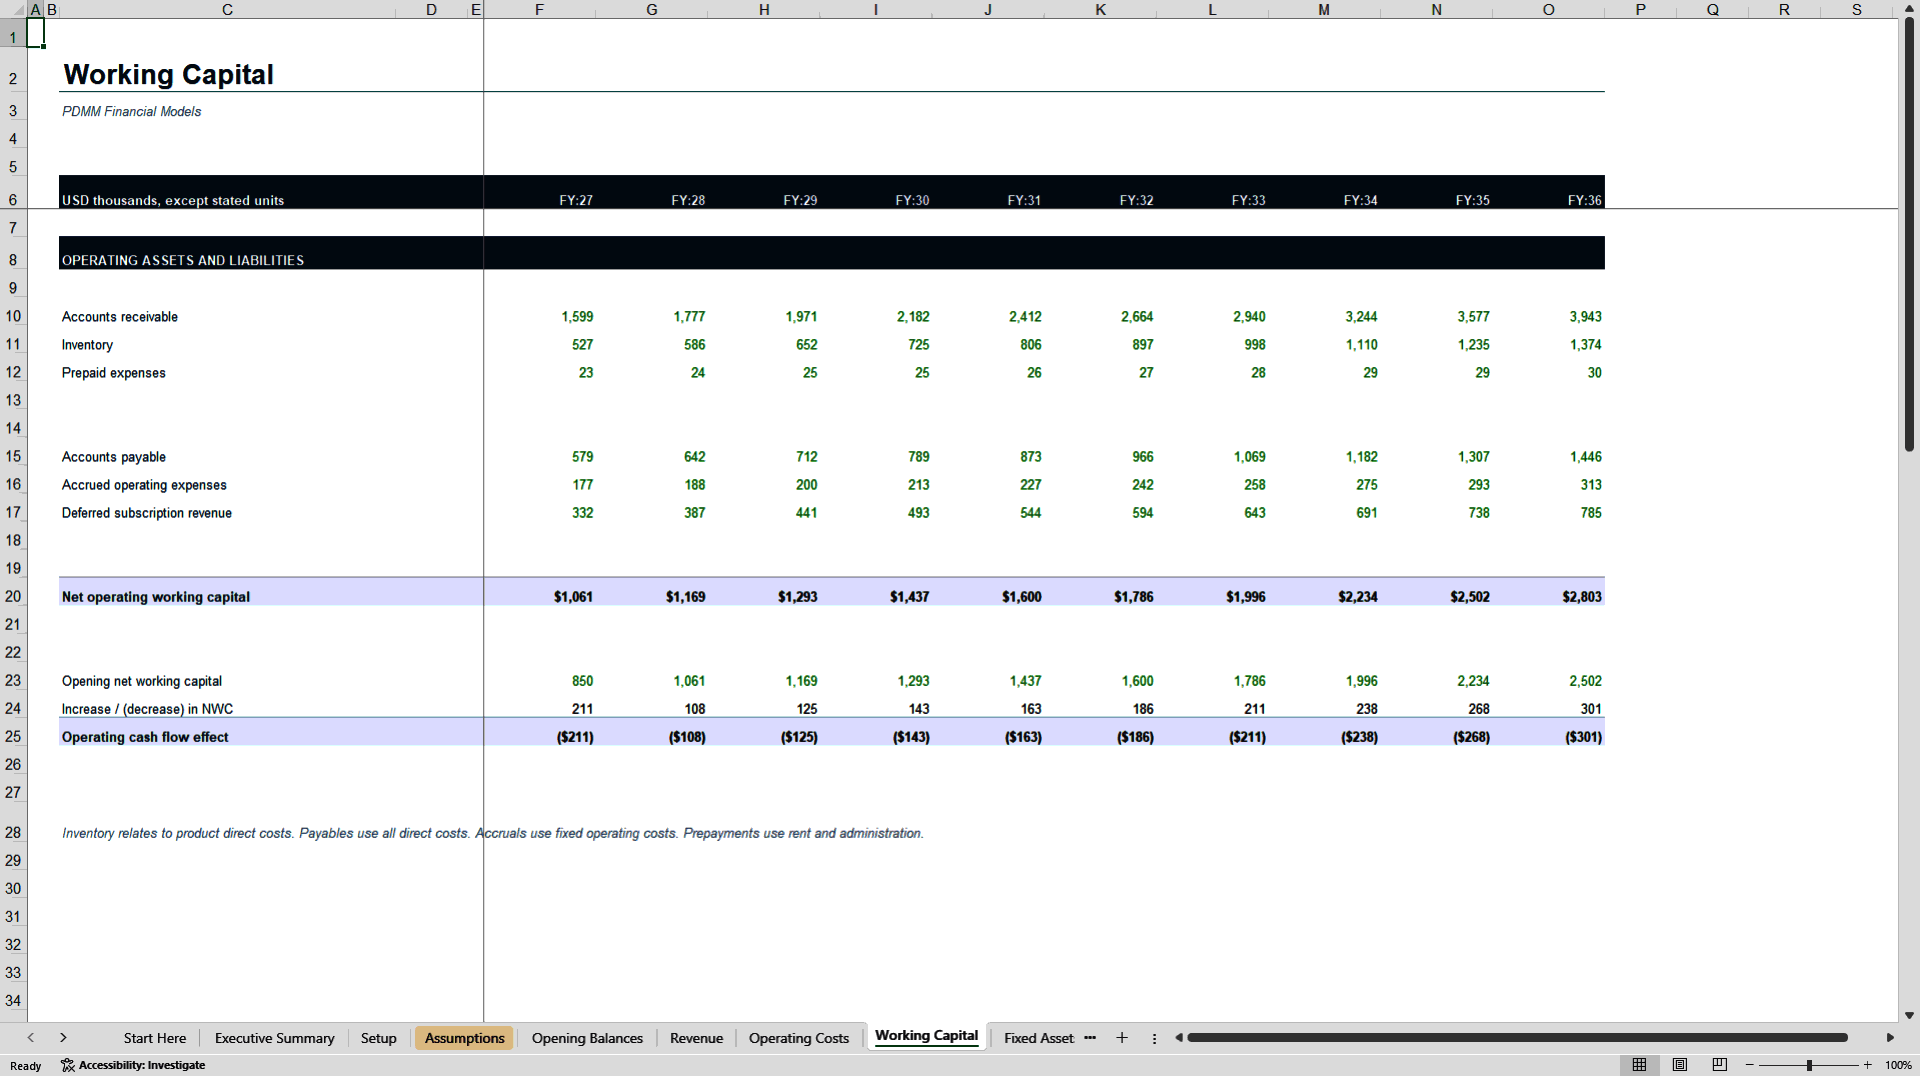
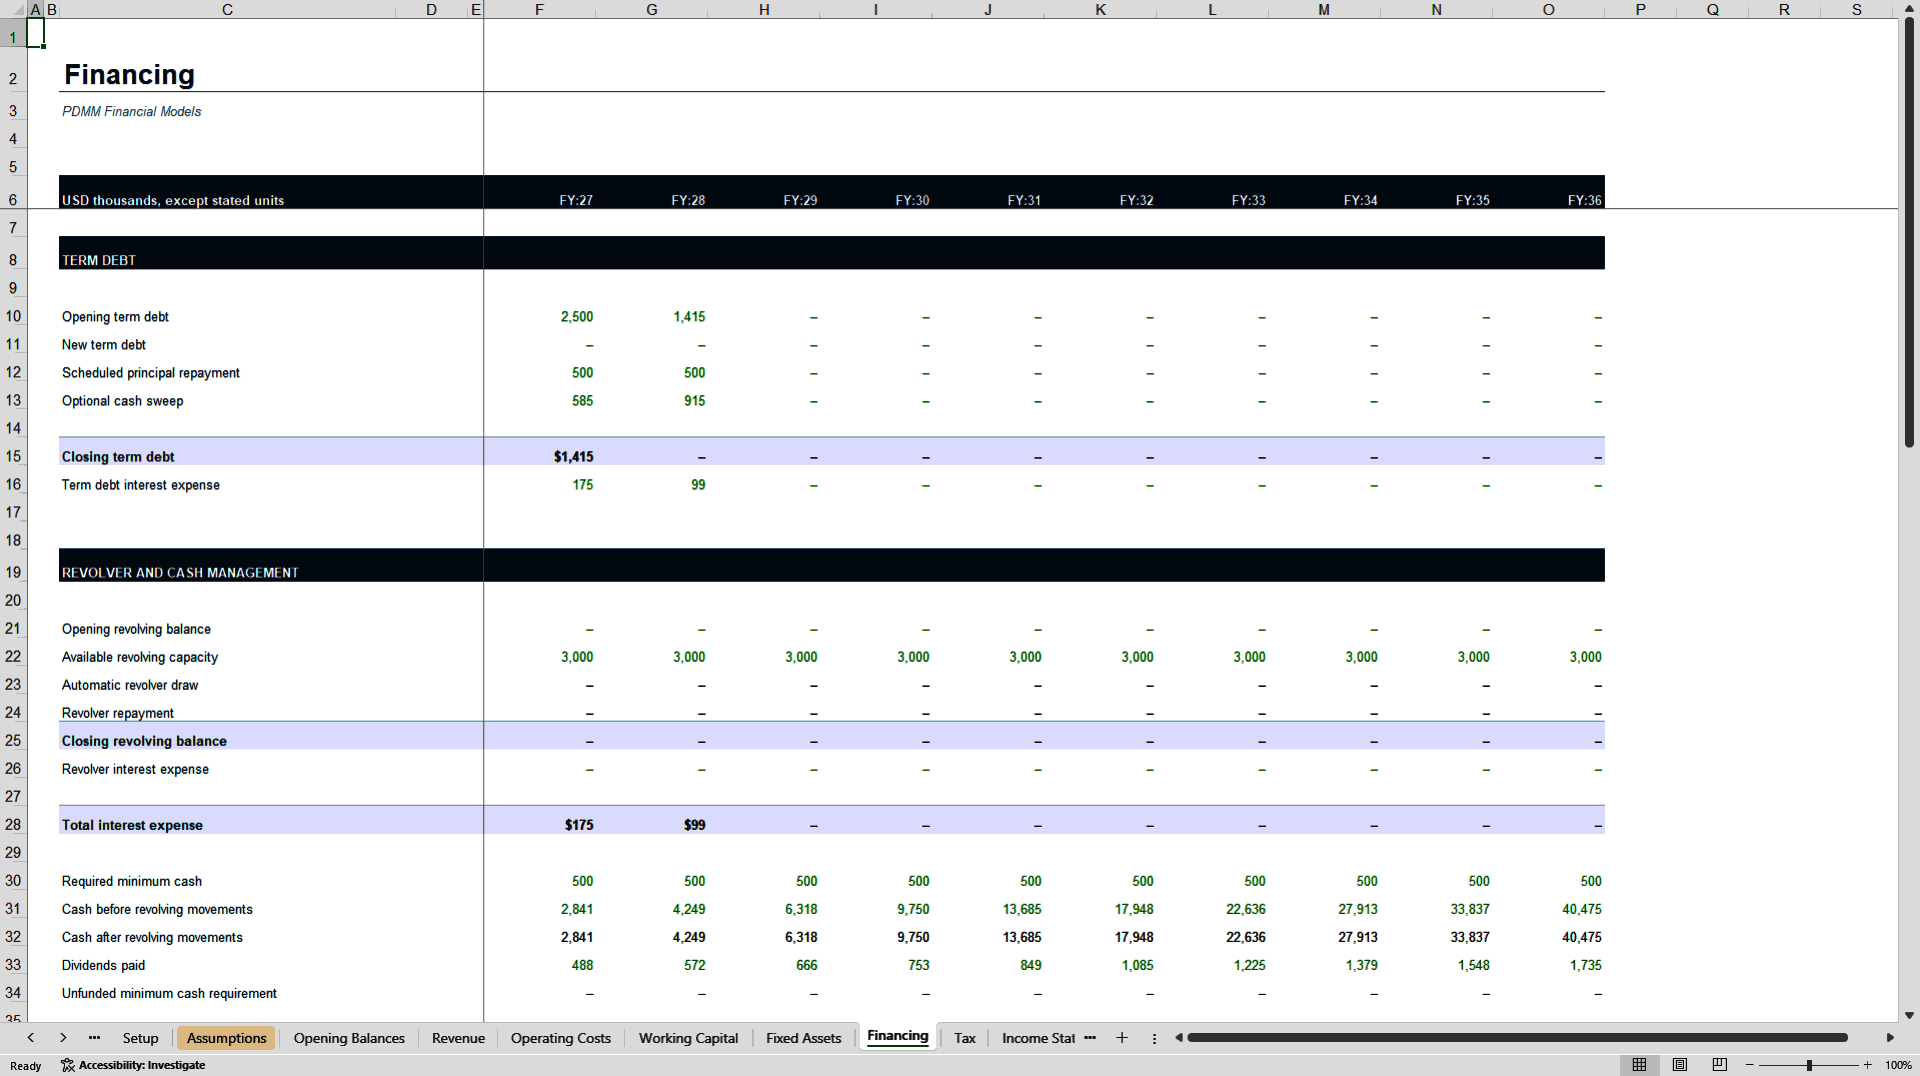
Operating schedules calculate product revenue, service revenue and subscription revenue; product and service direct costs; subscriber movements; FTE and payroll; marketing, rent, administration and other overhead; receivables, inventory, prepayments, payables, accruals and deferred revenue; capex and straight-line depreciation by vintage; term debt, revolver movements, interest, minimum cash, dividends and optional cash sweeps; and taxable profit with tax-loss carryforwards. These schedules feed a linked income statement, balance sheet and cash flow statement for ten years.
The Ratios sheet adds profitability, operating efficiency, liquidity, leverage, covenant indicators and break-even analysis. The Valuation sheet calculates unlevered free cash flow, a Gordon-growth DCF, enterprise value, equity value and value per share, with an exit-EBITDA-multiple cross-check. Sensitivities show equity value across WACC and terminal-growth combinations and across WACC and exit-multiple combinations. Scenario Comparison presents Base, Upside and Downside revenue and EBITDA cases side by side, while the active scenario controls the linked statements and valuation outputs.
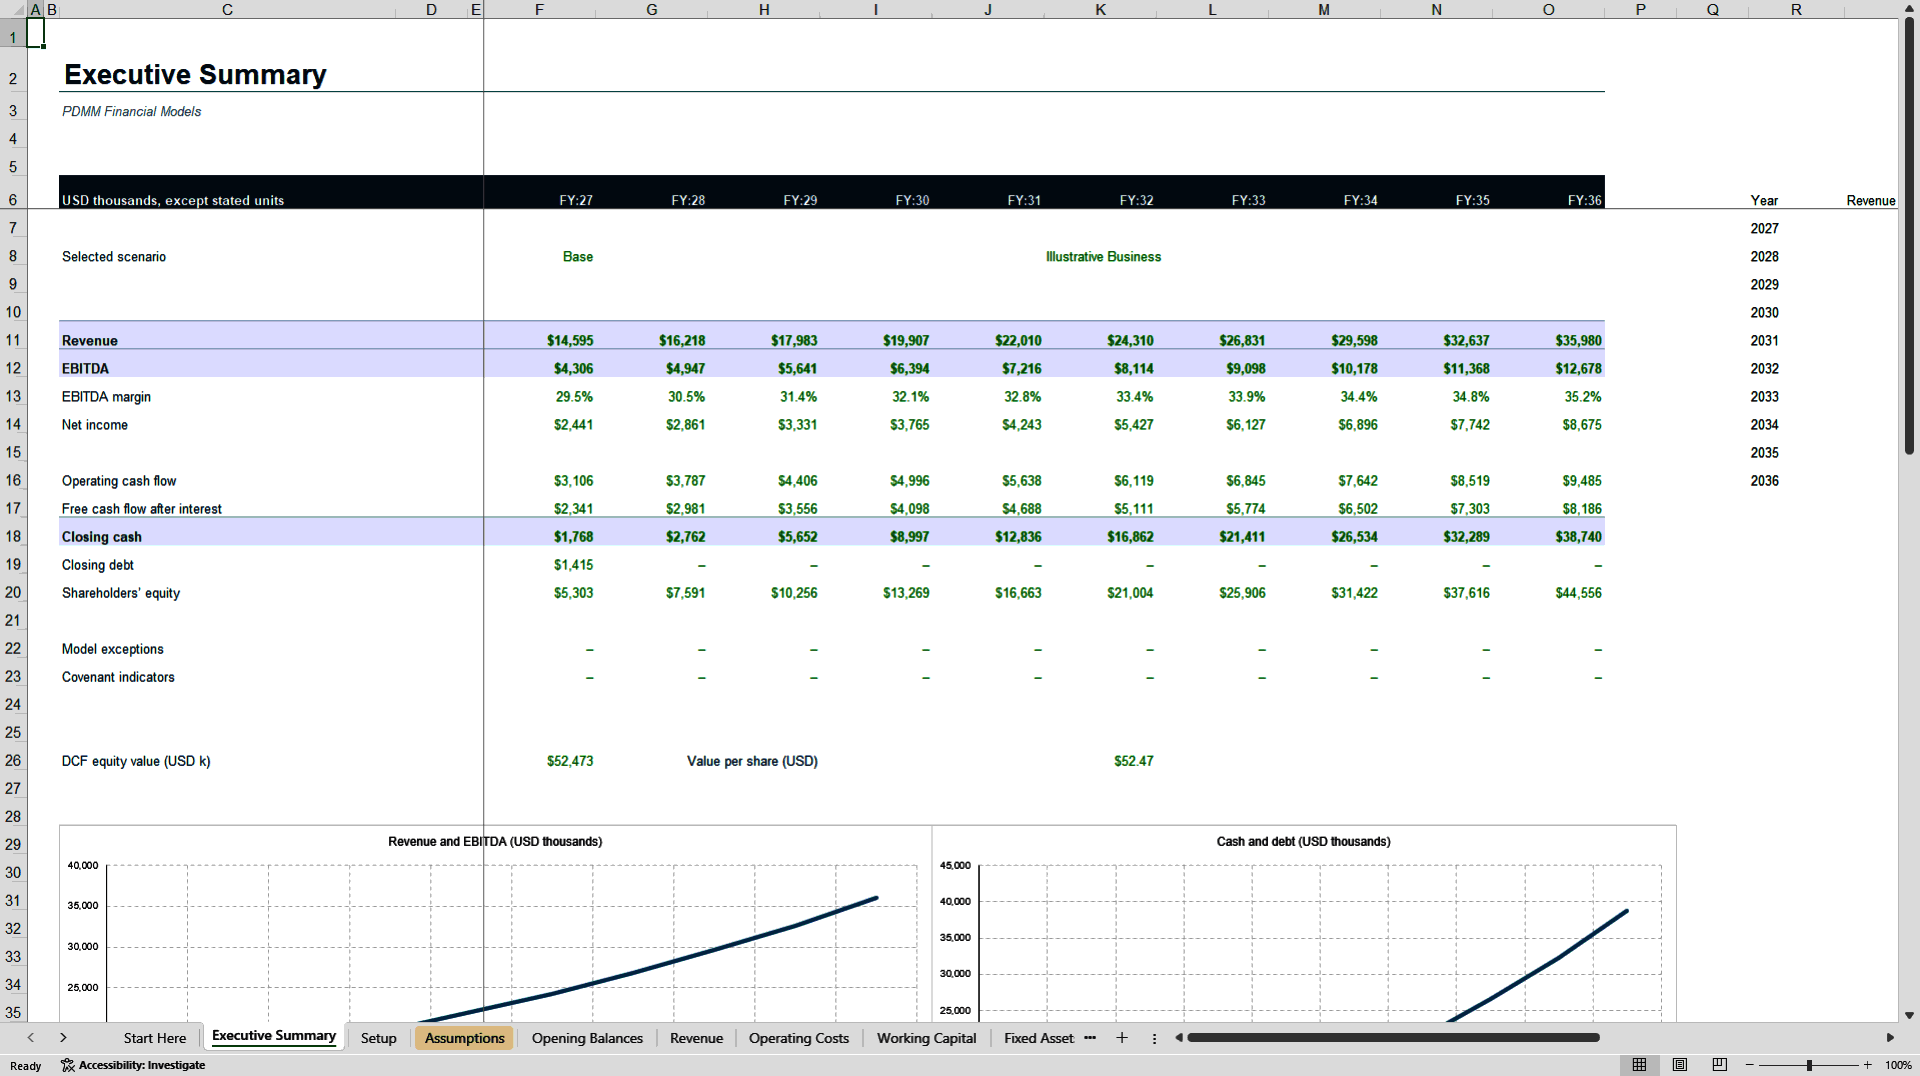
An Executive Summary consolidates major KPIs including revenue, EBITDA, margins, net income, operating cash flow, free cash flow after interest, cash, debt, equity and valuation, supported by four charts. The Checks sheet contains reconciliation lines, funding and input exception flags, and lender covenant indicators so users can identify issues surfaced by the model itself.
This workbook can support business planning, budgeting, forecasting, profitability analysis, pricing and volume decisions, liquidity planning, financing analysis, working-capital management, scenario analysis, sensitivity analysis and DCF valuation. It is delivered as an editable .xlsx workbook together with a full-sheet PDF preview.
Seller-supplied and already tested; no Studio workbook audit was performed.
Got a question about the product? Email us at support@flevy.com or ask the author directly by using the "Ask the Author a Question" form. If you cannot view the preview above this document description, go here to view the large preview instead.
Source: Best Practices in Budgeting & Forecasting, Integrated Financial Model Excel: 10-Year Integrated Three-Statement Financial Model Excel (XLSX) Spreadsheet, PDMM Financial Models
ABOUT THE AUTHOR

PDMM Financial Models develops professional, decision-ready Excel models for business owners, entrepreneurs, investors, consultants, analysts, and finance teams. Our objective is to transform complex business assumptions into clear, structured analysis that supports better planning and investment decisions.
Our models cover business planning, forecasting, budgeting, feasibility analysis,
... [read more]
Ask the Author a Question
You must be logged in to contact the author.




























