
 Click main image to view in full screen. Unlock all 16 preview images:
Working Capital Management & 13-Week Cash Flow Toolkit – PowerPoint PPTX Template
PowerPoint (PPTX) + Excel (XLSX) 69 Slides


BENEFITS OF THIS DOWNLOADABLE POWERPOINT DOCUMENT
- Sizes the cash release from receivables, inventory and payables in days and dollars.
- Shows step by step how to build and run a direct-method 13-week cash flow forecast with scenarios and an action plan.
- Includes a fully worked case, five editable templates and a companion Excel workbook with built-in checks.
CASH FLOW MANAGEMENT PPT TEMPLATE DESCRIPTION
Profitable companies still run short of cash when receivables, inventory and payables are not managed together. This toolkit explains how to measure the cash conversion cycle, size the cash release lever by lever, and protect liquidity week by week with a 13-week cash flow forecast.
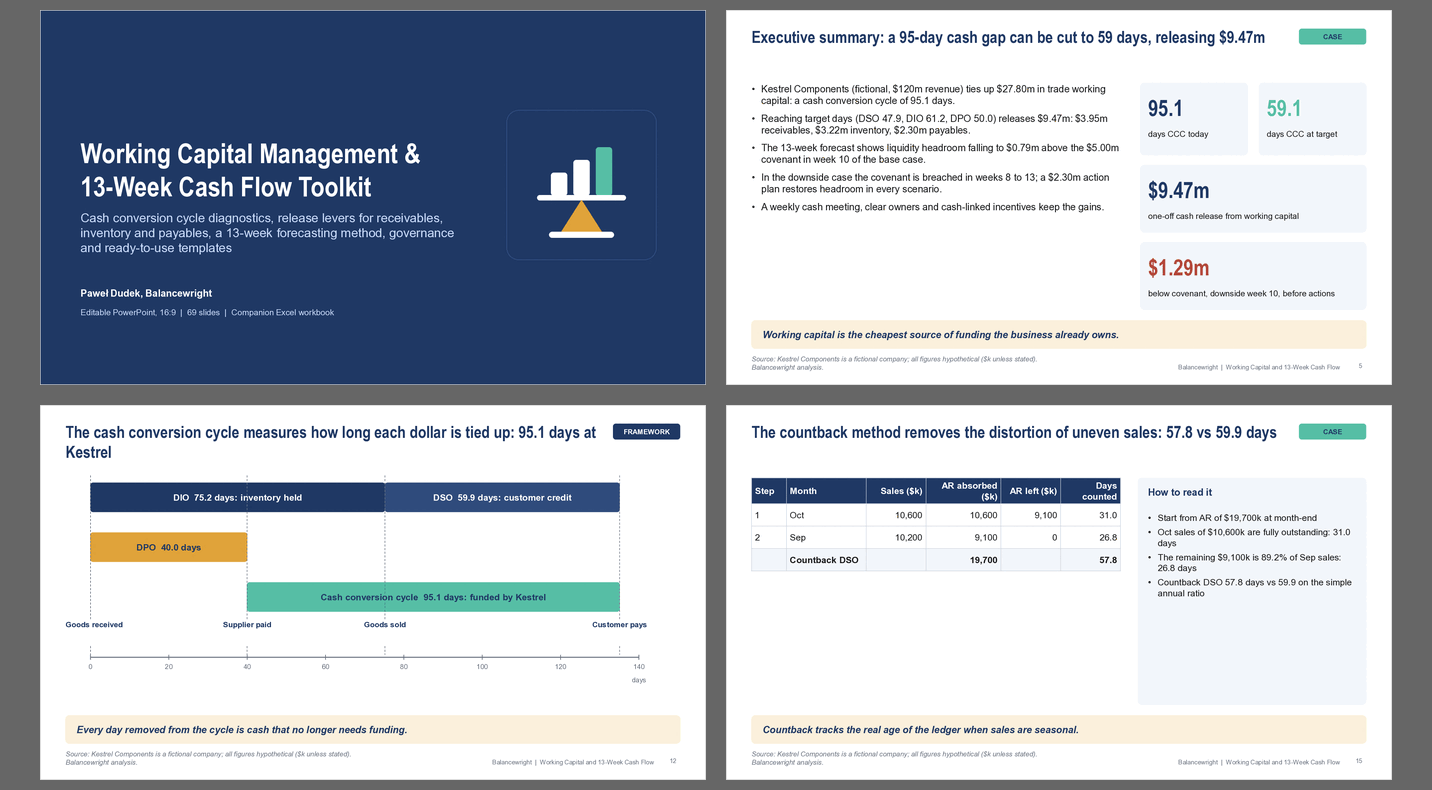
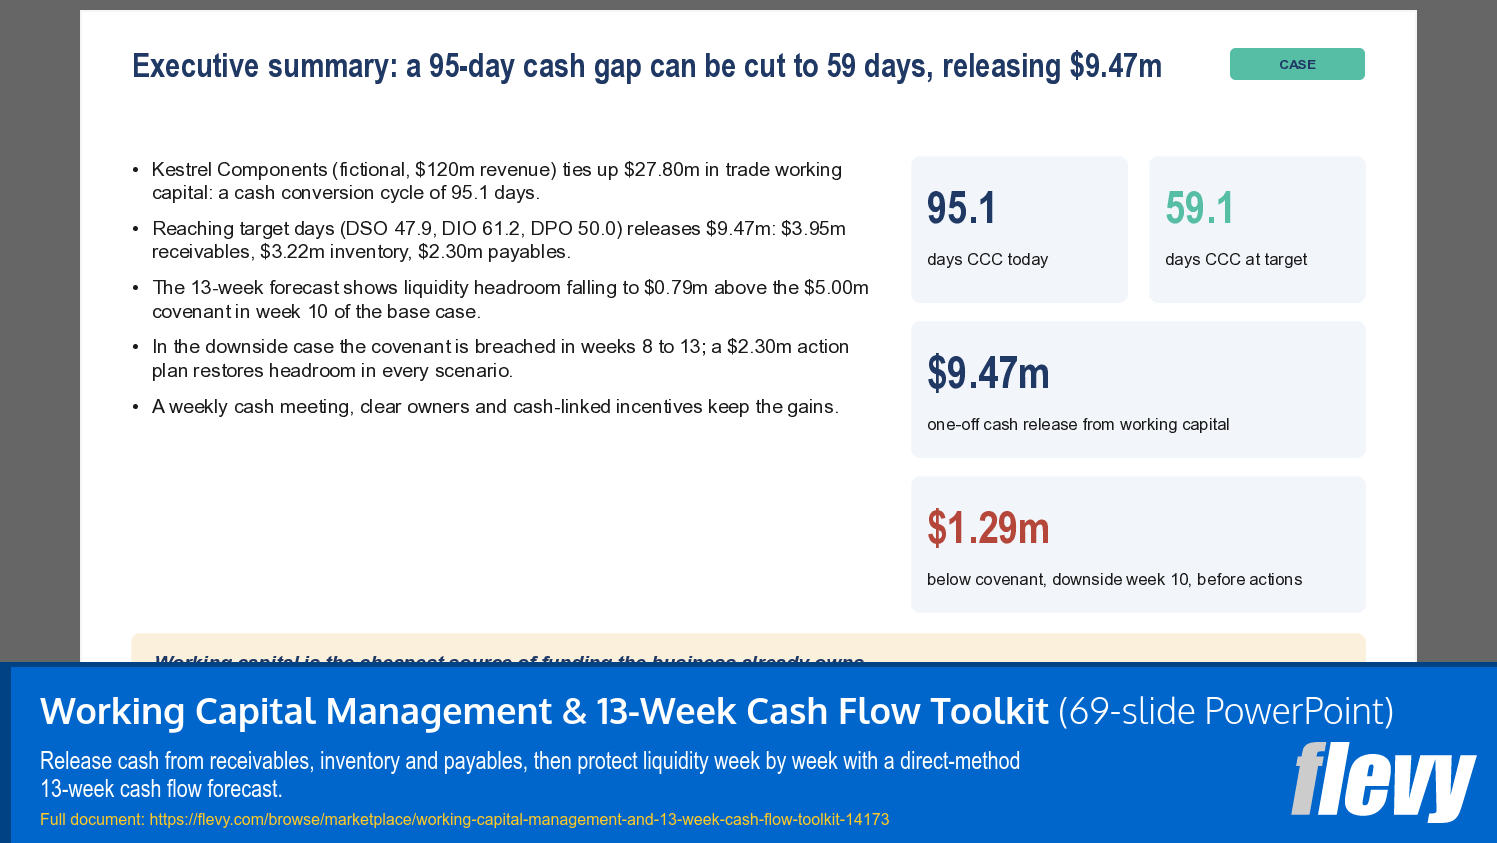
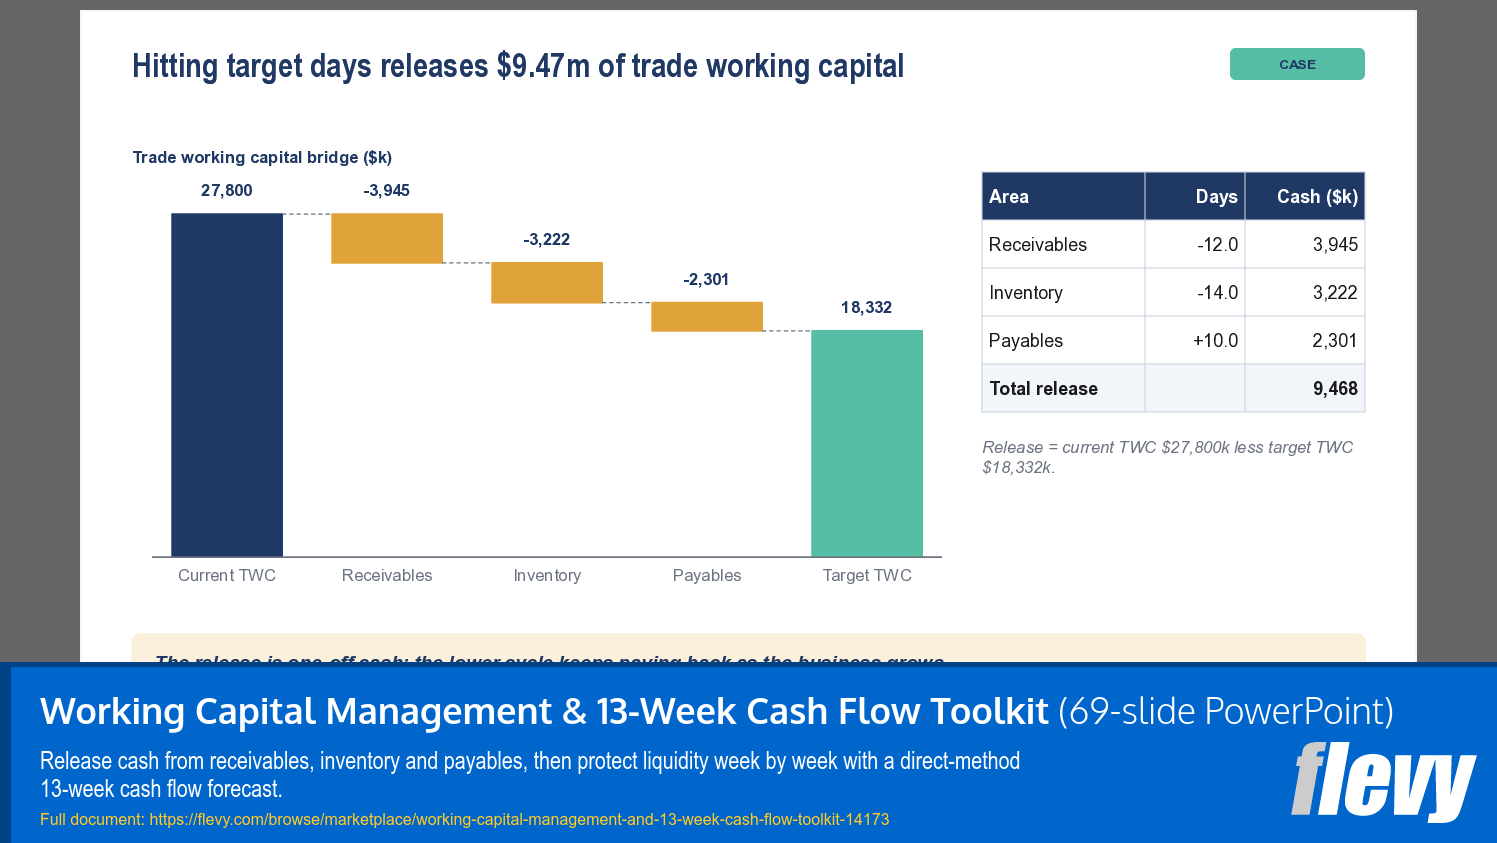
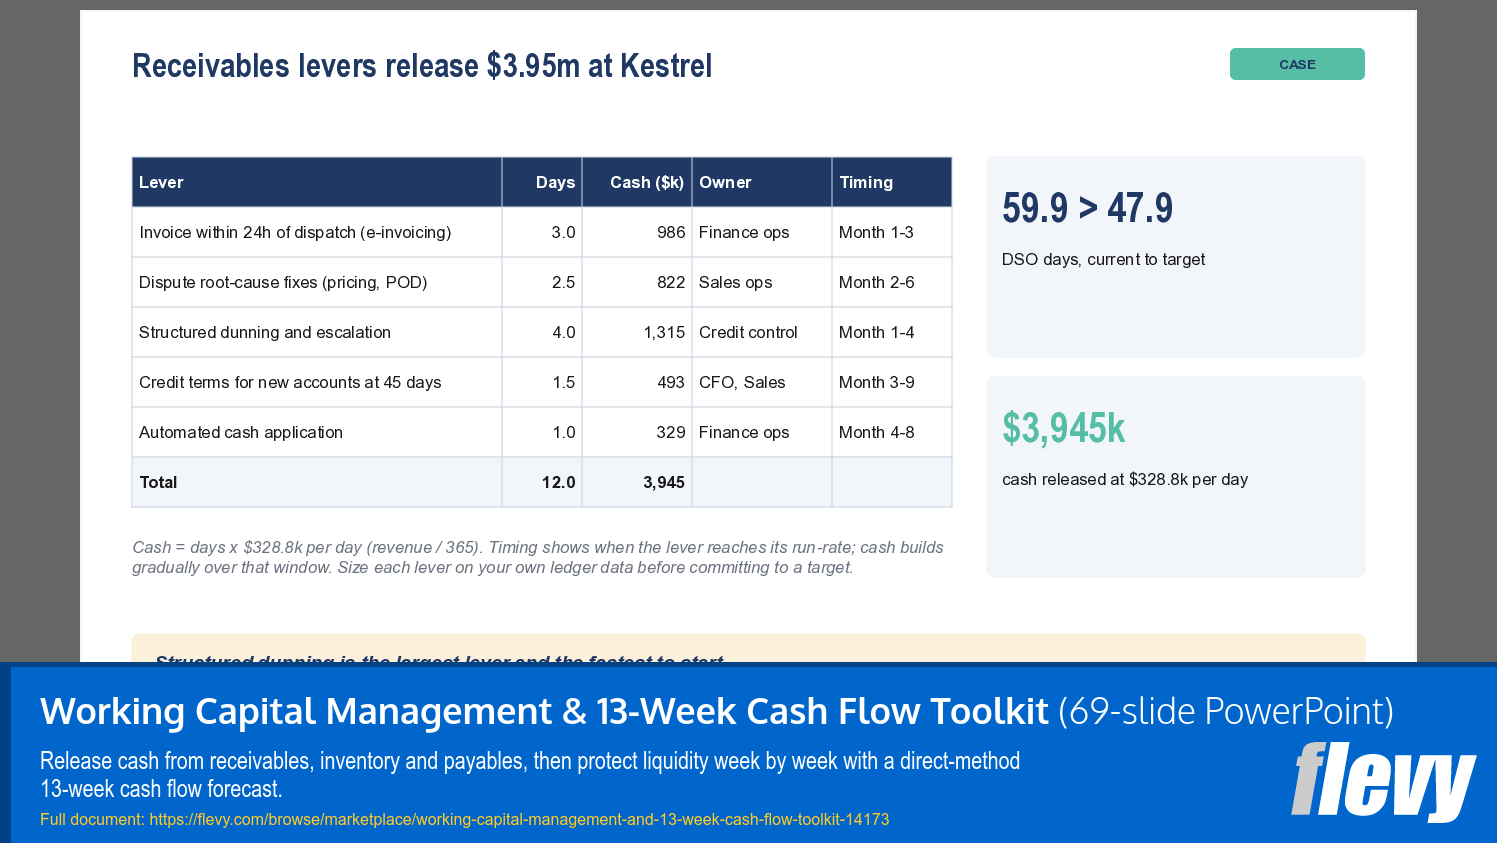
It is an instructional deck of 69 slides. The framework slides teach the method, the case slides apply it end to end to a fictional 120 million dollar industrial distributor, and the template slides give you blank versions to fill in with your own data. Every number in the case ties out. The cash conversion cycle falls from 95.1 to 59.1 days and releases 9.47 million dollars of trade working capital (3.95 million from receivables, 3.22 million from inventory and 2.30 million from payables). The 13-week forecast then shows liquidity headroom shrinking to 0.79 million in week 10 of the base case, a covenant breach from week 8 in the downside case, and a 2.30 million action plan that restores headroom in every scenario.
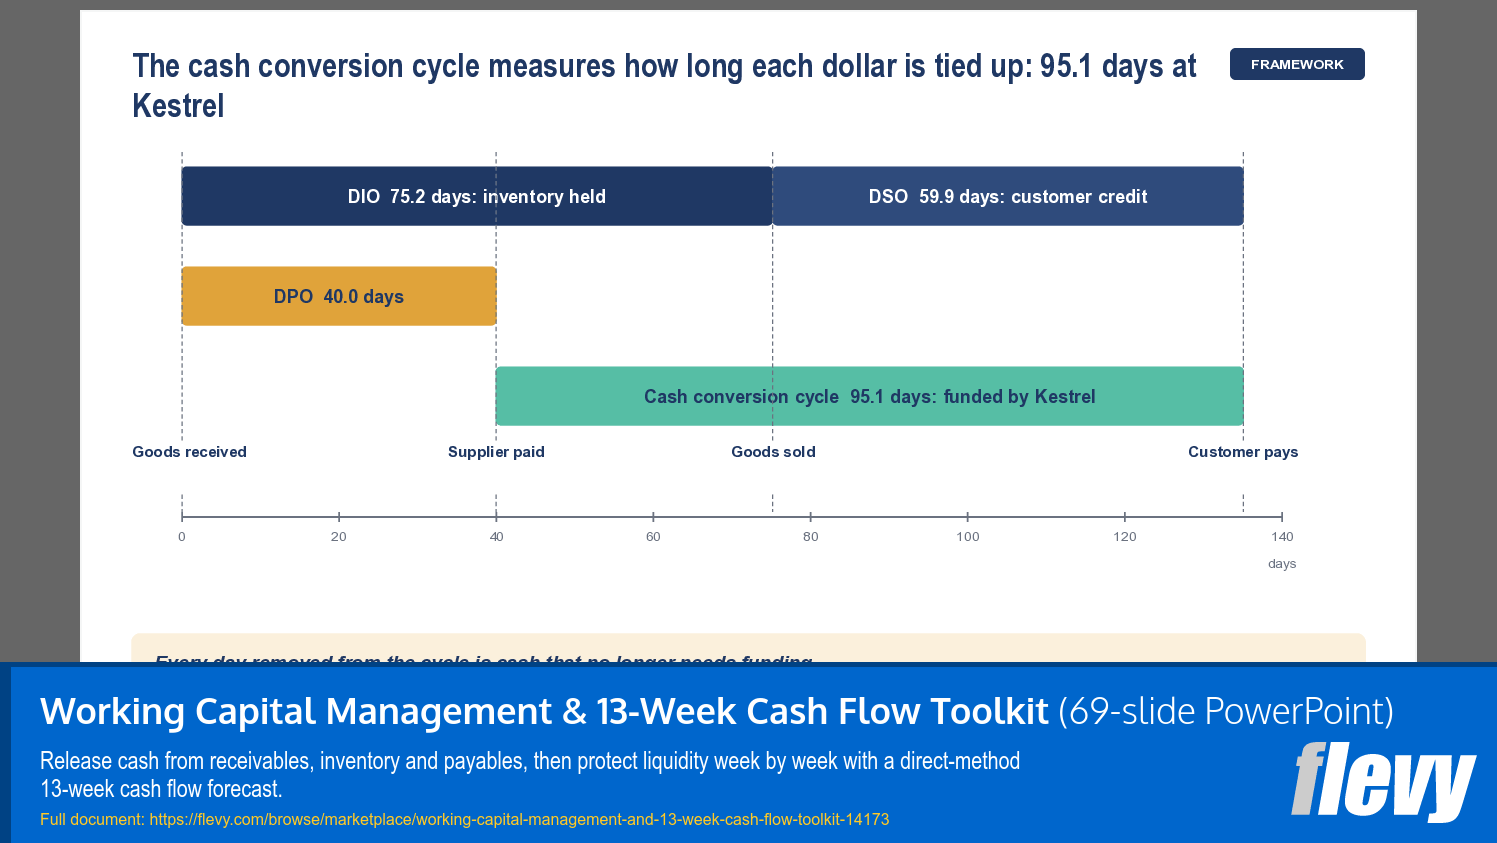
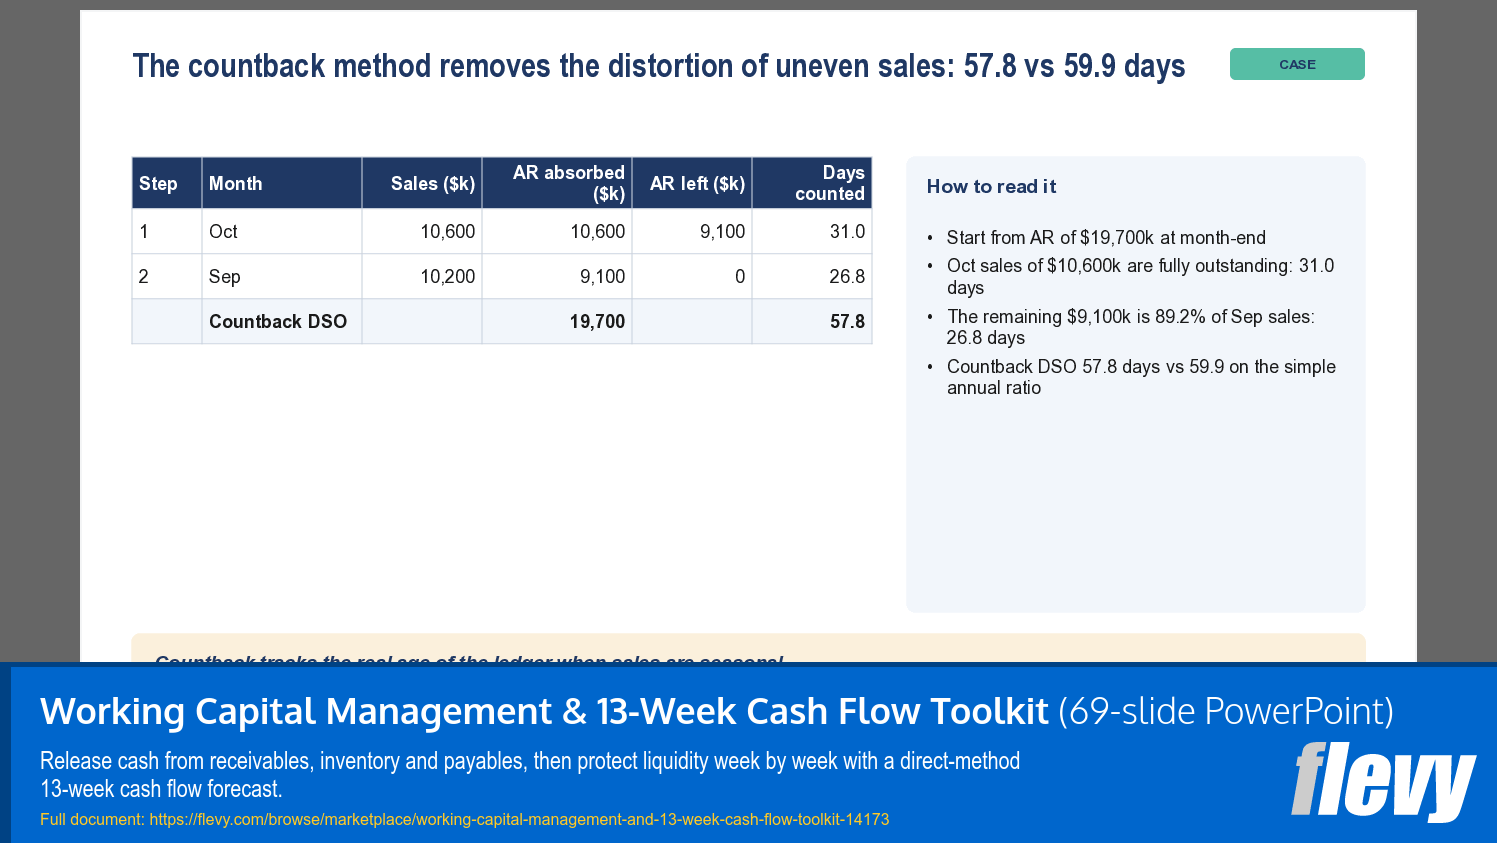
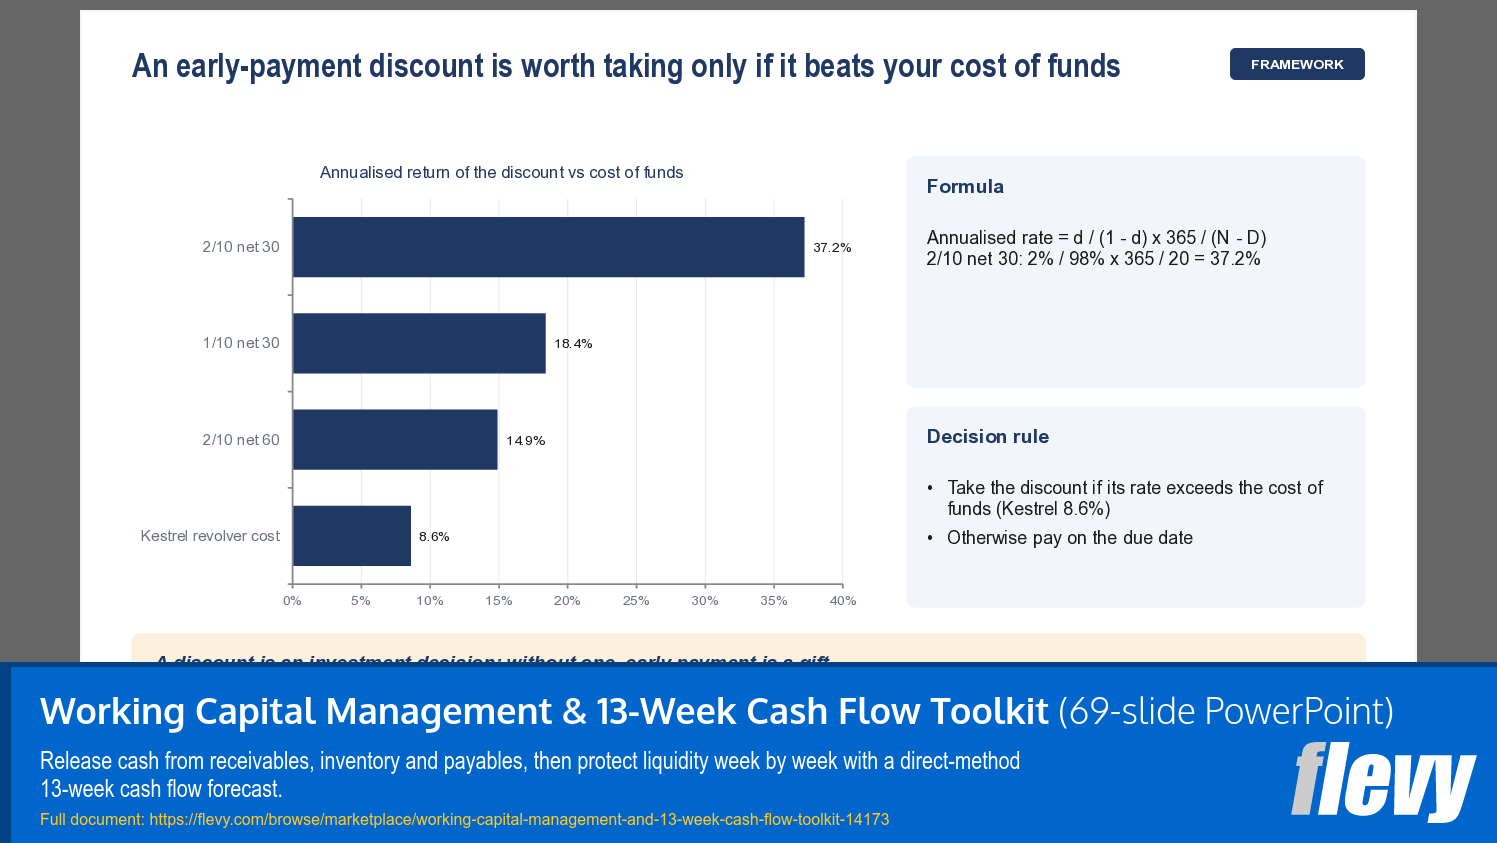
The deck covers DSO, DIO, DPO and the cash conversion cycle, measurement choices and the countback method, the cash value of one day, levers for receivables, inventory and payables, early-payment discount maths and fair-payment guardrails. It then walks through the design of a direct-method 13-week forecast with collection curves, disbursement timing rules, scenarios, a cash action plan and forecast-versus-actual tracking, followed by governance (weekly cash cadence, RACI, cash-linked incentives), a one-page KPI dashboard, a 12-month implementation roadmap and five editable templates.
Sections: 1. Introduction and executive summary. 2. Why working capital decides liquidity. 3. Measuring the cash conversion cycle. 4. Case diagnostic. 5. Receivables levers. 6. Inventory levers. 7. Payables levers. 8. The 13-week cash flow forecast. 9. Governance, KPIs and incentives. 10. Implementation roadmap. 11. Templates. 12. Key takeaways.
The companion Excel workbook builds the same forecast from inputs. It has collection and payment timing grids, revolver draw and repay logic, a liquidity covenant test, three scenarios switched from one cell, an action plan toggle, a working capital diagnostic with lever sizing, a forecast-versus-actual tracker and a Checks tab with 20 tests. It uses formulas only, with no macros, passwords or external links, and it was recalculated with zero errors and re-computed independently for all three scenarios.
Design: 16:9, Arial and Arial Narrow, a navy, amber and teal theme. All charts are native PowerPoint charts with editable data, all diagrams are editable shapes, and every slide has speaker notes.
Honest limitations: the case company and its figures are hypothetical and are not benchmarks. Lever sizes are illustrative. The forecast uses weekly timing curves rather than individual invoices, and the revolver logic does not model borrowing-base limits, fees or FX. Regulatory references are pointers, not legal or accounting advice. This is educational material, not financial, legal or tax advice.
AI note: the content was drafted with the help of Claude, an AI assistant, and reviewed by the author. All numbers in the worked case were checked with an independent recalculation. No generative AI images are used.
Got a question about the product? Email us at support@flevy.com or ask the author directly by using the "Ask the Author a Question" form. If you cannot view the preview above this document description, go here to view the large preview instead.
Source: Best Practices in Cash Flow Management, Working Capital Management PowerPoint Slides: Working Capital Management & 13-Week Cash Flow Toolkit PowerPoint (PPTX) Presentation Slide Deck, Paweł Dudek, Balancewright
ABOUT THE AUTHOR

Balancewright is Paweł Dudek. The catalogue covers project finance, fund and waterfall structures, corporate three-statement forecasting, working capital, valuation and FP&A -- built as working models rather than formatted templates.
Every model is formula-driven end to end. No locked cells, no passwords, no macros and no external links, so any calculation can be inspected, adapted and
... [read more]
Ask the Author a Question
You must be logged in to contact the author.