 Click main image to view in full screen. Unlock all 13 preview images:
13-Week Cash Flow & Liquidity Control Toolkit – PowerPoint PPTX Template
PowerPoint (PPTX) + Zip archive file (ZIP) 12 Slides


BENEFITS OF THIS DOWNLOADABLE POWERPOINT DOCUMENT
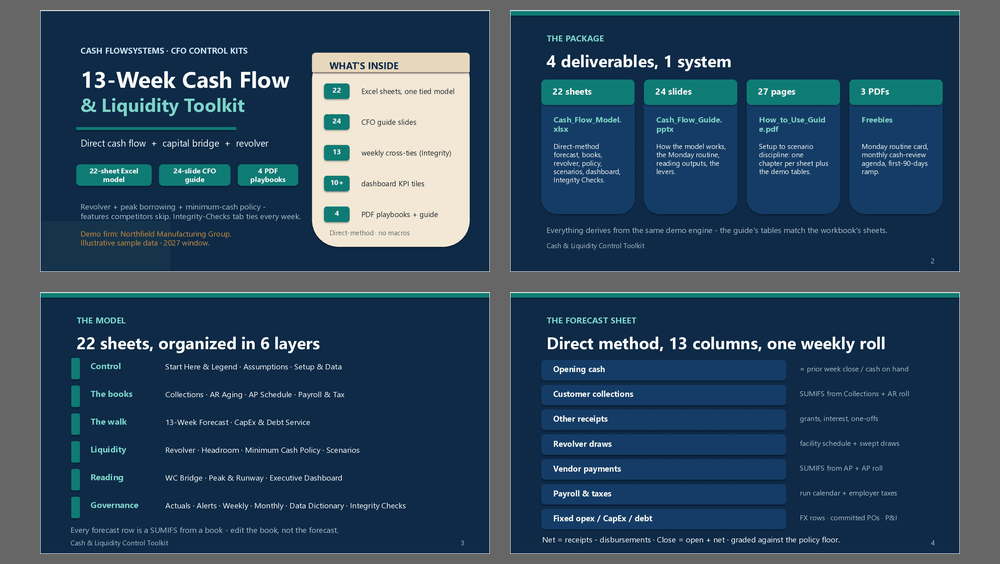
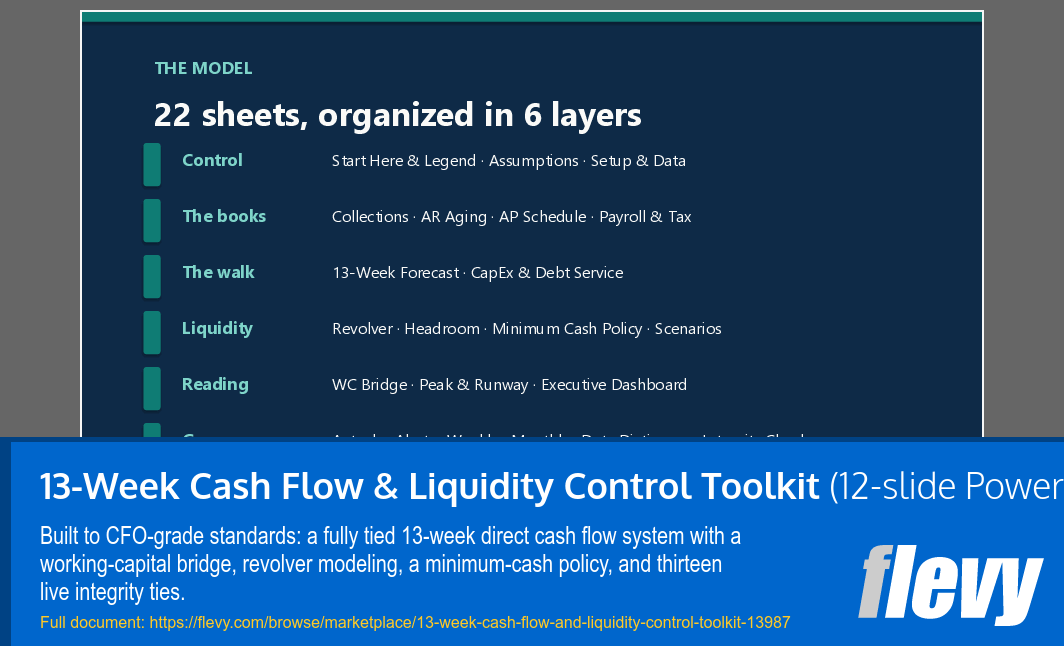
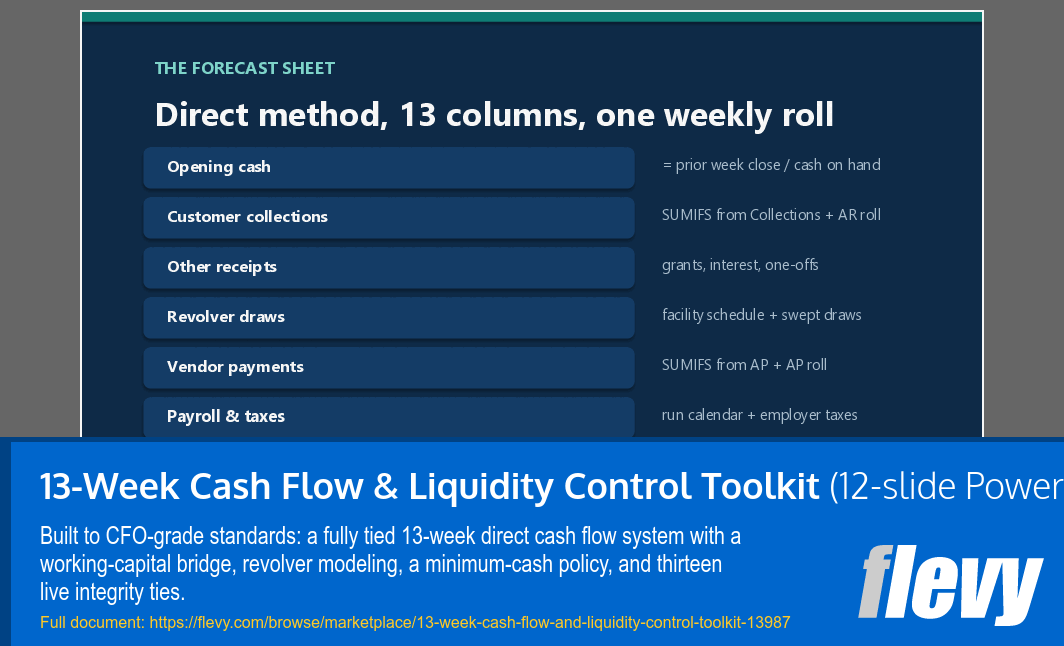
- Provides a governance-grade 13-week direct cash flow model across 22 tied worksheets, from collections and disbursements detail to a weekly policy-grade cash position.
- Adds the liquidity layer most templates skip: revolver and credit-facility modeling with peak borrowing, minimum-cash policy bands with escalation owners, and a working-capital bridge with DSO, DPO, and DIO.
- Protects the work with an Integrity Checks sheet that reruns thirteen cross-sheet ties automatically, so any accidental edit surfaces immediately instead of reaching your lender.
CASH FLOW MANAGEMENT PPT TEMPLATE DESCRIPTION
Most cash-flow templates stop at the forecast. This toolkit is the full discipline lenders and boards expect: a 13-week direct-method forecast, the working-capital bridge that explains it, the credit facility that funds it, the policy that governs it, and an integrity layer that proves it still ties after every edit.
WHAT YOU GET
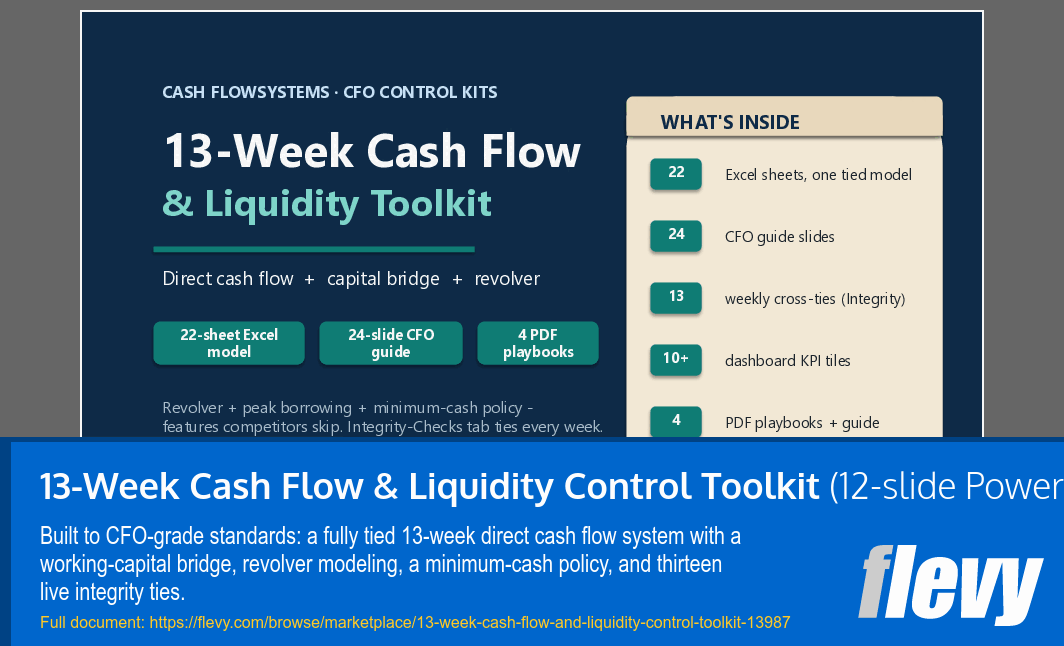
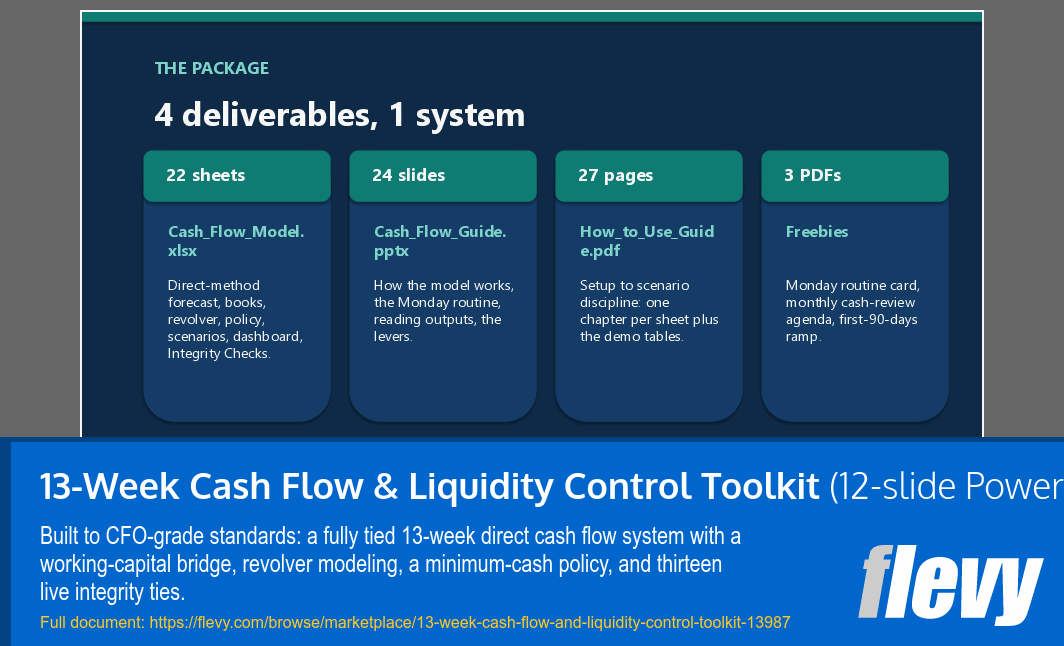
• 22-sheet Excel model, one tied system: Start Here, Assumptions, 13-Week Forecast, Collections & AR Aging, AP Schedule, Payroll & Tax, Working-Capital Bridge, Revolver & Facility, Minimum-Cash Policy, Headroom, CapEx & Debt, Scenarios, Actual vs Forecast, Peak Cash & Runway, Executive Dashboard, Alerts, Weekly Review, Monthly Summary, Integrity Checks, Data Dictionary, Setup
• 24-slide CFO guide (PPT, speaker notes on every slide)
• 27-page How-to-Use guide (PDF) + 3 freebie cards: weekly routine, review agenda, 90-day plan
The 22-sheet Excel model runs one tied engine. Enter invoices as you normally track them, with due dates and an automatic aging bucket, and the model schedules collections week by bills with priorities – critical, normal, or deferrable – and the disbursement plan addresses the trend before it becomes a crisis.
Payroll runs land on their calendar weeks together with employer taxes.
Fixed overheads, committed capex, and debt service carry their own lines, so nothing hides inside a plug.
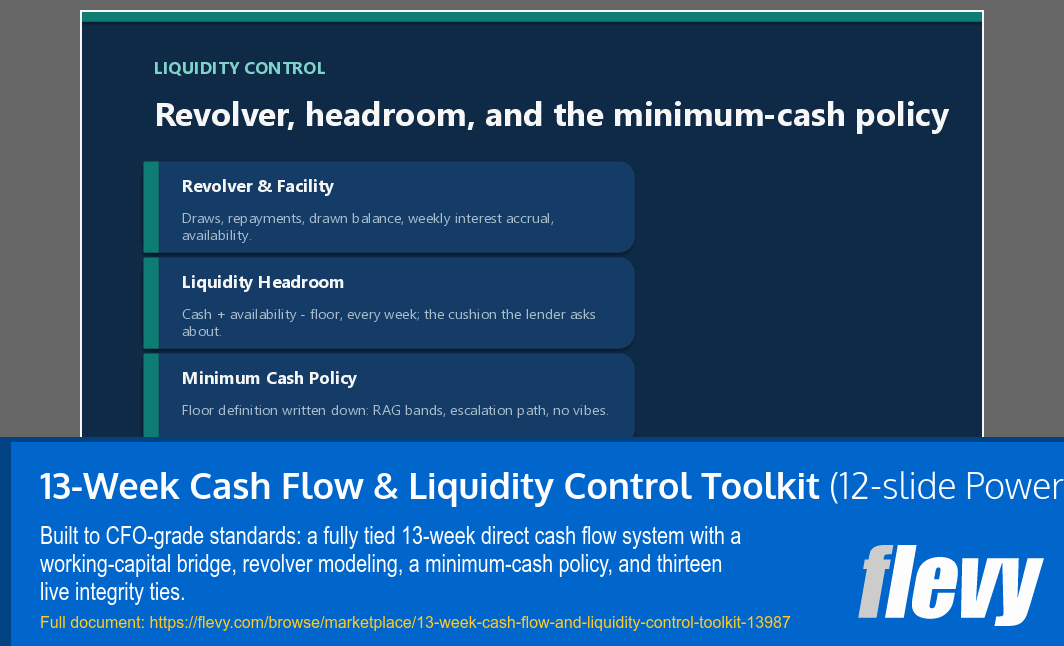
The liquidity layer is what competitors do not include. The Revolver sheet models draws, repayments, the drawn balance, remaining availability, and peak borrowing week by week, with weekly interest accrued from the drawn balance.
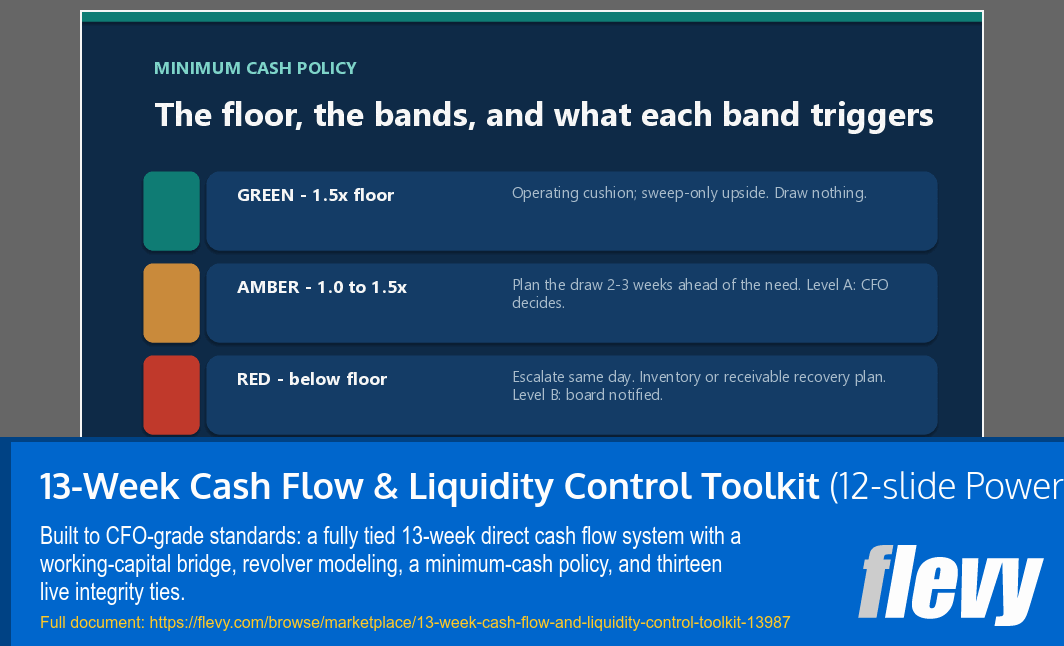
The Minimum Cash Policy sheet grades every weekly close into green, amber, or red bands and names the escalation owner for each.
The Working-Capital Bridge walks accounts receivable, inventory, and accounts payable across the full 13 weeks and reads DSO, DPO, and DIO at the end point.
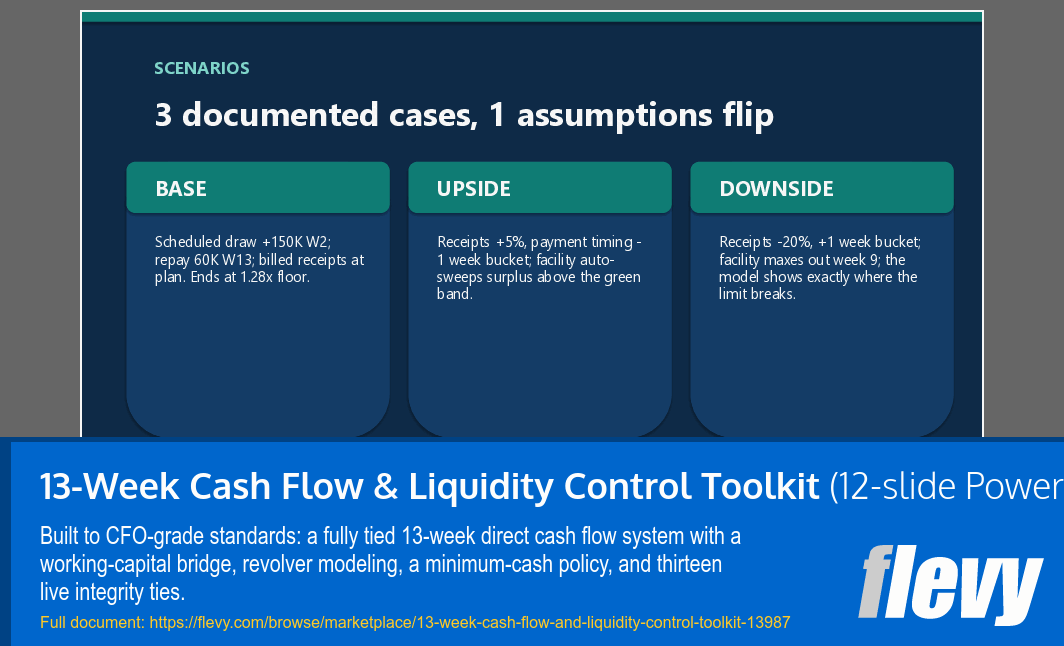
Scenarios are one cell per case. Flip receipts, disbursements, or the aging slip and the full 13 weeks re-derives, including automatic facility sweeps in the upside case and a downside case that shows exactly where the credit limit breaks.
Actuals replace the forecast week after week, and the variance column names the driver of every gap.
An Executive Dashboard gives the 10 tiles a board wants – ending cash, peak borrowing, total liquidity, the weakest close, breach weeks, and more – backed by 4 charts. The Integrity Checks sheet reruns 13 cross-sheet ties live; if an accidental edit breaks the model, it says so loudly instead of letting a silent error reach your lender.
Everything is plain spreadsheet craft: no macros, no external links, no bank connections, no subscriptions.
The package ships with a 24-slide CFO guide, a 27-page how-to manual, and three one-page adoption cards, all demonstrated on an illustrative sample manufacturer so every technique is visible in action before you enter your own numbers.
Got a question about the product? Email us at support@flevy.com or ask the author directly by using the "Ask the Author a Question" form. If you cannot view the preview above this document description, go here to view the large preview instead.
Source: Best Practices in Cash Flow Management, Working Capital Management PowerPoint Slides: 13-Week Cash Flow & Liquidity Control Toolkit PowerPoint (PPTX) Presentation Slide Deck, WebsiteGeek
ABOUT THE AUTHOR

WebsiteGeek offers free website tools, SEO suites, file converters, browser extensions, calculators, and image utilities built to supercharge your productivity.
We also builds practical digital tools and templates for small business owners -- real formulas and sourced data.
Ask the Author a Question
You must be logged in to contact the author.