
 Click main image to view in full screen. Unlock all 10 preview images:
Statistical Process Control (SPC) Excel Toolkit + Gage R&R – Excel XLSX
Excel (XLSX)


VIDEO DEMO
BENEFITS OF THIS DOWNLOADABLE EXCEL DOCUMENT
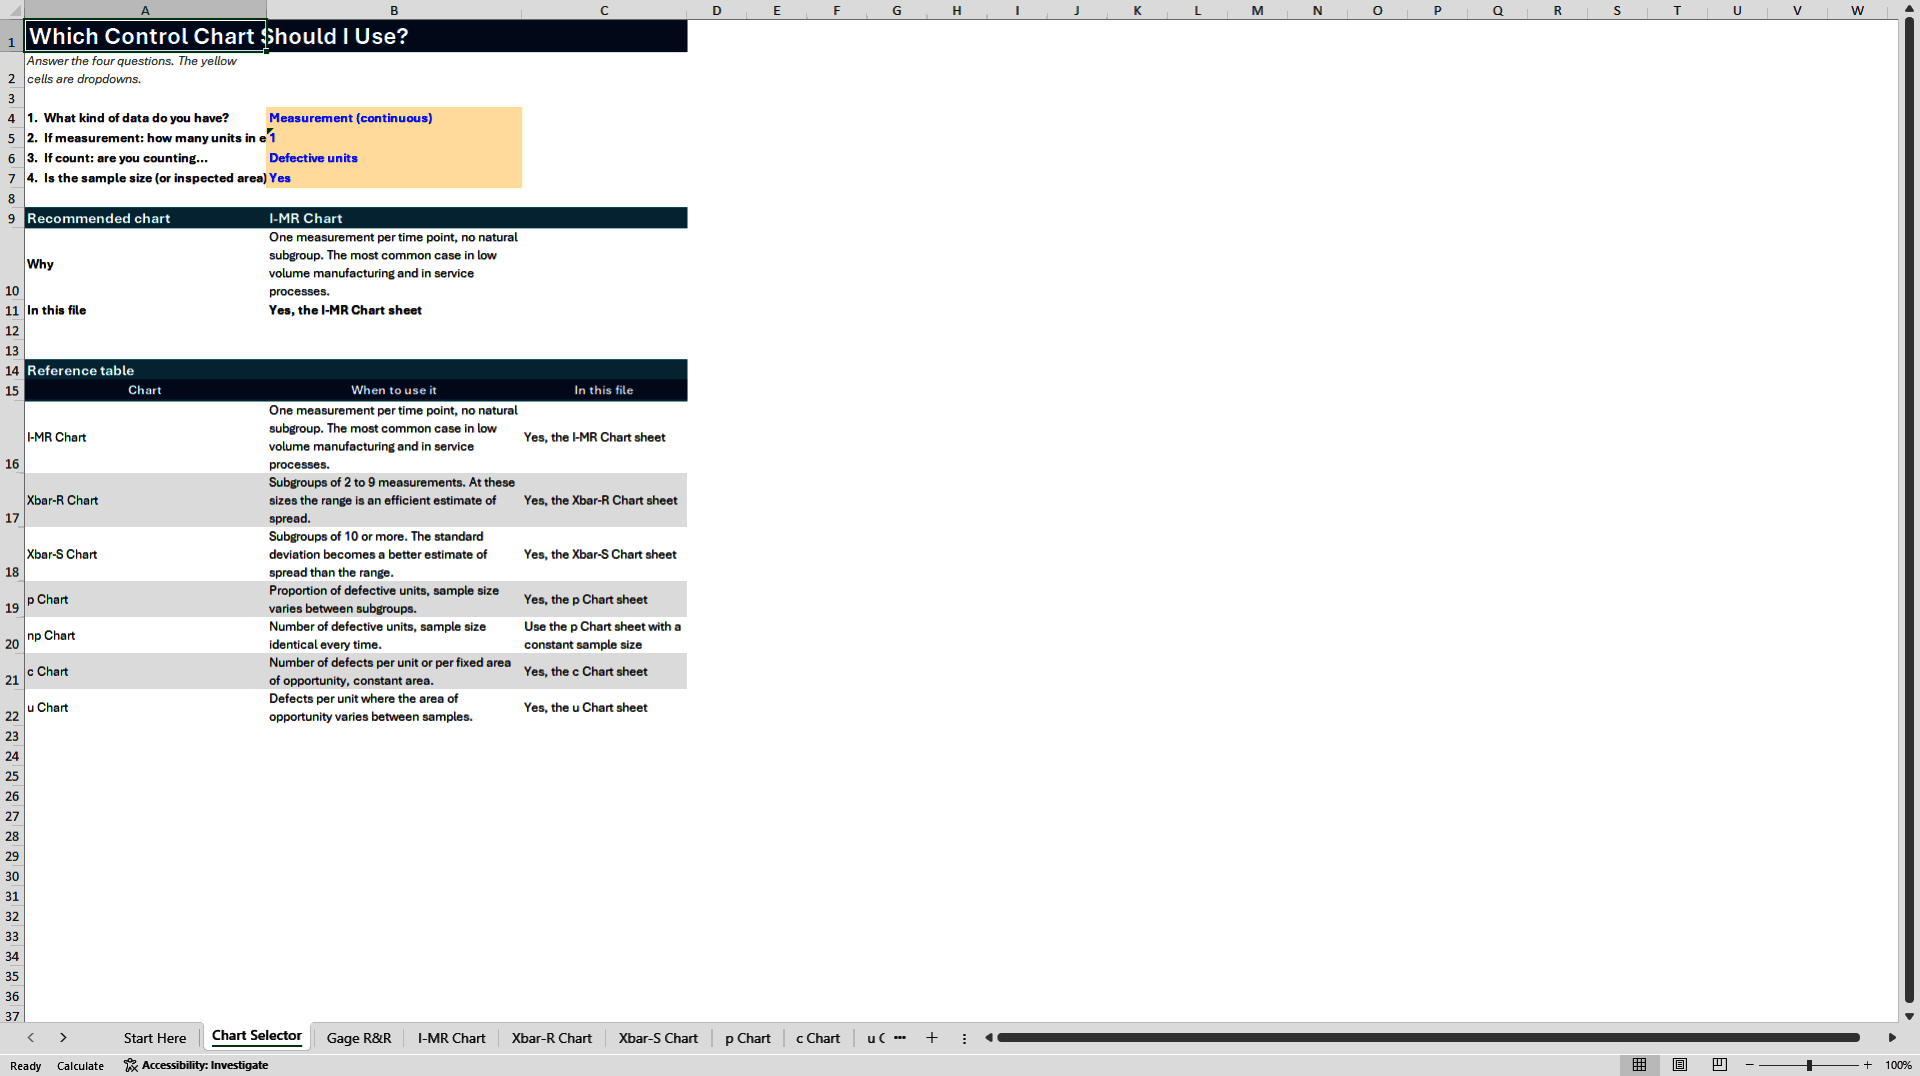
- Stop guessing which chart to use. Four questions select the right control chart, the correct constants load automatically for your subgroup size, and every out-of-control signal is flagged for you as you enter data.
- Send a Cpk you can defend. Short term and long term capability are reported separately, with a written interpretation and an explicit warning when the process is drifting or unstable, so you never quote a number the data does not support.
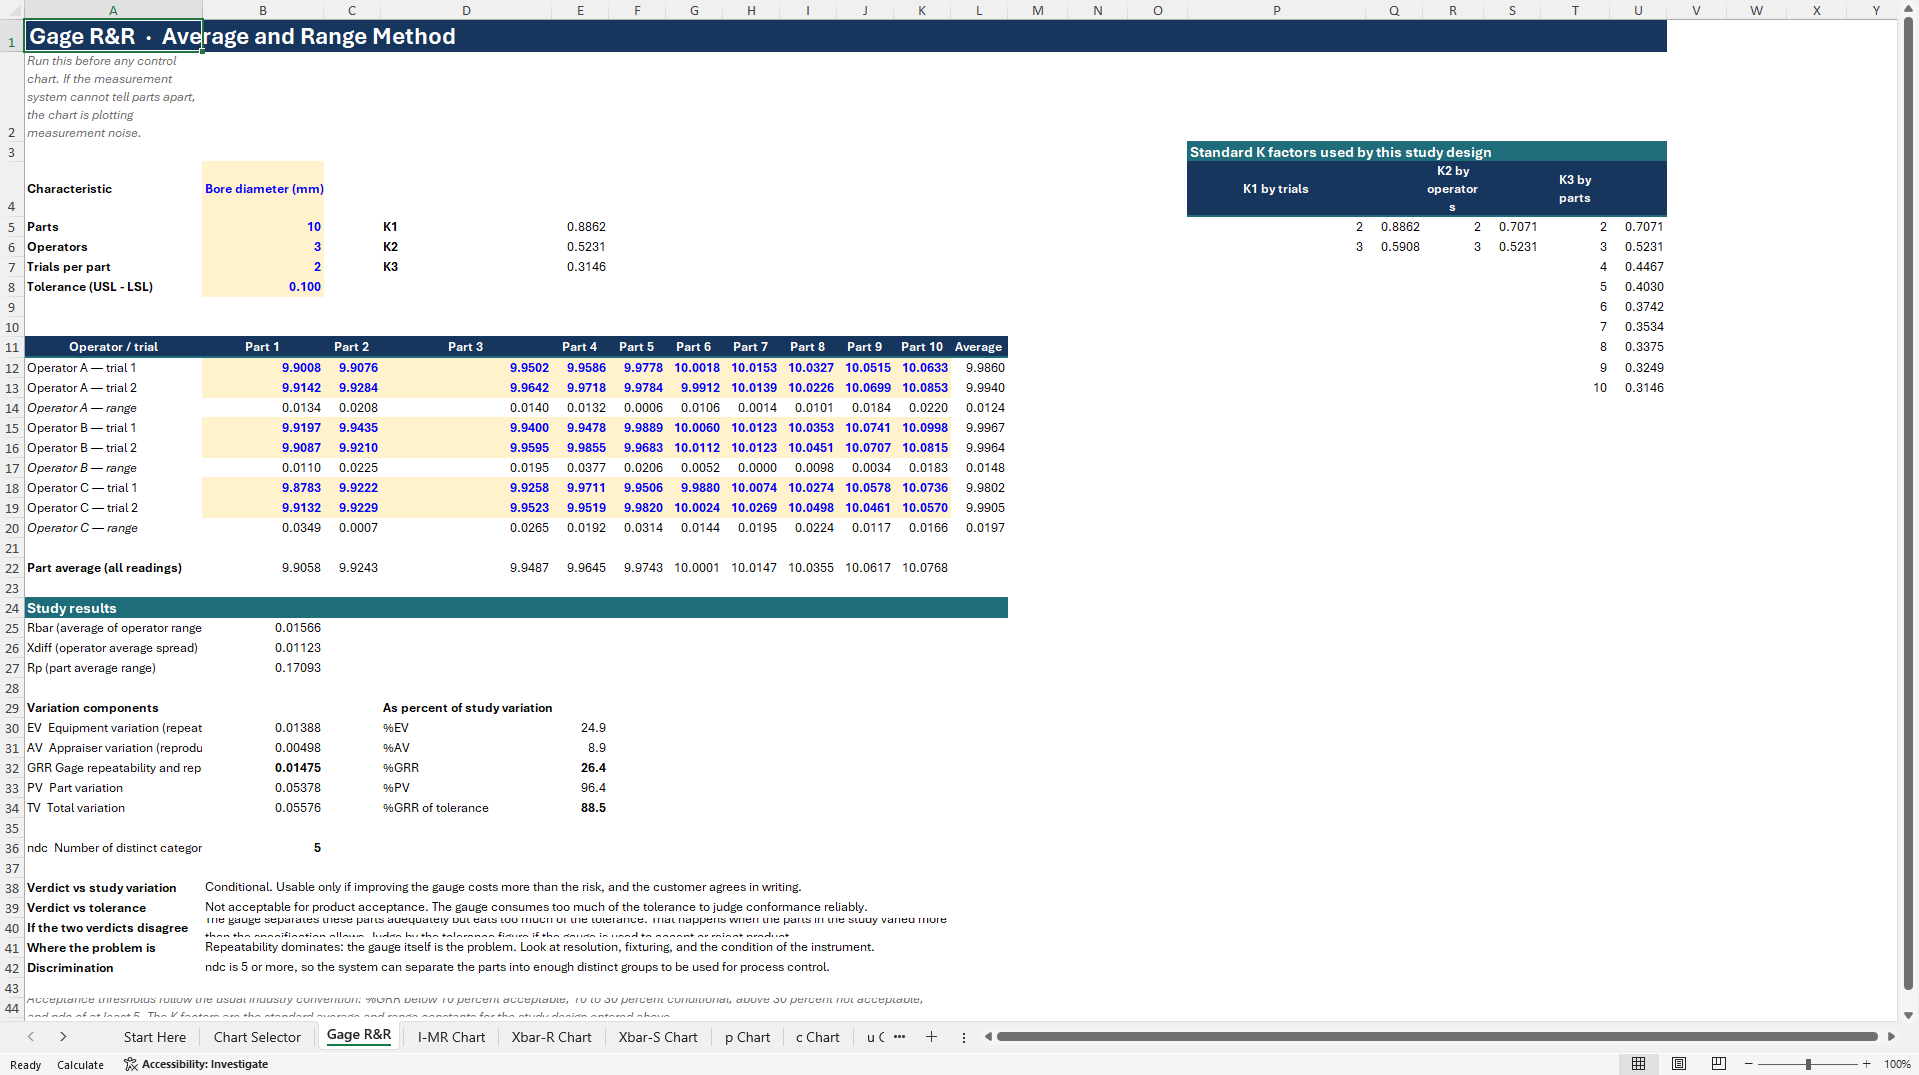
- Prove the measurement system before you trust the data. A full Gage R&R with %GRR against both study variation and tolerance, a verdict for each, and a diagnosis telling you whether the gauge or the operator is the problem.
QUALITY MANAGEMENT EXCEL DESCRIPTION
Most SPC material teaches you the theory and leaves you to build the spreadsheet. This is the spreadsheet.
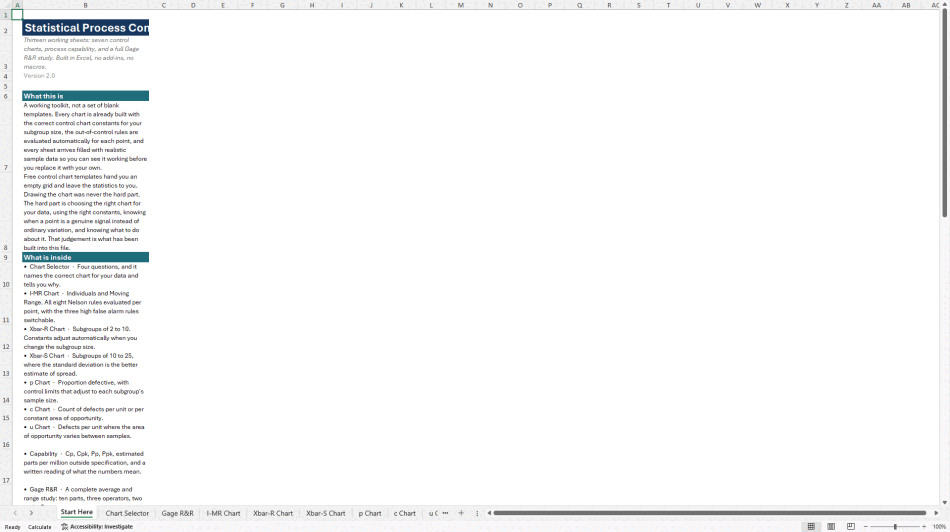
Thirteen working sheets. Every control chart constant already in place, every out-of-control rule evaluated for every point, and realistic sample data on every sheet so you can see the tool working before you replace the data with your own. Standard Excel throughout: no macros, no add-ins, no add-on licence.
Drawing a control chart was never the hard part. The hard part is choosing the right chart for your data, using the right constant for your subgroup size, telling a genuine signal from ordinary variation, and knowing what to do when one appears. That judgement is what has been built into this file.
WHAT IS INSIDE
Chart Selector. Answer four questions and it names the correct chart for your data, and explains why.
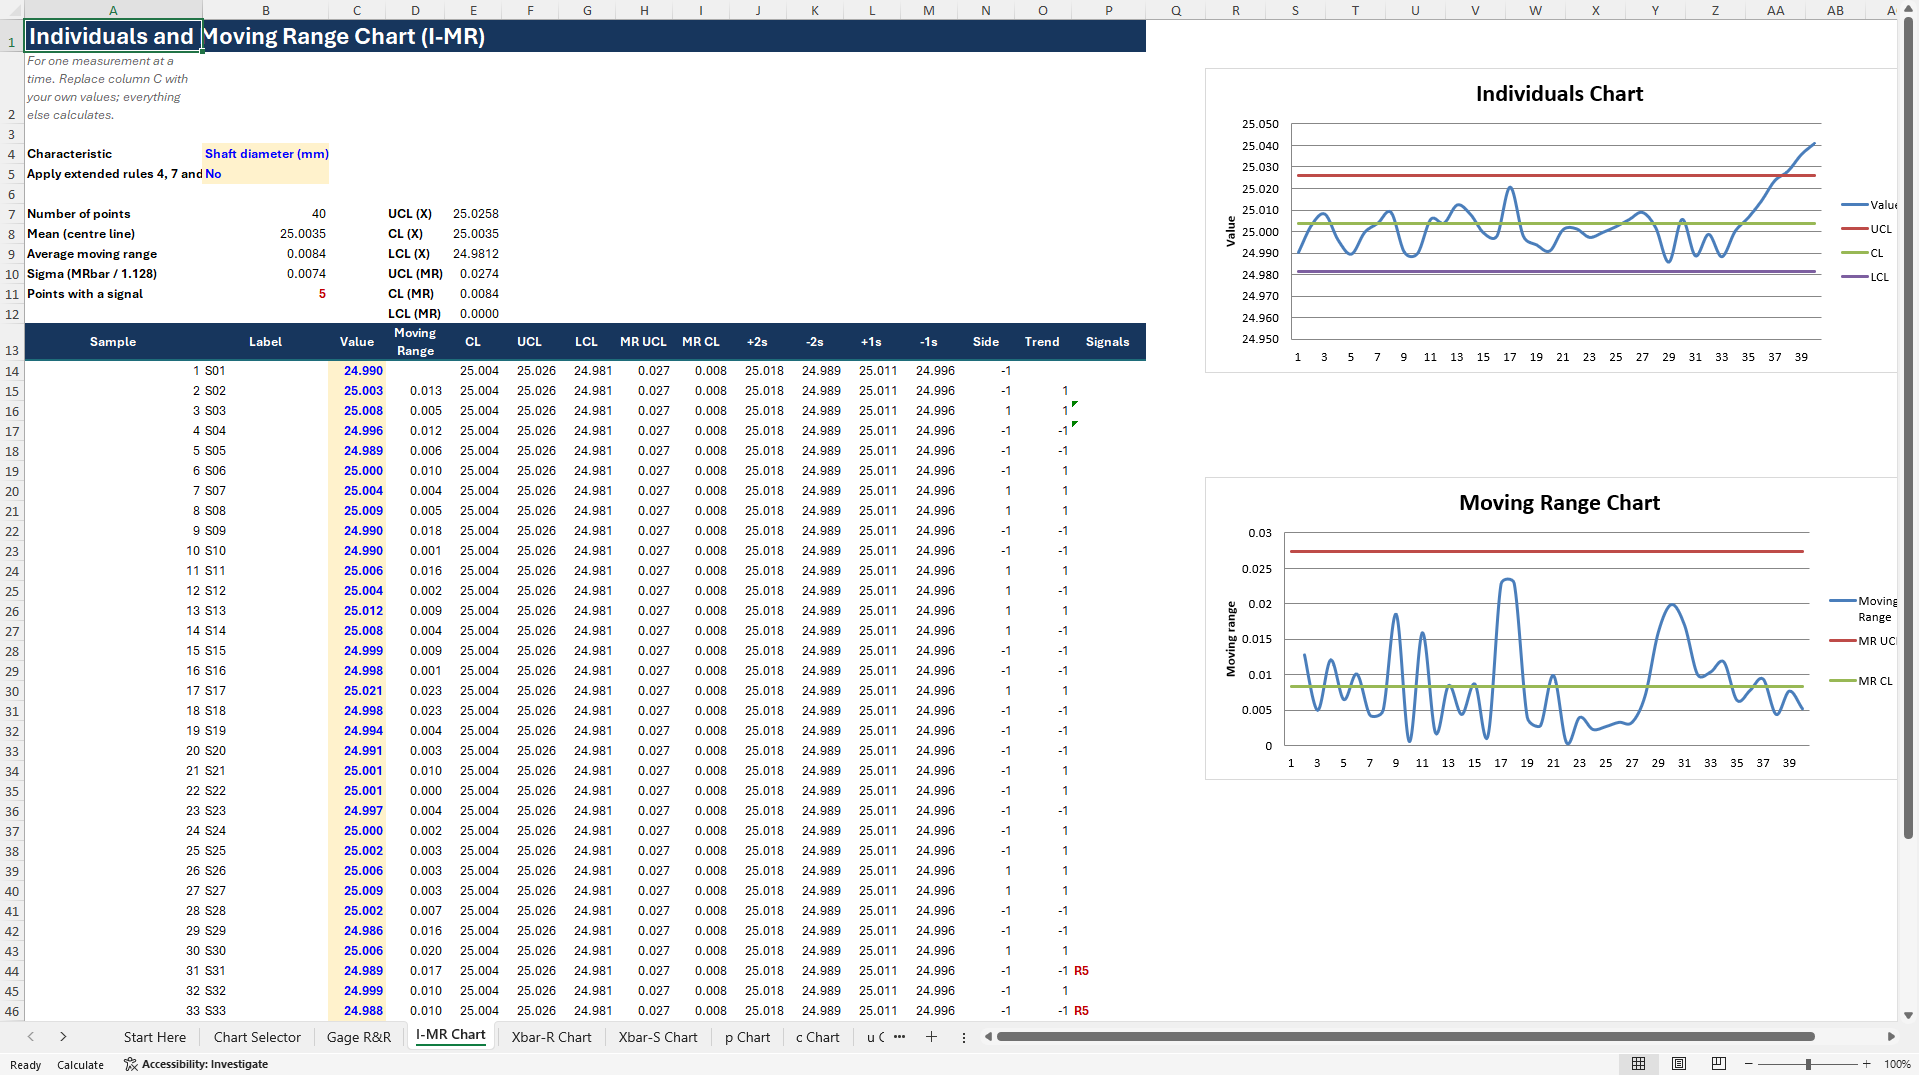
I-MR Chart. Individuals and Moving Range for single measurements. All eight Nelson rules calculated per point, with rules 4, 7 and 8 switchable, because they roughly quadruple the false alarm rate.
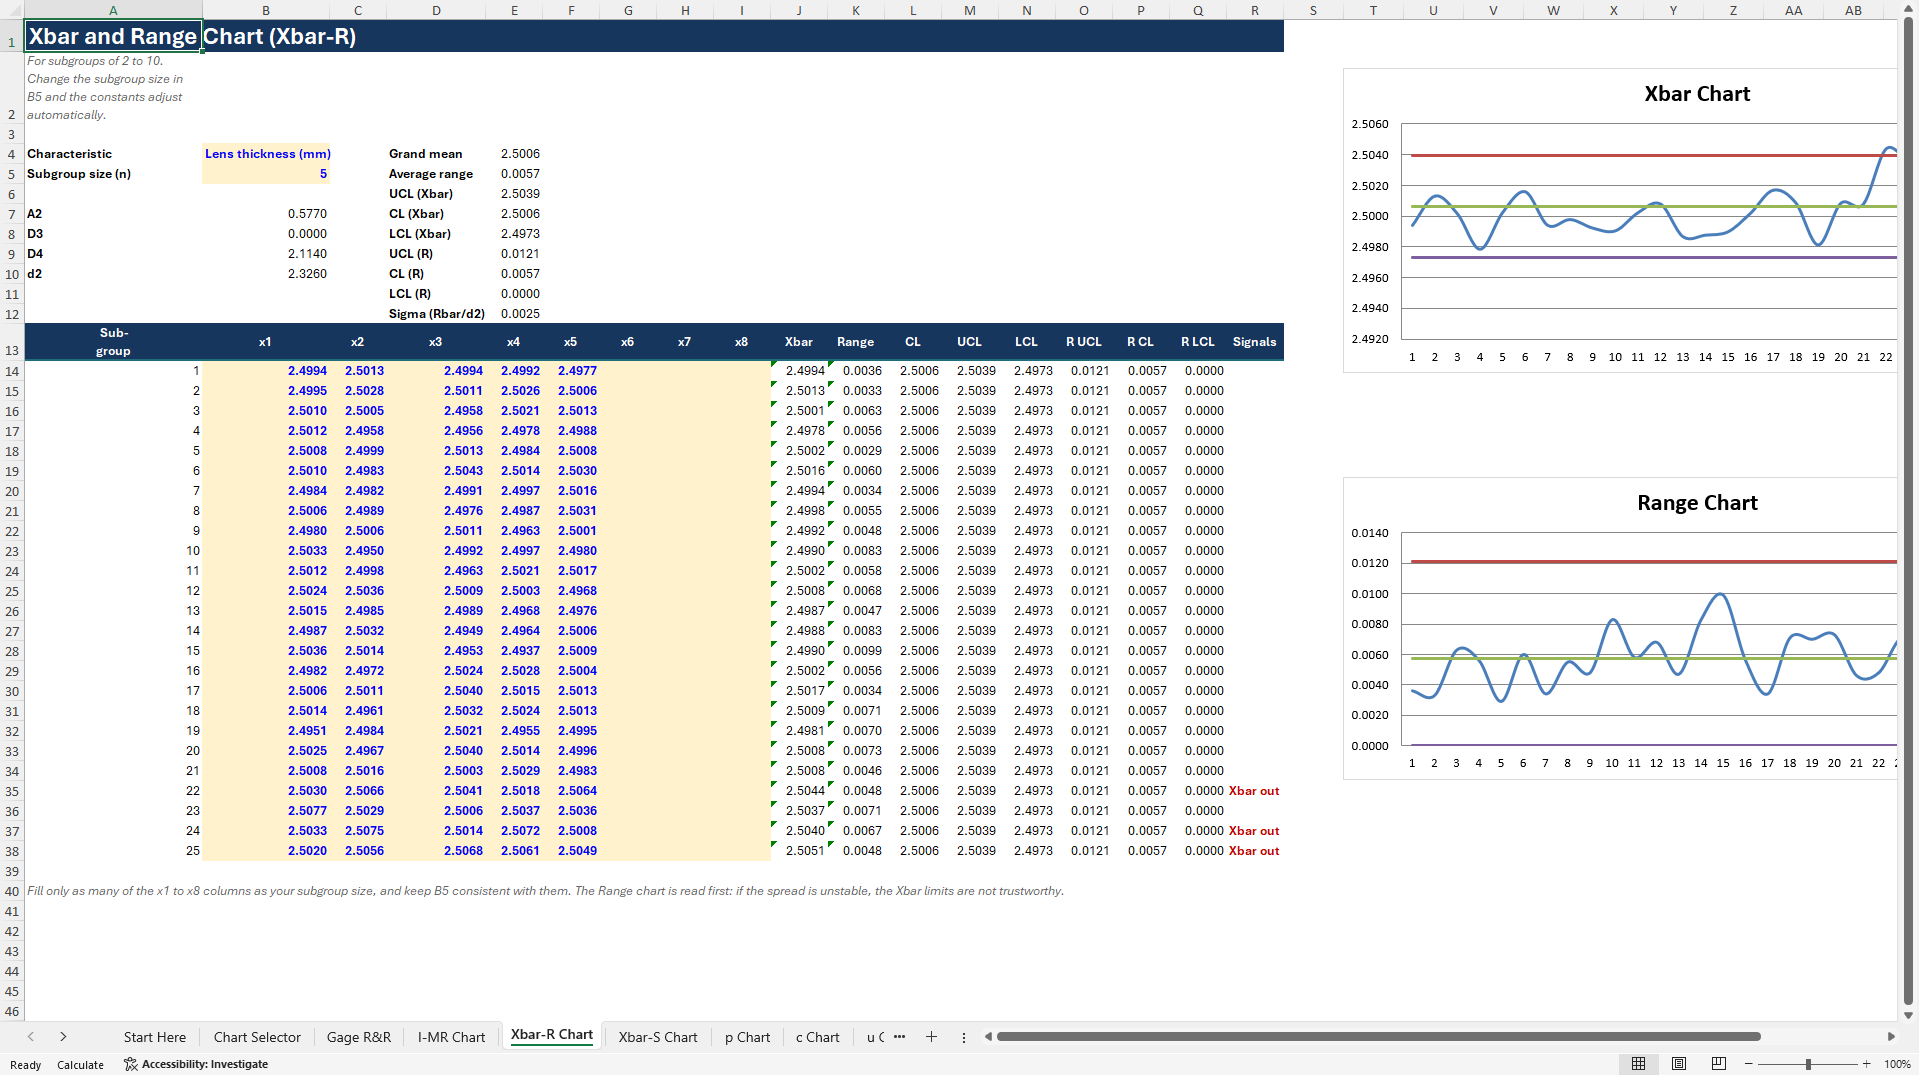
Xbar-R Chart. Subgroups of 2 to 10. Change the subgroup size and A2, D3, D4 and d2 update automatically.
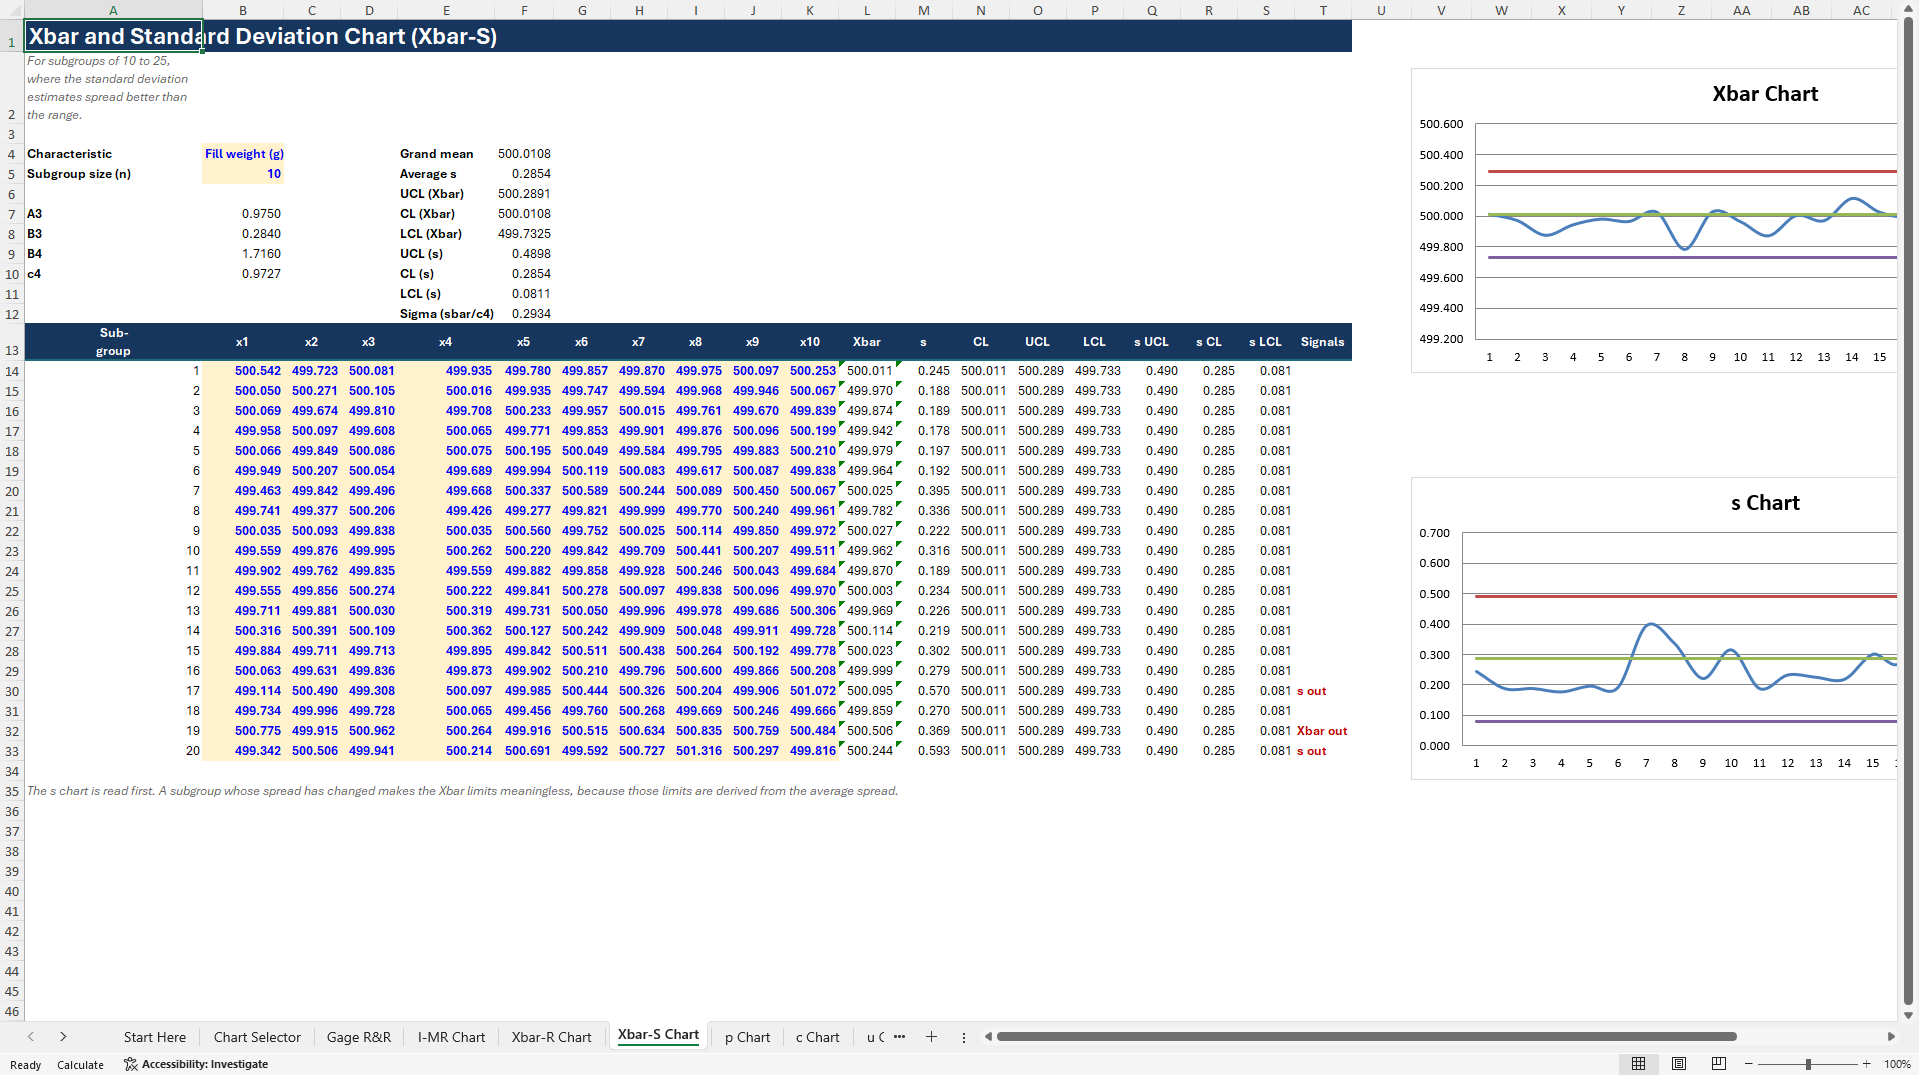
Xbar-S Chart. Subgroups of 10 to 25, using A3, B3, B4 and c4.
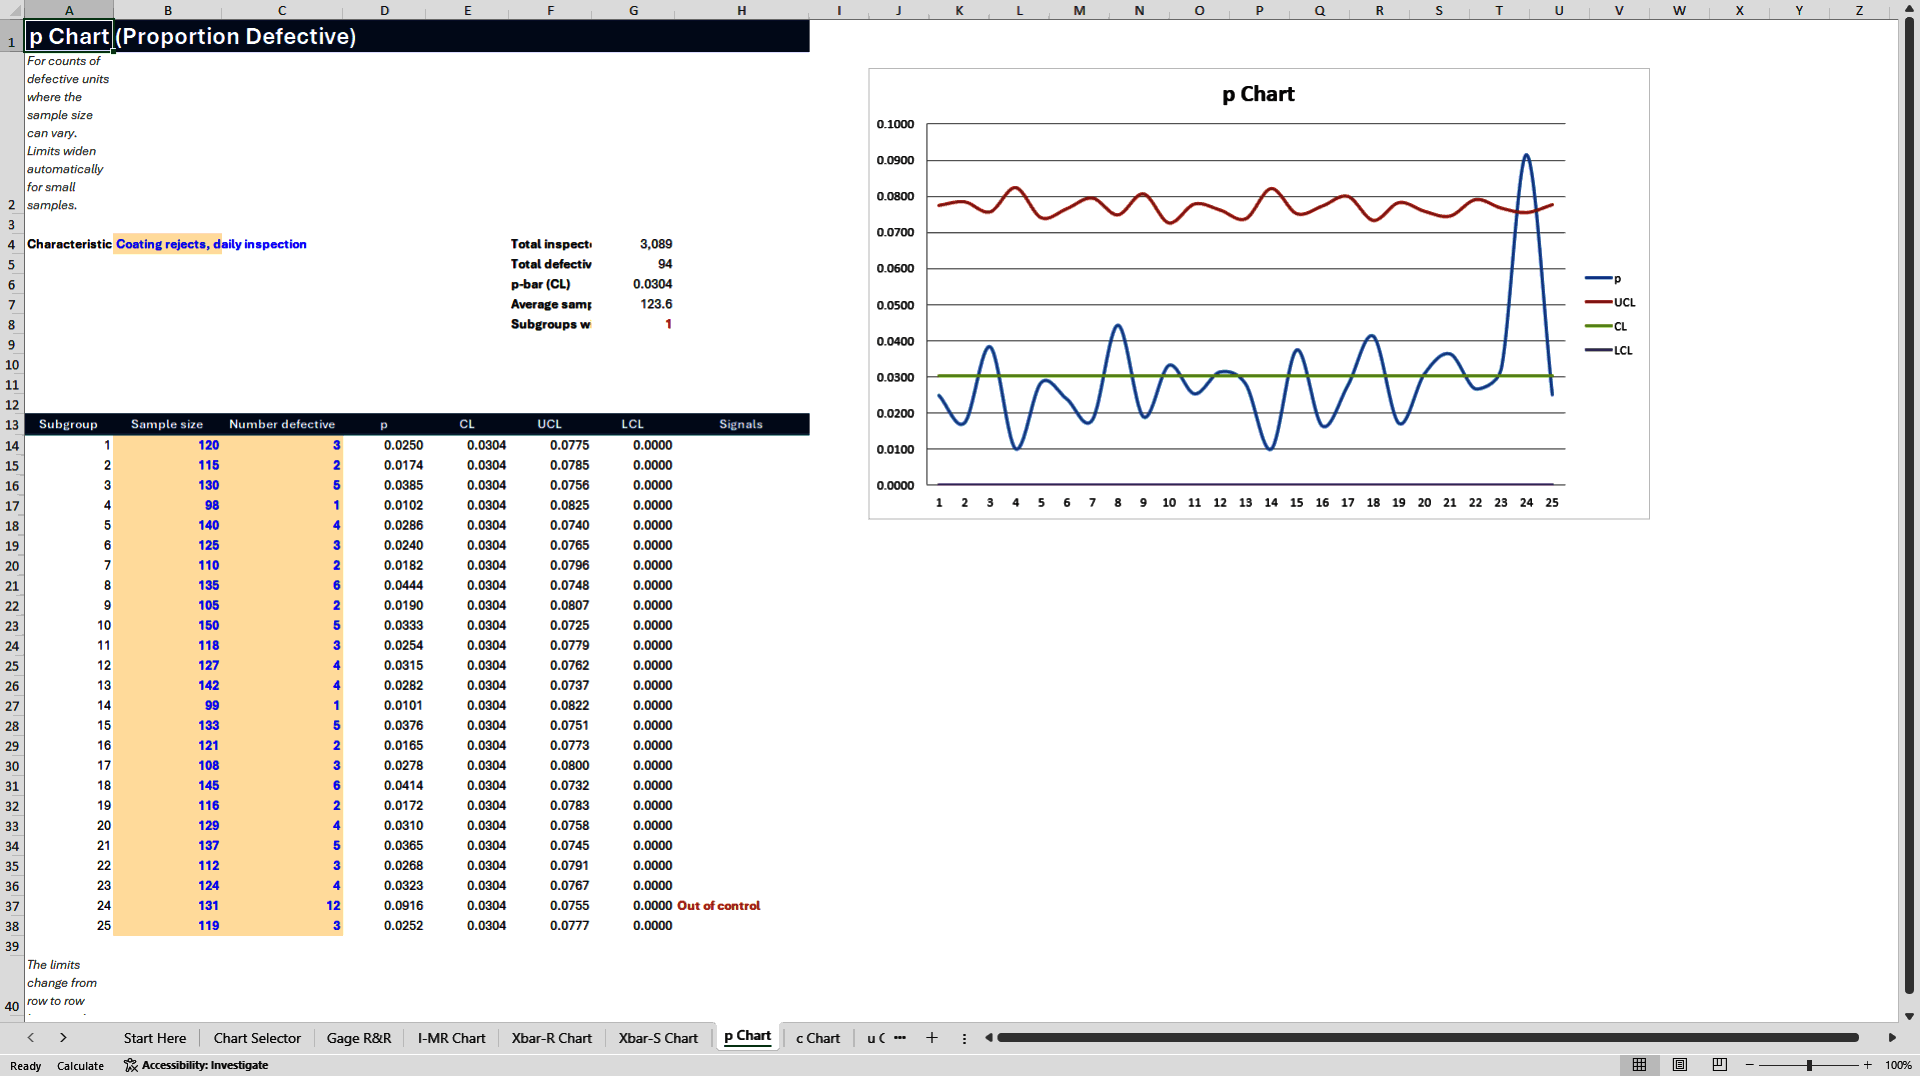
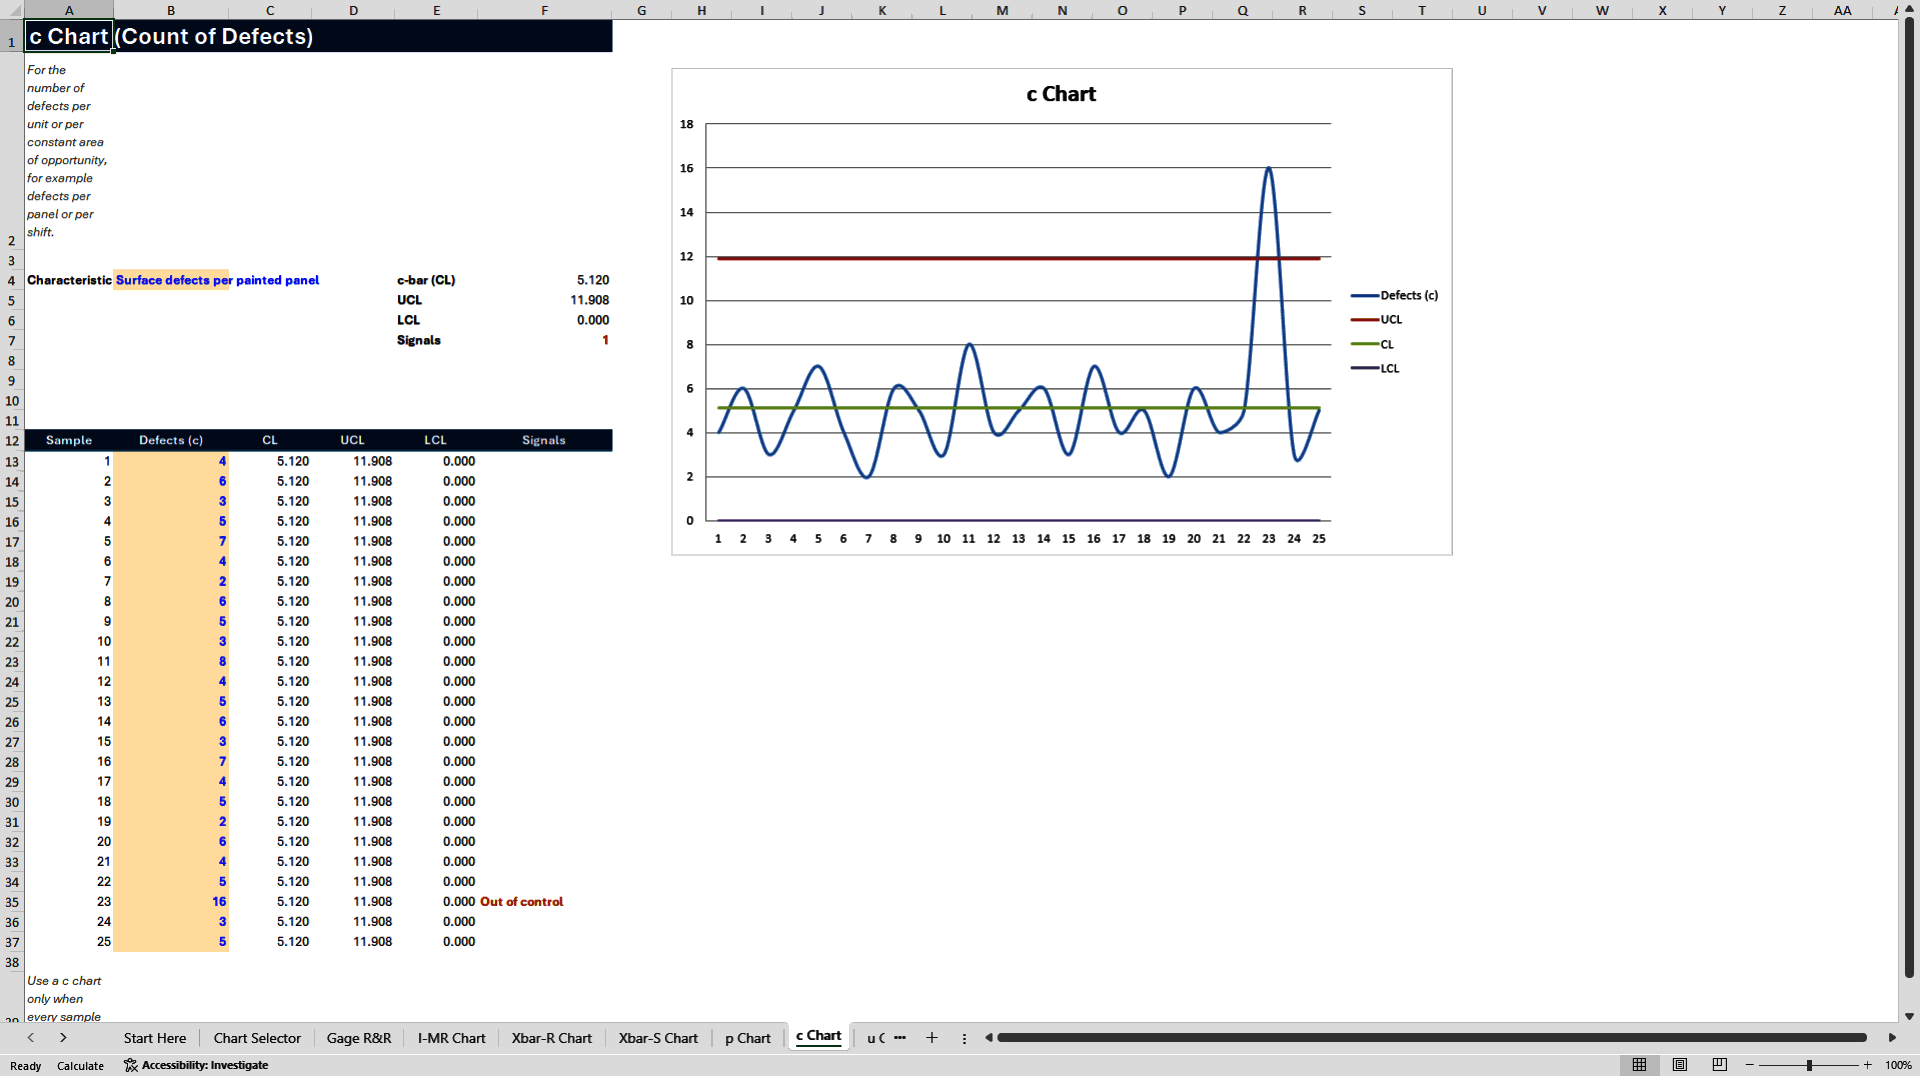
p, c and u Charts. Proportion defective with limits that adjust to each subgroup's sample size, defects per constant area of opportunity, and defects per unit where that area varies. An np chart is covered by the p chart at a constant sample size.
Capability. Cp, Cpk, Pp, Ppk, estimated ppm outside specification and sigma level, each with a written reading. Short term and long term are reported separately, with a warning when the two diverge, and the sheet tells you plainly when the control chart says the process is not stable enough for capability to mean anything.
Gage R&R. A complete average and range study: ten parts, three operators, two trials. EV, AV, GRR, PV and ndc, with %GRR against both study variation and tolerance. When those two verdicts disagree the sheet explains why and tells you which to trust, and it tells you whether the problem is the gauge or the operators.
Interpreting Signals. For every rule: the likely cause, what to do, and the common wrong reaction that makes it worse.
Nelson Rules and Constants. All eight rules with their false alarm behaviour, and A2, A3, d2, D3, D4, B3, B4 and c4 for n = 2 to 25.
WHO IT IS FOR
Quality engineers and managers in manufacturing, Green Belts and Black Belts running DMAIC projects, suppliers preparing for IATF 16949, ISO 9001 or a customer audit, and anyone who has been asked for a Cpk and is not certain the number they are about to send is defensible.
FORMAT
One Excel workbook, thirteen sheets, around 1,400 formulas, no macros. Excel 2016 or later, and LibreOffice Calc.
Got a question about the product? Email us at support@flevy.com or ask the author directly by using the "Ask the Author a Question" form. If you cannot view the preview above this document description, go here to view the large preview instead.
Source: Best Practices in Quality Management, Six Sigma Project Excel: Statistical Process Control (SPC) Excel Toolkit + Gage R&R Excel (XLSX) Spreadsheet, Moussa | Six Sigma Tools & Training




























