

SOLAR ENERGY EXCEL DESCRIPTION
The renewable energy sector thrives on innovation, accuracy, and long-term planning. With advancements in financial modeling, the Solar Energy Excel Financial Model has become an indispensable tool for developers, investors, and operators in the solar industry. Acting as a bridge between clean energy generation and financial performance, this model allows stakeholders to analyze costs, forecast revenues, and evaluate project viability with confidence. For solar energy ventures, success is not only about harnessing the power of the sun, but also about ensuring financial sustainability and maximizing returns on investment.
Key Features of the Model
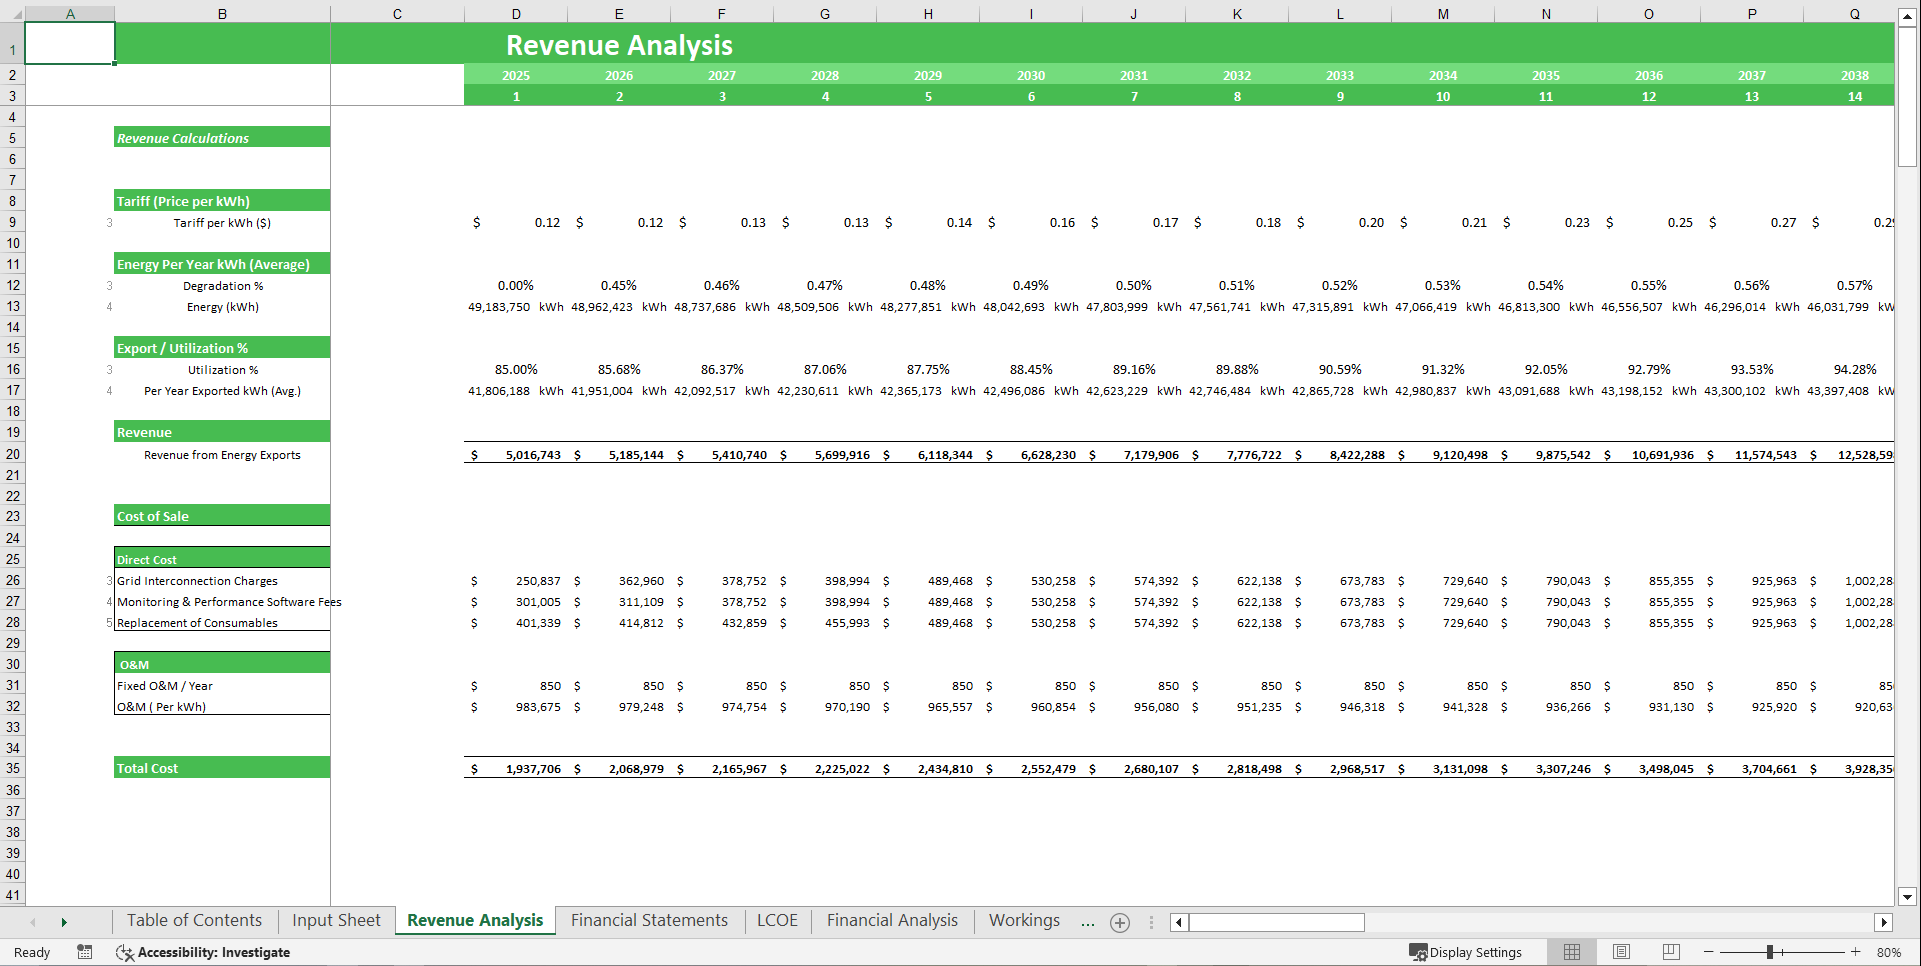
Revenue Projections
1. Sales Forecasting: Estimate revenue based on installed solar capacity, annual energy generation (kWh), electricity tariff per unit, and annual degradation in efficiency.
2. Revenue by Category: Break down income into energy sales, renewable energy credits/carbon offsets, government incentives or subsidies, and residual value at project end.
3. Competitive Advantages: Highlight strengths such as long-term power purchase agreements (PPAs), high efficiency solar PV technology, stable cash flows from predictable generation, favorable financing structure with low WACC, and strong IRR attracting investors.
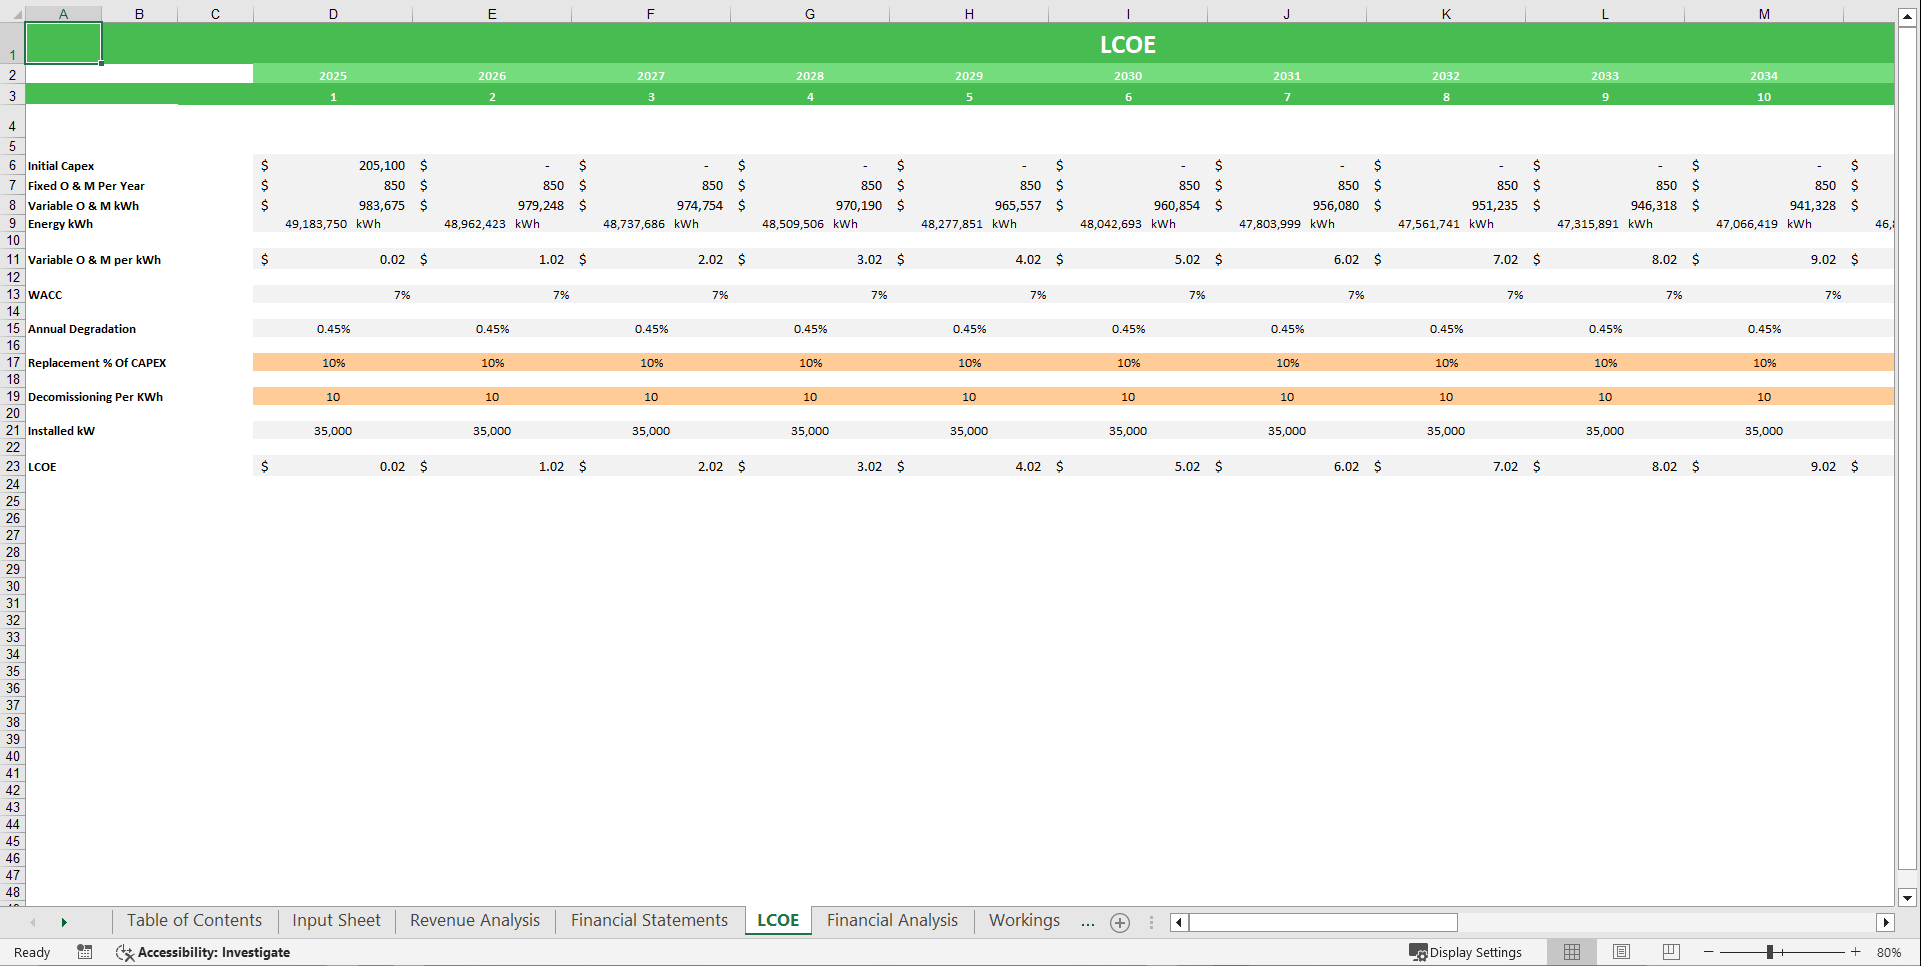
Cost Structure
1. Direct Costs: Track project-related expenses such as initial capital investment, fixed operation and maintenance costs, variable O&M based on energy output, equipment replacement, and decommissioning expenses at the end of project life.
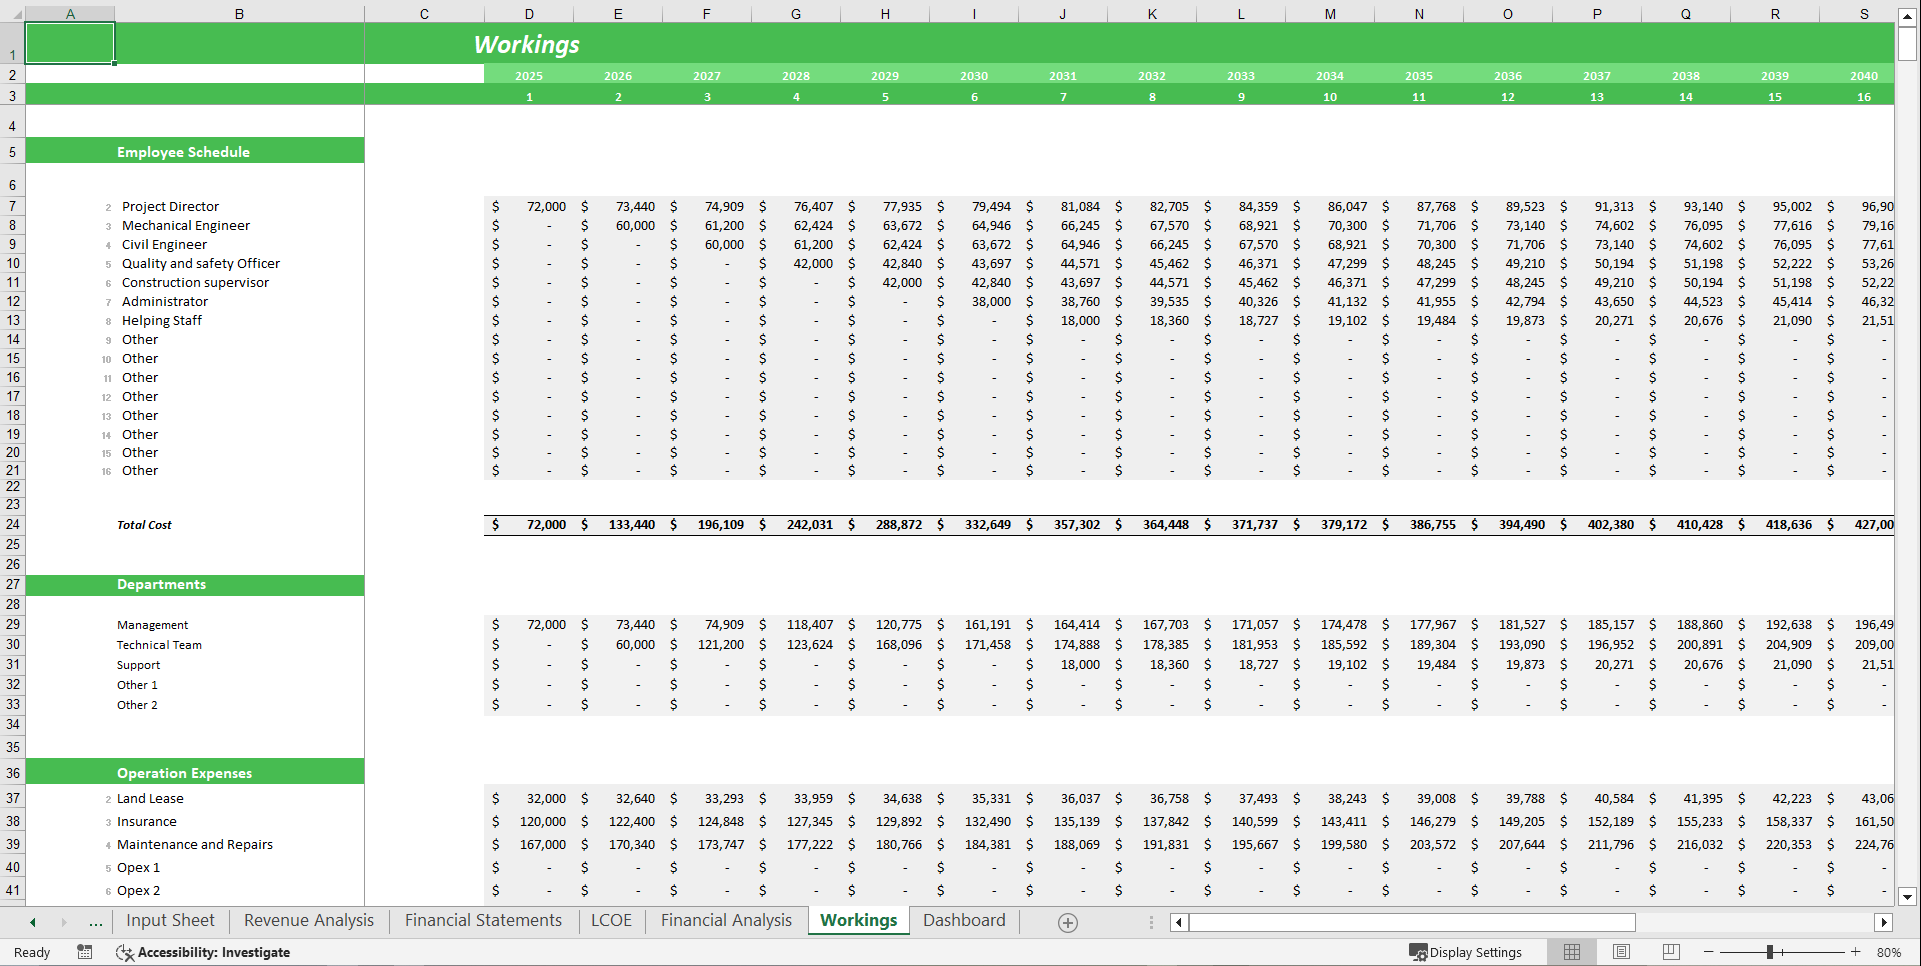
2. Administrative Expenses: Include costs such as financing charges, insurance, regulatory compliance, accounting/legal services, and general office administration.
3. Business Expenses: Capture overheads such as depreciation of plant and equipment, corporate tax obligations, loan repayments, contingency reserves, and reinvestments.
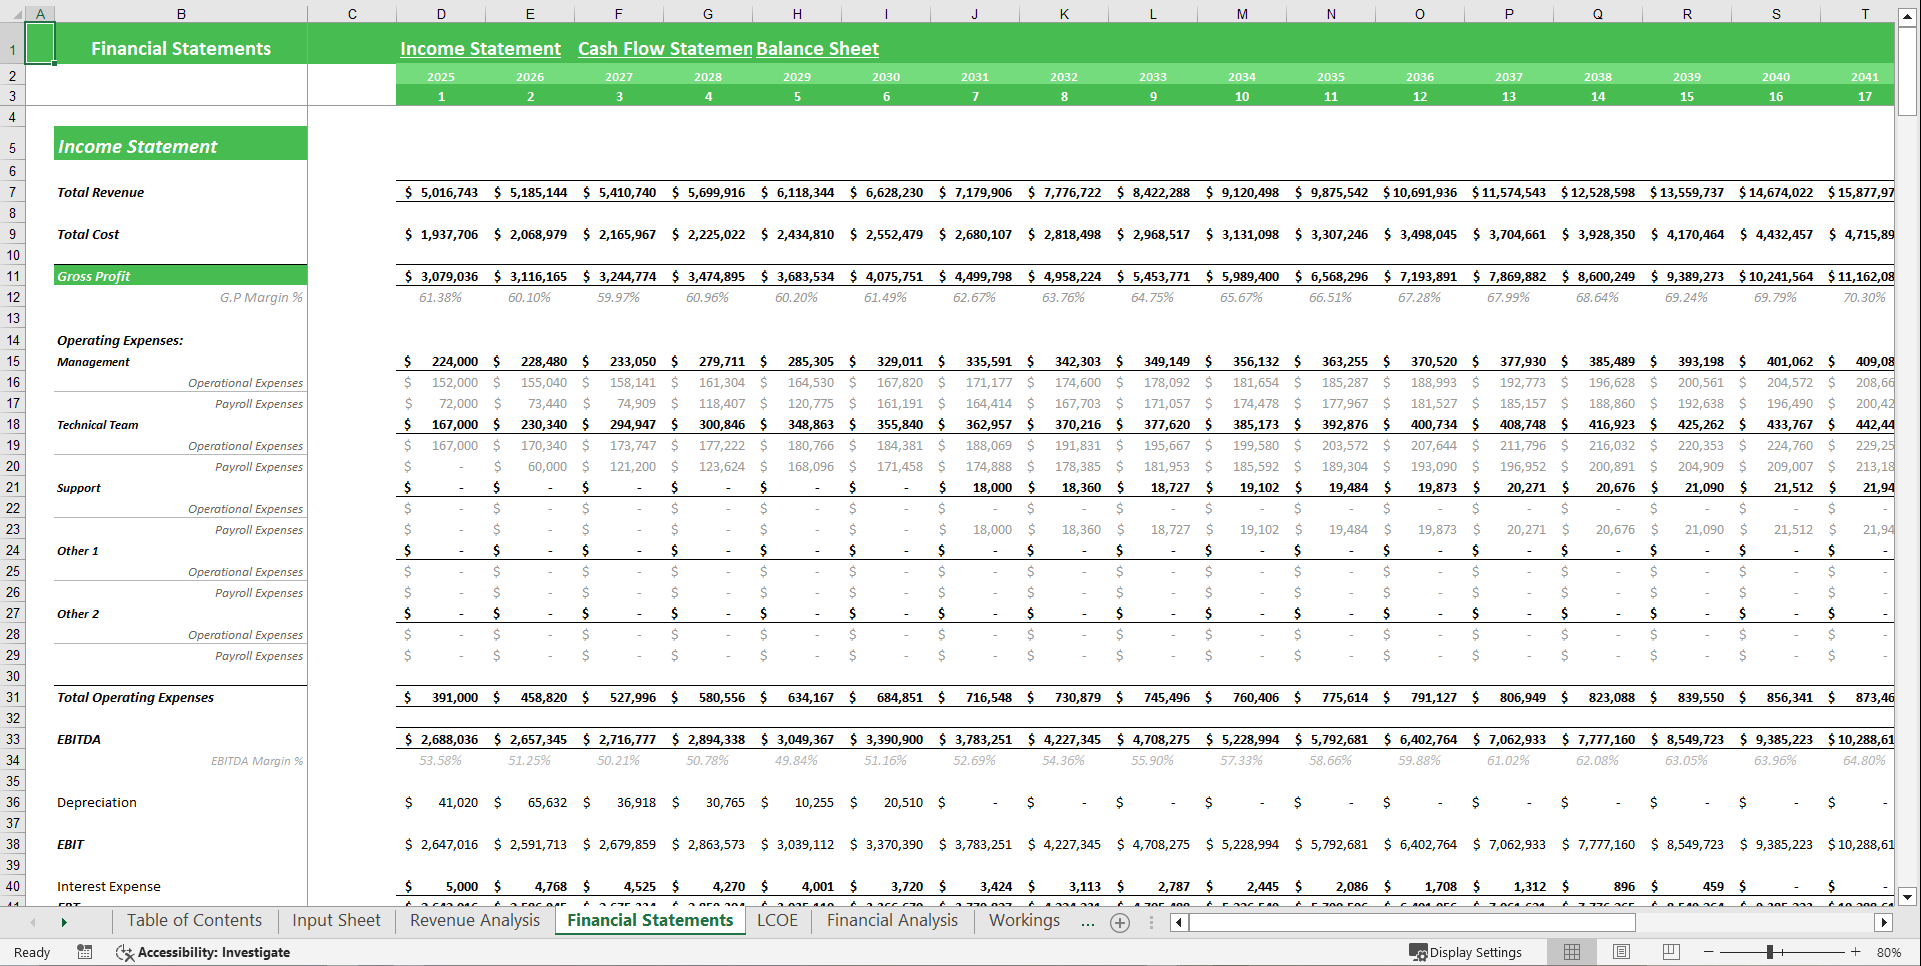
Profitability Analysis
1. Profit and Loss Statement: Track income, expenses, and profit over 5 years.
2. Gross Margin & Net Profit: Get to know what is the performance of the Industrial based on gross and net profit.
3. Break-Even Analysis: Determine the number of Customers needed to cover costs and achieve profitability.
Cash Flow Management
1. Cash Flow Statement: Track money flowing in and out of your business.
2. Financial Position: Ensure adequate working capital for seamless operations.
3. Investment Scheduling: Plan accordingly the cashflow to make your investment decisions for a smoother flow of operations.
Financial Forecasting & Scenario Analysis
1. 5-Year Financial Plan: Develop long term projections for revenue, expenses, and profitability.
2. Market Conditions & Trends: Adjust financial forecasts based on industry changes and customer behavior.
3. Best-Case, Base-Case, and Worst-Case Scenarios: Evaluate different financial outcomes and prepare accordingly.
Key Performance Indicators (KPIs)
1. Energy Generation & Revenue Mix: Track electricity generation in kWh and revenue contribution from energy sales, renewable energy credits, government incentives, and residual value to assess income diversification.
2. Operational Efficiency & Growth Potential: Monitor capacity utilization, system degradation rates, and identify growth opportunities through expansion of installed capacity, efficiency improvements, or entry into new markets.
3. Financial Statements: Access dynamic income statement, cash flow, and balance sheet to evaluate profitability, manage operating and financing costs, and plan for long-term sustainable growth.
Investor Readiness & Business Strategy
1. Attract Potential Investors: Present a professional financial plan to secure funding.
2. Strategic Planning: Align business objectives with financial projections for long term success.
3. Cost Analysis & Optimization: Better understand which costs can be minimized and which one have to most impact on profitability.
Key Benefits of Using This Model
1. Better Financial Planning: Gain a clear understanding of your business's financial feasibility.
2. Optimized Operations: Enhance cost analysis and resource allocation.
3. Risk Mitigation: Plan ahead for financial uncertainties and avoid cash shortages.
4. Customizable Tool: Adapt the model to fit different business needs.
5. Scalability: Suitable for both small startups and established agencies.
FAQs
1. What is the Solar Energy Excel Financial Model Template?
A tool to help developers, investors, and project managers plan, assess, and forecast solar project financial performance, including costs, cash flow, and profitability.
2. Who can use this model?
Solar energy developers, investors, project managers, financial analysts, and consultants seeking financial insights into solar projects.
3. How does this model assist with financing?
It helps assess costs, financing options, and forecast future cash flows, ensuring a balanced debt-equity structure and accurate project valuation.
4. Can this model help assess risks?
Yes, with sensitivity analysis to evaluate market risks, cost fluctuations, and the impact of changing assumptions on financial forecasts.
Got a question about the product? Email us at support@flevy.com or ask the author directly by using the "Ask the Author a Question" form. If you cannot view the preview above this document description, go here to view the large preview instead.
Source: Best Practices in Solar Energy, Integrated Financial Model Excel: Solar Energy Financial Model Template Excel (XLSX) Spreadsheet, Oak Business Consultant
