
 Click main image to view in full screen. Unlock all 11 preview images:
Solar + BESS Project Finance Model (ITC, MACRS, DSCR) – Excel XLSX
Excel (XLSX) + Zip archive file (ZIP)


BENEFITS OF THIS DOWNLOADABLE EXCEL DOCUMENT
- Models the US ITC and MACRS mechanics in full, including the 50% depreciable-basis reduction.
- Tracks annual DSCR alongside a three-statement build whose balance check reads zero in all ten years.
- Set the ITC rate to zero and the whole depreciation stack recomputes against full cost.
SOLAR ENERGY EXCEL DESCRIPTION
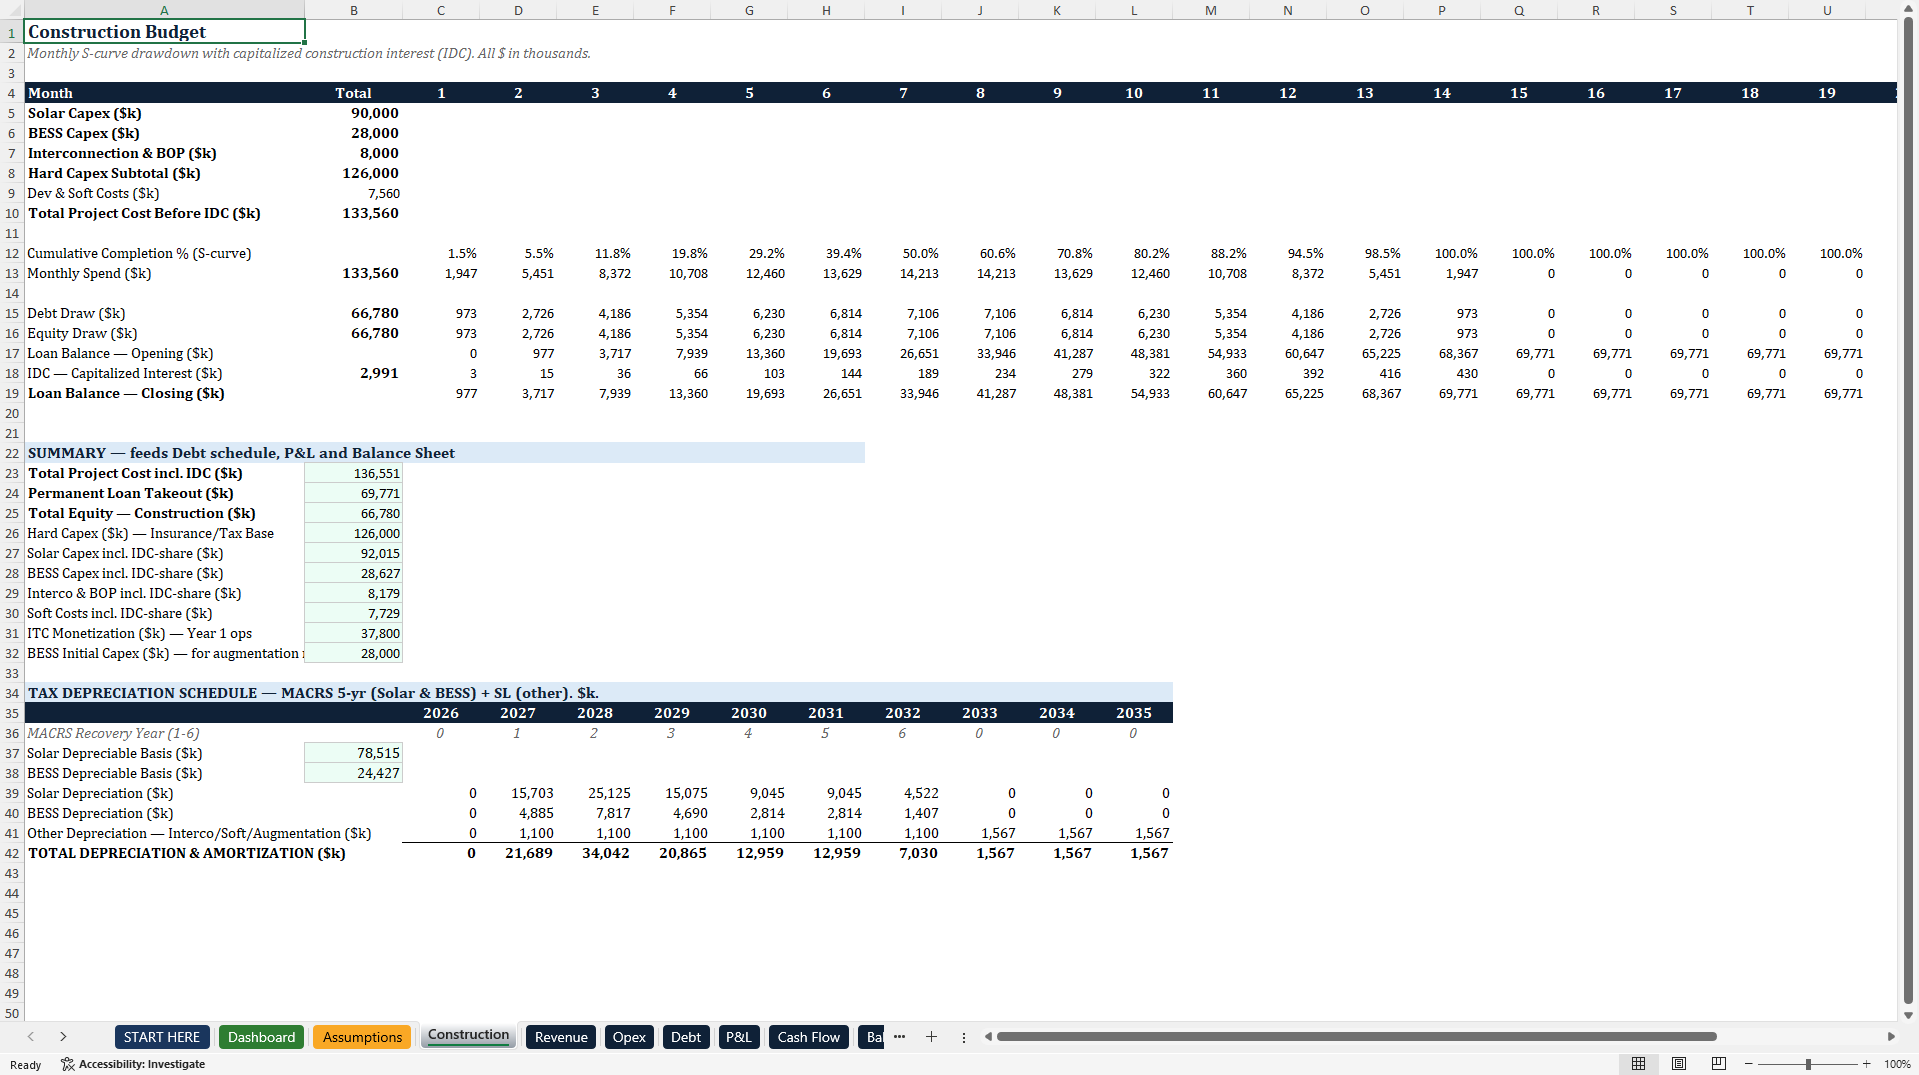
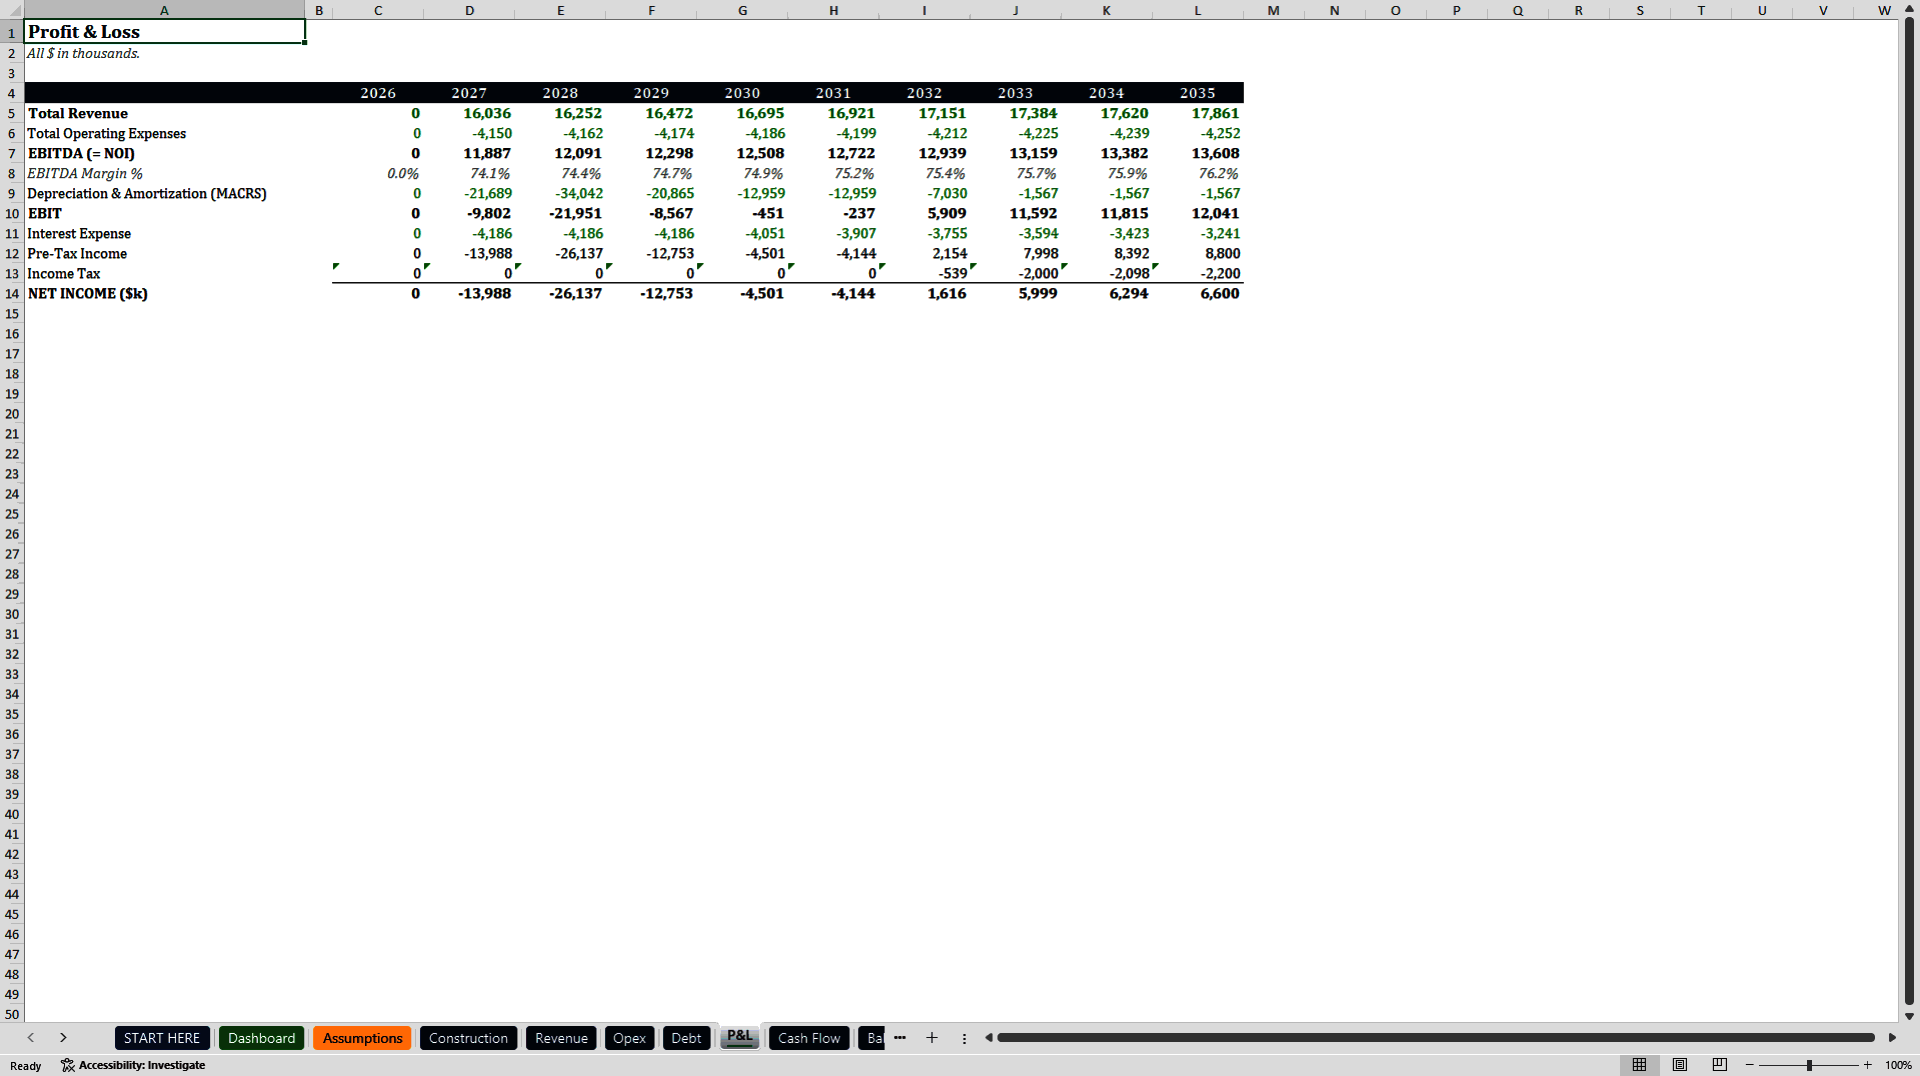
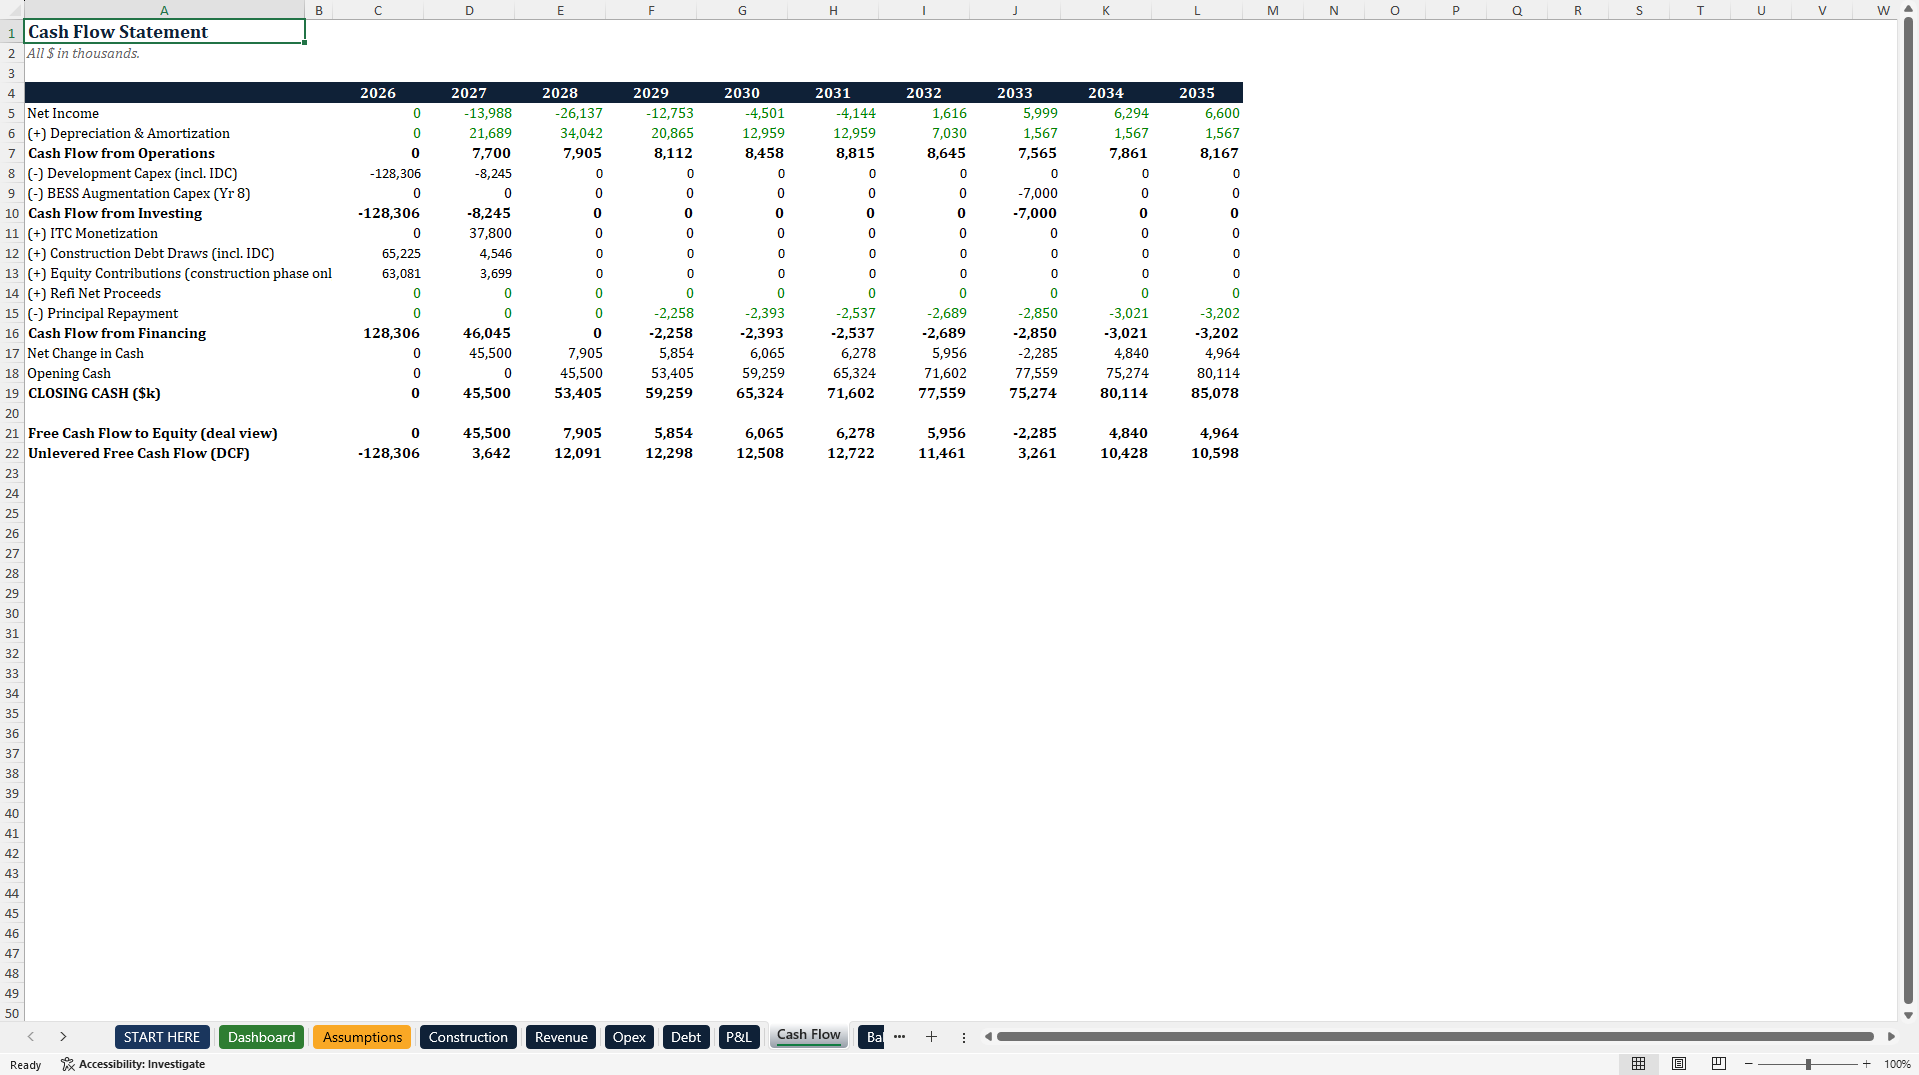
An ITC claimed on a US solar project does two things at once: it pays cash, and it shrinks the depreciable basis of the asset that generated it. This model carries both. The credit is monetized as an operating cash inflow in the first year of operations, sized at the ITC rate times hard capex. Half of it then comes out of the depreciable basis, per the US basis-reduction rule, and the remainder runs through the 5-year MACRS schedule at 20.00, 32.00, 19.20, 11.52, 11.52 and 5.76 percent (IRS Publication 946). Bonus depreciation is a separate input that takes its percentage first and sends the balance back through MACRS. The ITC rate is one cell. Set it to zero and the entire depreciation stack recomputes against full cost, which is how you price what the credit is worth to the deal.
In the demo case that gap is $13.5M on the solar alone: $92.0M of capitalized cost against $78.5M of depreciable basis. The battery drops from $28.6M to $24.4M on the same rule.
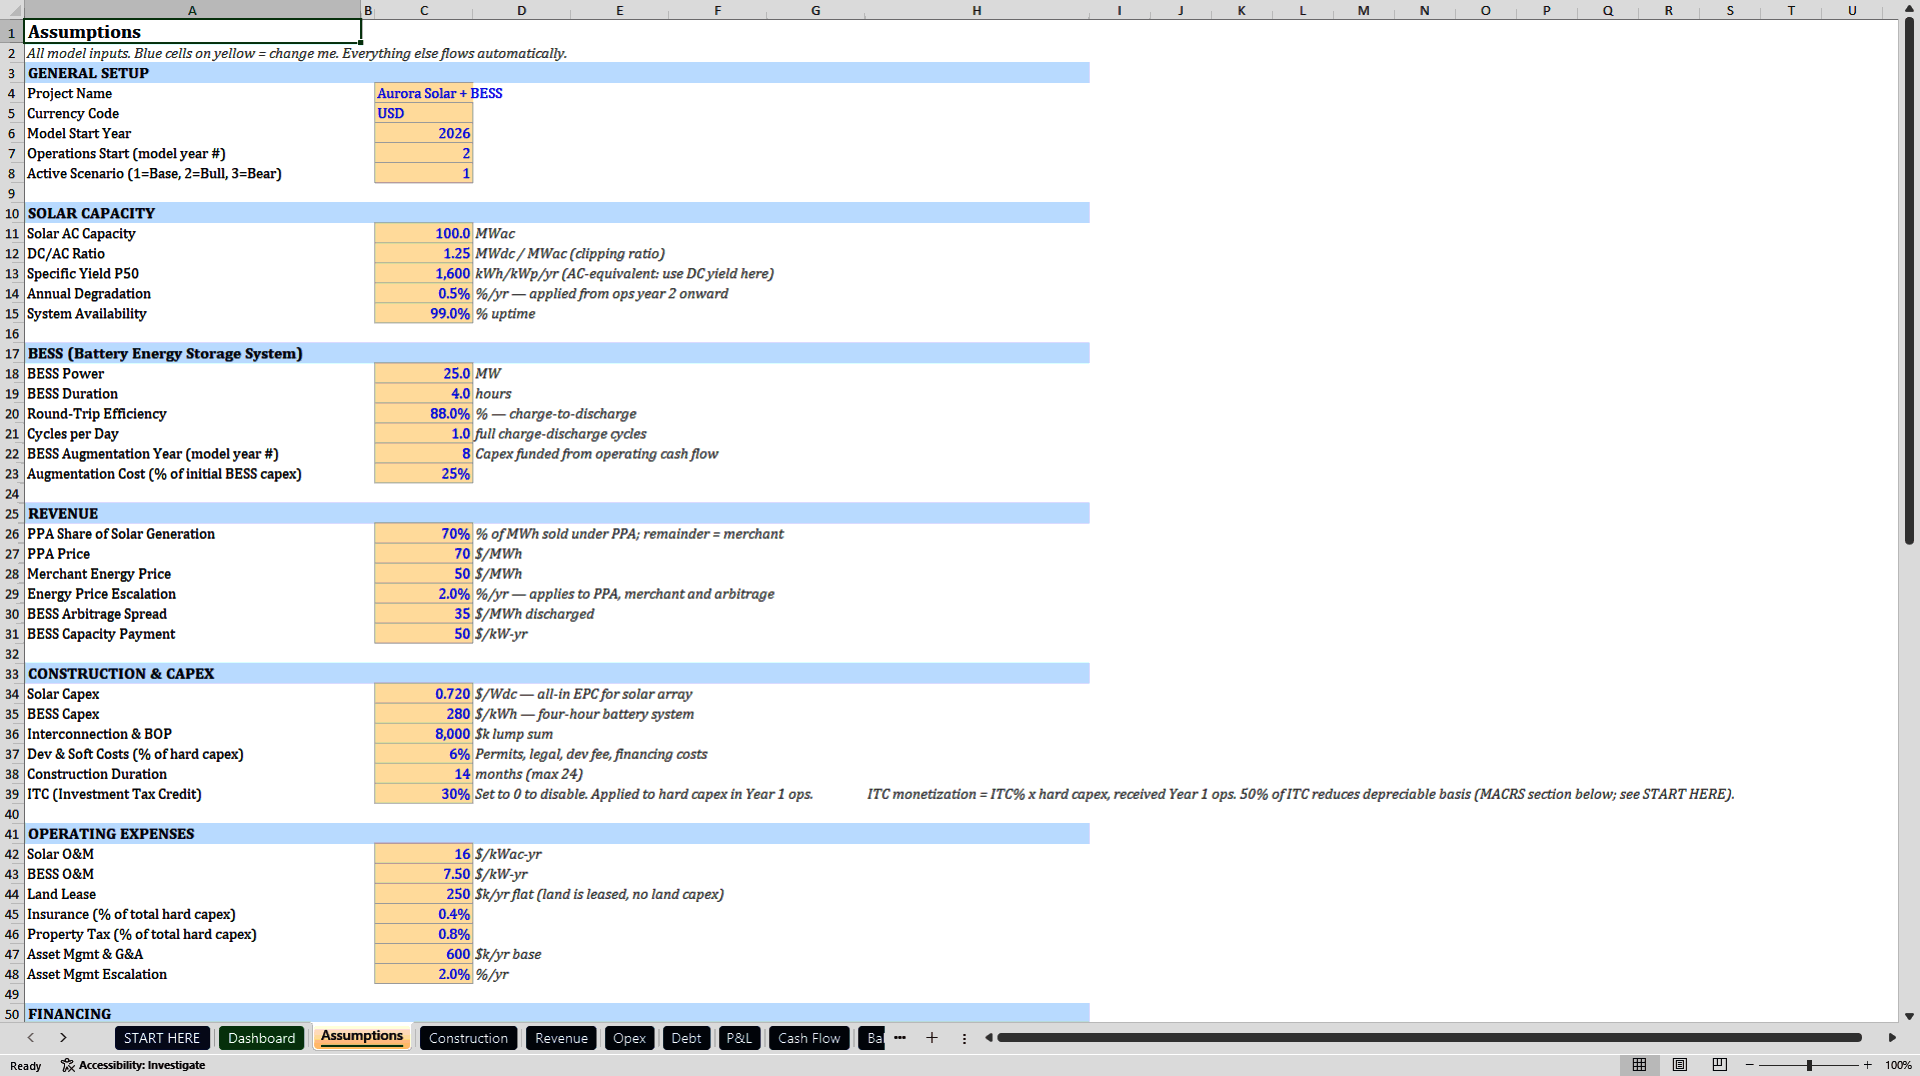
That demo case is a 100 MWac / 125 MWdc farm with a co-located 25 MW four-hour battery (100 MWh, 88% round-trip efficiency), built over 14 months and held ten years.
Hard capex $126.0M
Solar, at $0.72/Wdc $90.0M
Battery, at $280/kWh $28.0M
Interconnection & BOP $8.0M
Soft costs (6%) + capitalized IDC $10.6M
Total project cost $136.6M
ITC monetized, ops year 1 $37.8M
Equity, net of ITC $29.0M
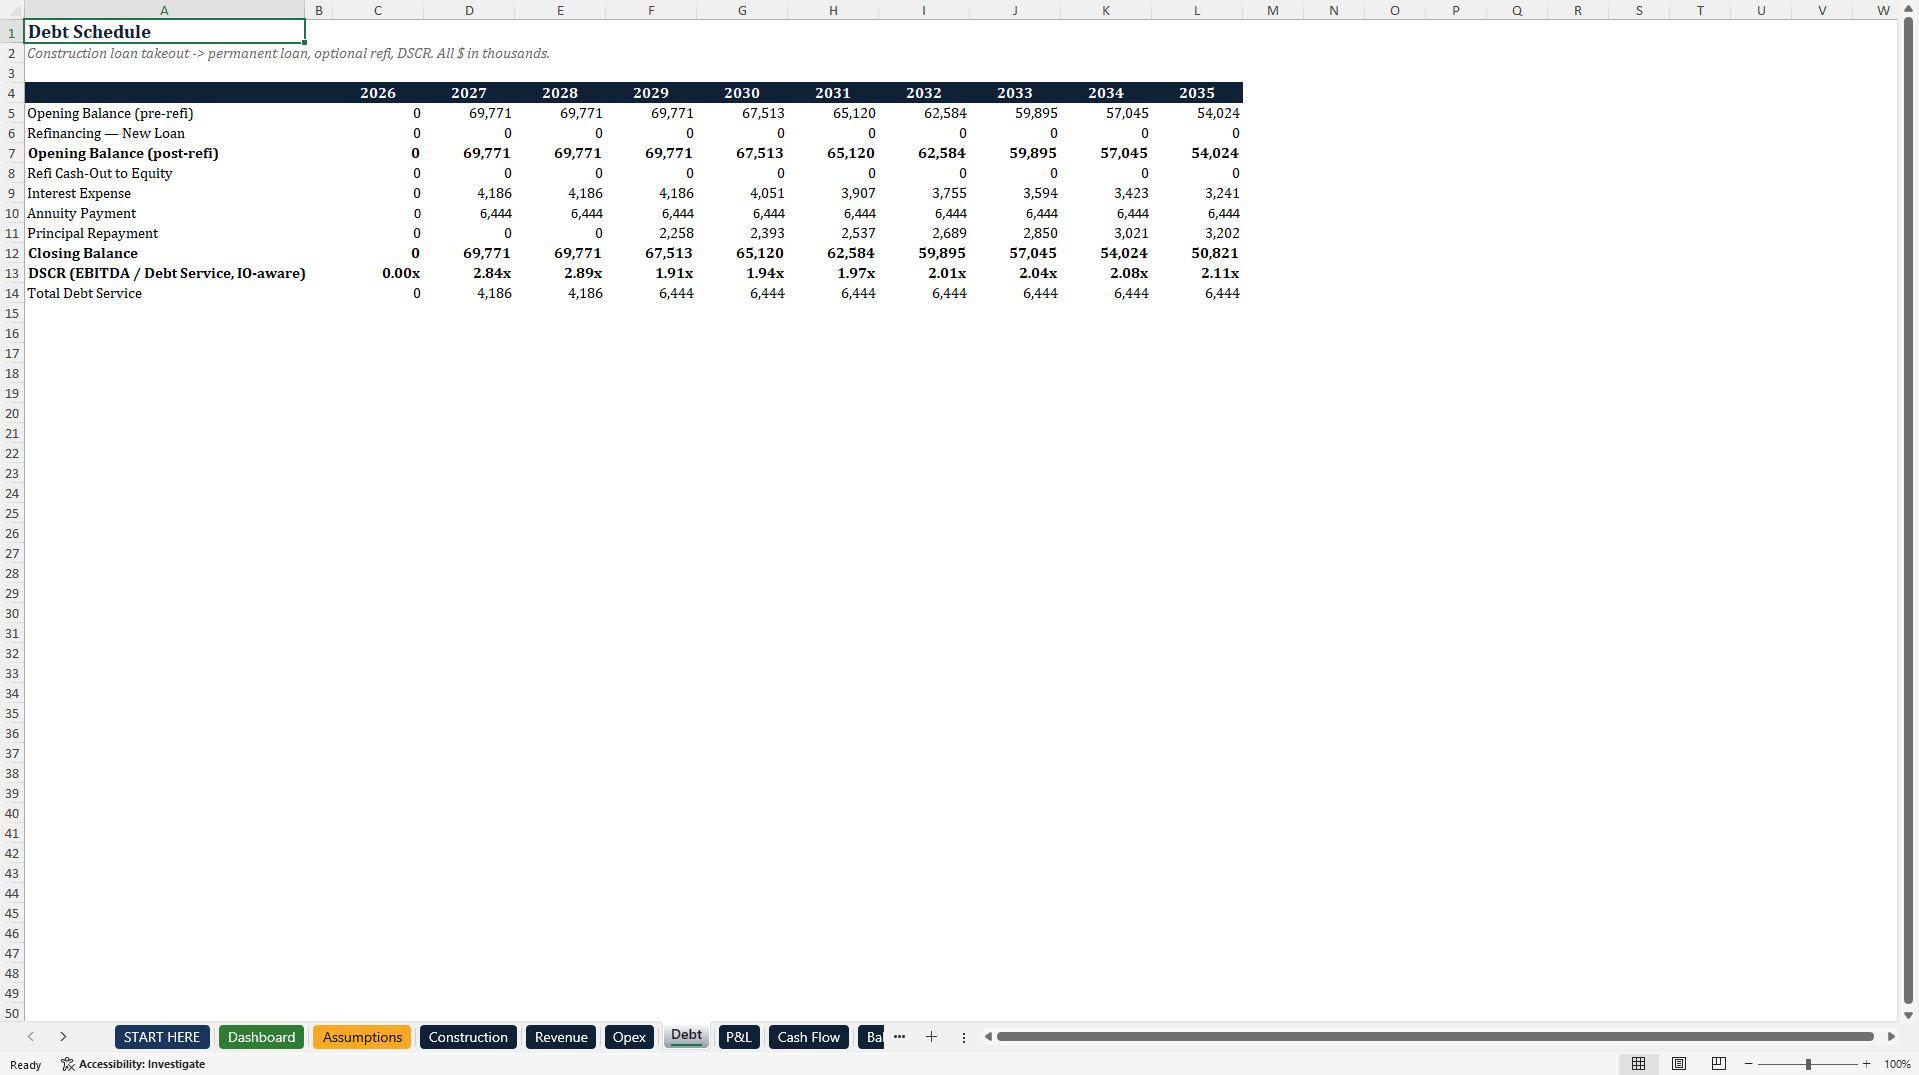
Permanent loan (6.0%, 18-yr amort) $69.8M
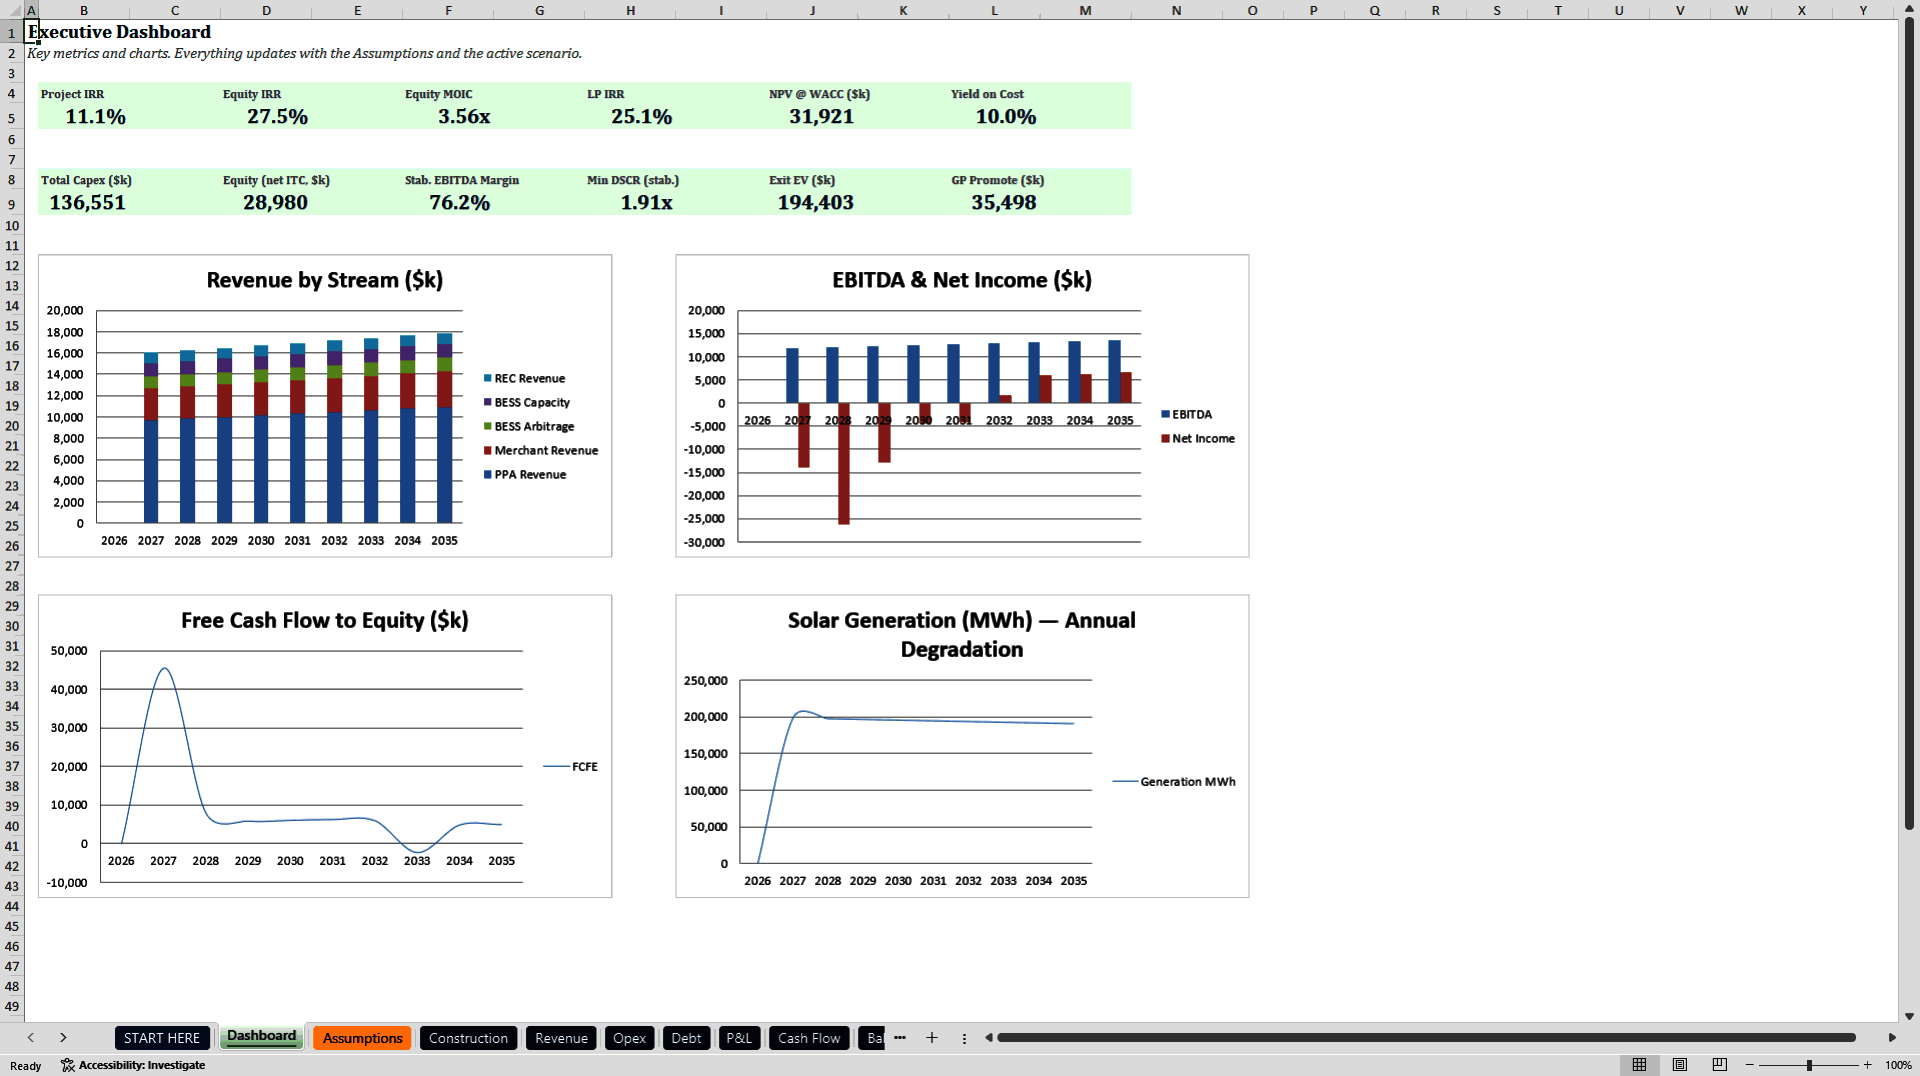
Project IRR, unlevered 11.1%
Equity IRR, levered 27.5%
LP IRR 25.1%
LP MOIC 2.99x
Minimum stabilized DSCR 1.91x
Yield on cost 9.97%
NPV at a 7.5% WACC $31.9M
Exit enterprise value $194.4M
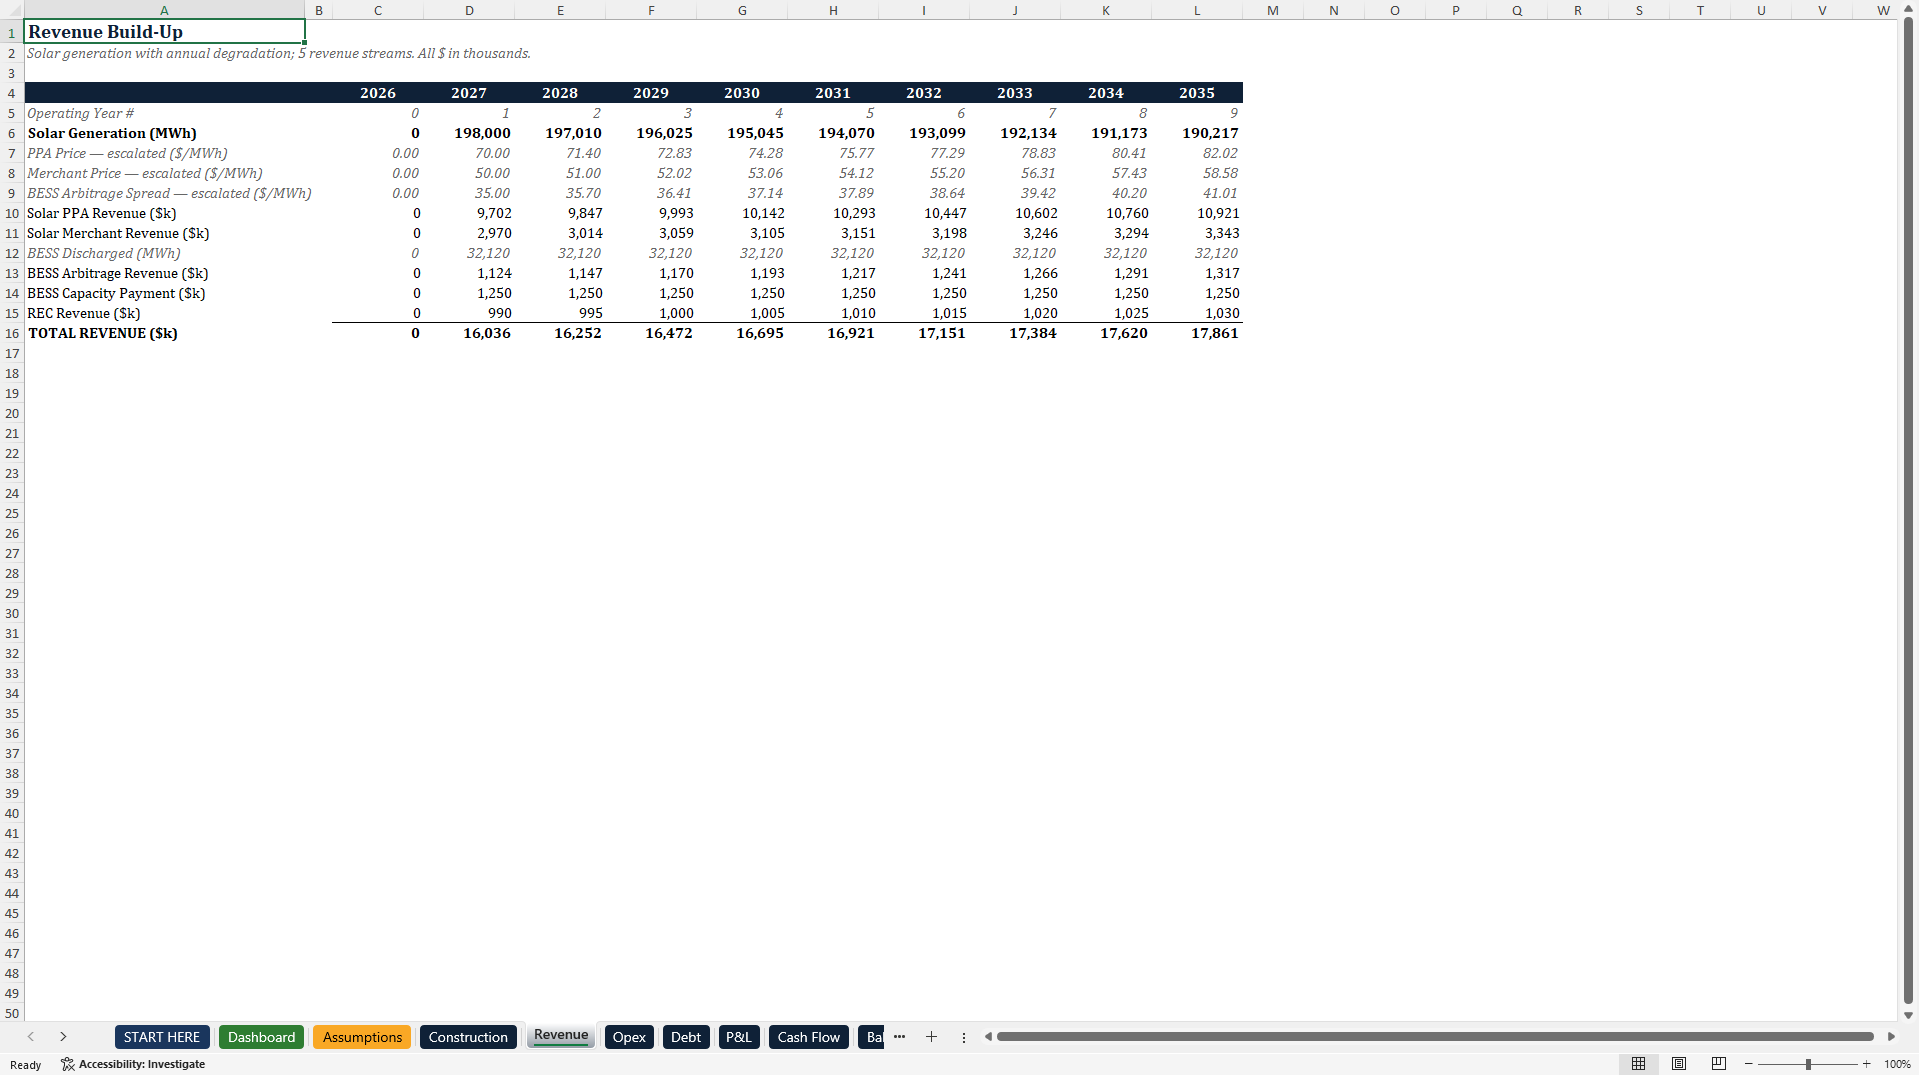
Five revenue streams run off one generation curve that degrades every year: a PPA on 70% of output, merchant sales on the rest, battery arbitrage priced per MWh discharged, a capacity payment per kW-year, and REC sales per MWh. Each stream has its own escalator. A year-8 battery augmentation at 25% of initial battery capex is funded out of operating cash flow and depreciated straight-line over 15 years.
Construction draws on a monthly S-curve with interest capitalized into the loan balance. The construction facility takes out into a permanent loan with an interest-only period and an optional refinance, and DSCR is tracked against the covenant every year. All of it feeds a three-statement build whose balance check reads zero in all ten years. Under that sit a GP/LP waterfall with a compounding preferred return and two IRR-based promote tiers, an unlevered DCF with a choice of cap-rate or EV/EBITDA exit, and two sensitivity grids driven by live formulas instead of data tables.
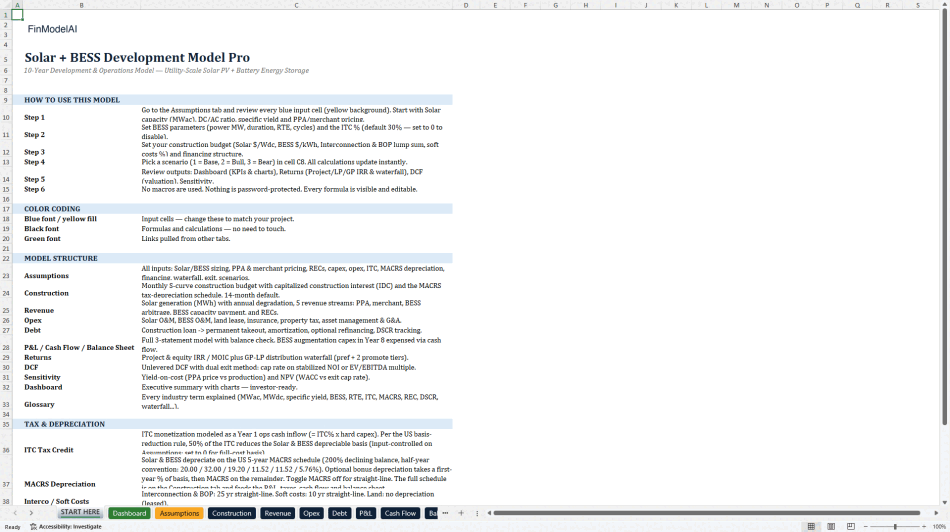
Fourteen tabs, in order: START HERE, Dashboard, Assumptions, Construction, Revenue, Opex, Debt, P&L, Cash Flow, Balance Sheet, Returns, DCF, Sensitivity, Glossary. All 1,501 formulas are visible and unlocked. The heaviest tabs are Returns at 260 and Construction at 250.
Written for developers, IPP analysts and lenders underwriting a US utility-scale solar-plus-storage asset, and for anyone who has to defend an after-tax IRR in front of an investment committee.
What it does not do. There is no tax-equity partnership flip, no HLBV allocation and no PTC election: the ITC is a direct cash inflow to the project. Battery dispatch is an annual spread on MWh discharged, not an 8760-hour optimization. Debt is sized as a percentage of project cost rather than sculpted to a target DSCR. The horizon is ten years, not a full 25- or 35-year asset life. Sensitivity Table 1 is a linearized decomposition around exit-year economics, which the tab states on its face; Table 2 recomputes NPV in full. Nothing connects to a live data feed.
You get the workbook (.xlsx, no macros, no circular references, no password protection) and a quick-start guide covering every input block, the ITC and MACRS mechanics, and how to read the Dashboard and the two grids. The demo case above is populated on open, so every formula is auditable before you change anything. Blue cells are inputs, black is calculation, green is a cross-tab link. Excel for Windows and Mac; Google Sheets renders XIRR and some charts differently.
License: single user.
Got a question about the product? Email us at support@flevy.com or ask the author directly by using the "Ask the Author a Question" form. If you cannot view the preview above this document description, go here to view the large preview instead.
Source: Best Practices in Solar Energy, Integrated Financial Model Excel: Solar + BESS Project Finance Model (ITC, MACRS, DSCR) Excel (XLSX) Spreadsheet, FinModelAI




























