
Software Development Company Advanced Financial Model – Excel XLSX
Excel (XLSX)
BENEFITS OF THIS DOWNLOADABLE EXCEL DOCUMENT
- Provides a fully integrated 10-year financial model built specifically for software development companies.
- Delivers institutional-grade MRR, ARR, and unit economics modeling across 20 fully linked tabs.
- Enables founders, CFOs, and analysts to model, pitch, and exit a software business with complete financial confidence.
SOFTWARE EXCEL DESCRIPTION
Curated by McKinsey-trained Executives
🚀 Software Development Company Financial Model | Integrated 3-Statement 10-Year Forecast
Turn your software development business into a fundable, investable, pitch-ready enterprise – modeled with institutional-grade precision used by the world's leading SaaS platforms, enterprise software companies, and venture-backed technology firms.
Whether you're a SaaS founder raising your Series A or Series B, a private equity firm evaluating a software acquisition, a CFO stress-testing your runway and burn rate, an investment banker running a software sector M&A process, or a venture capital analyst benchmarking unit economics against portfolio norms – this fully integrated 3-Statement Financial Model gives you the exact financial infrastructure to plan, pitch, fund, scale, and exit with complete confidence.
💡 What's Inside
This model covers every financial dimension of building and scaling a software development business – from your founding metrics through a 10-year path to ARR maturity, contract backlog depth, or full exit. Built on Financial Modeling World Cup best practices, it's fully dynamic, cross-linked across 20 tabs, and ready to customize for your specific subscription tiers, revenue mix, customer cohort structure, and SaaS unit economics profile.
📥 Inputs
• 🎯 Multi-Stream Revenue Engine – Separate modeling for Subscription Revenue (Basic, Professional, and Enterprise tiers), License Revenue (perpetual and term), Usage-Based Revenue (API calls, compute, storage), and Professional Services Revenue (implementation, integration, training, consulting) – each with individual base year inputs, annual growth rates, and gross margin assumptions – plus a fully independent pricing model with seat-based and usage-based mechanics – every revenue dollar traced to its operational root cause, fully adjustable from a single Assumptions tab
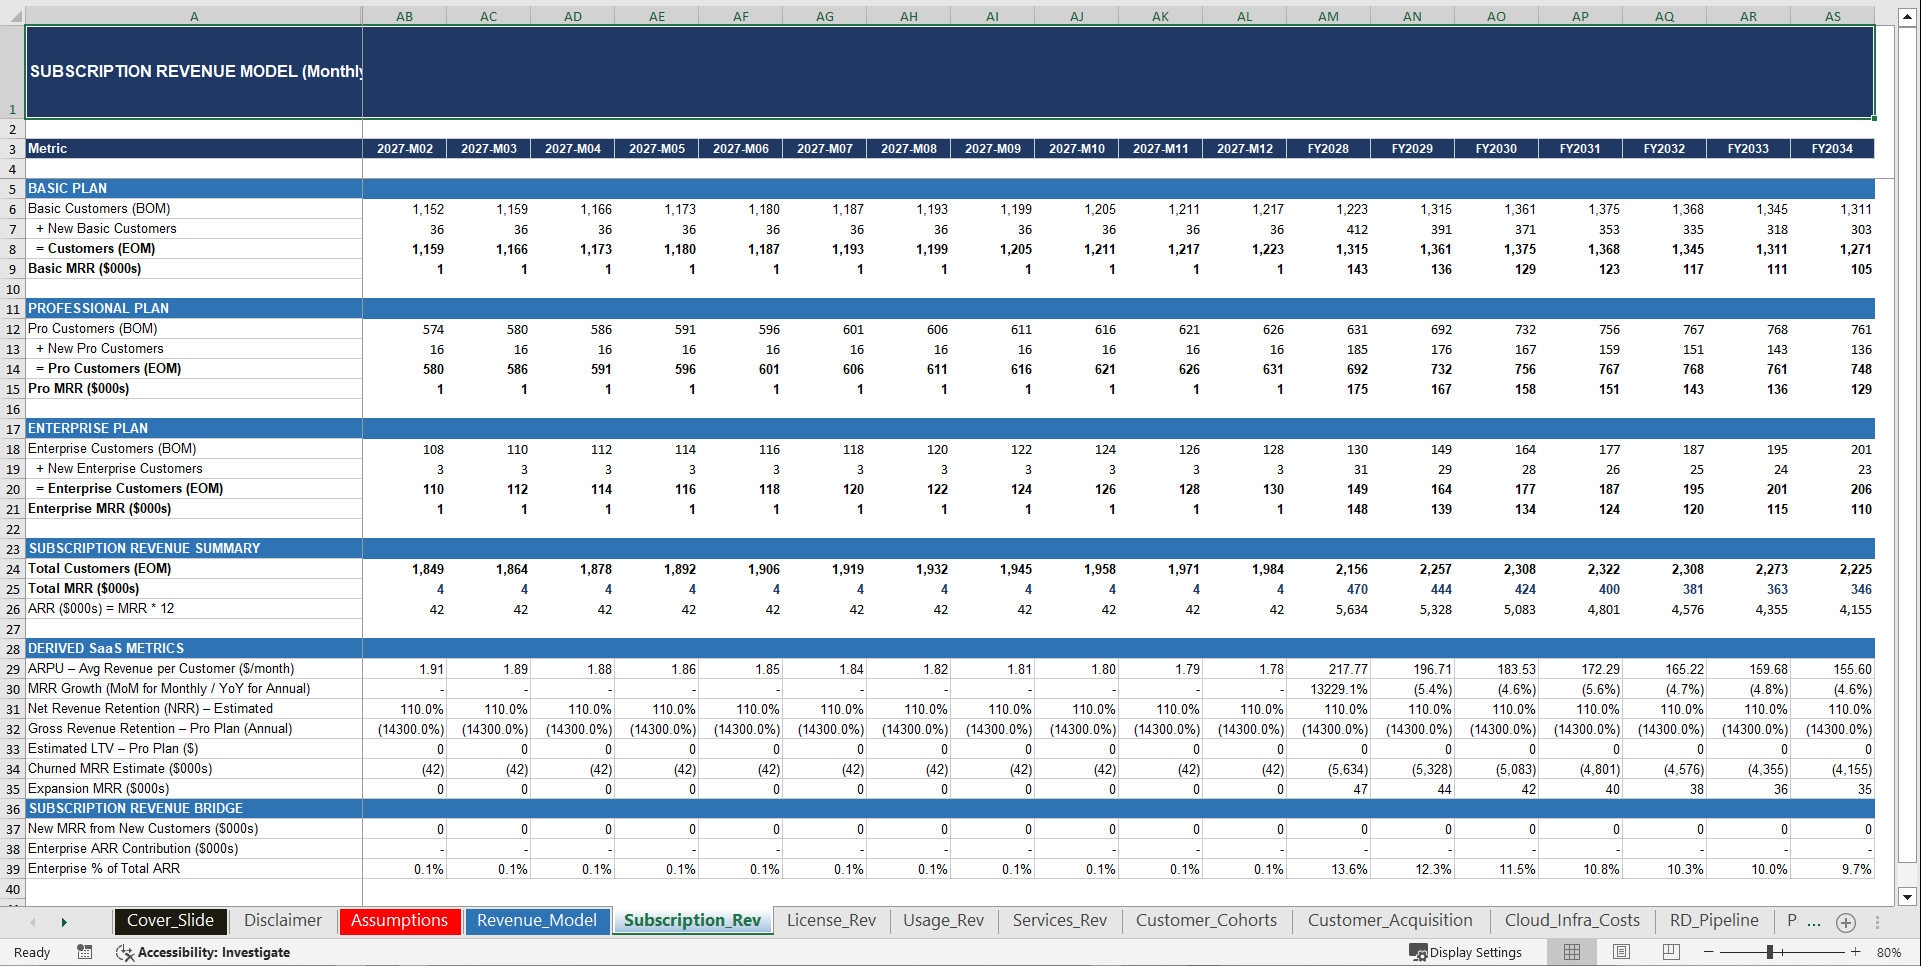
• 📊 MRR / ARR Waterfall & Cohort Engine – Monthly Recurring Revenue and Annual Recurring Revenue modeled from first principles across all three subscription tiers – with customer BOM counts, net new customer additions, EOM customer totals, monthly churn applied per tier, and expansion MRR layered on top – plus a full ARR bridge showing new ARR, churned ARR, and expansion ARR – Book-of-Business roll-forward tracking opening ARR, new bookings, churn, net expansion, and closing ARR for every period across all 36 monthly and 7 annual periods
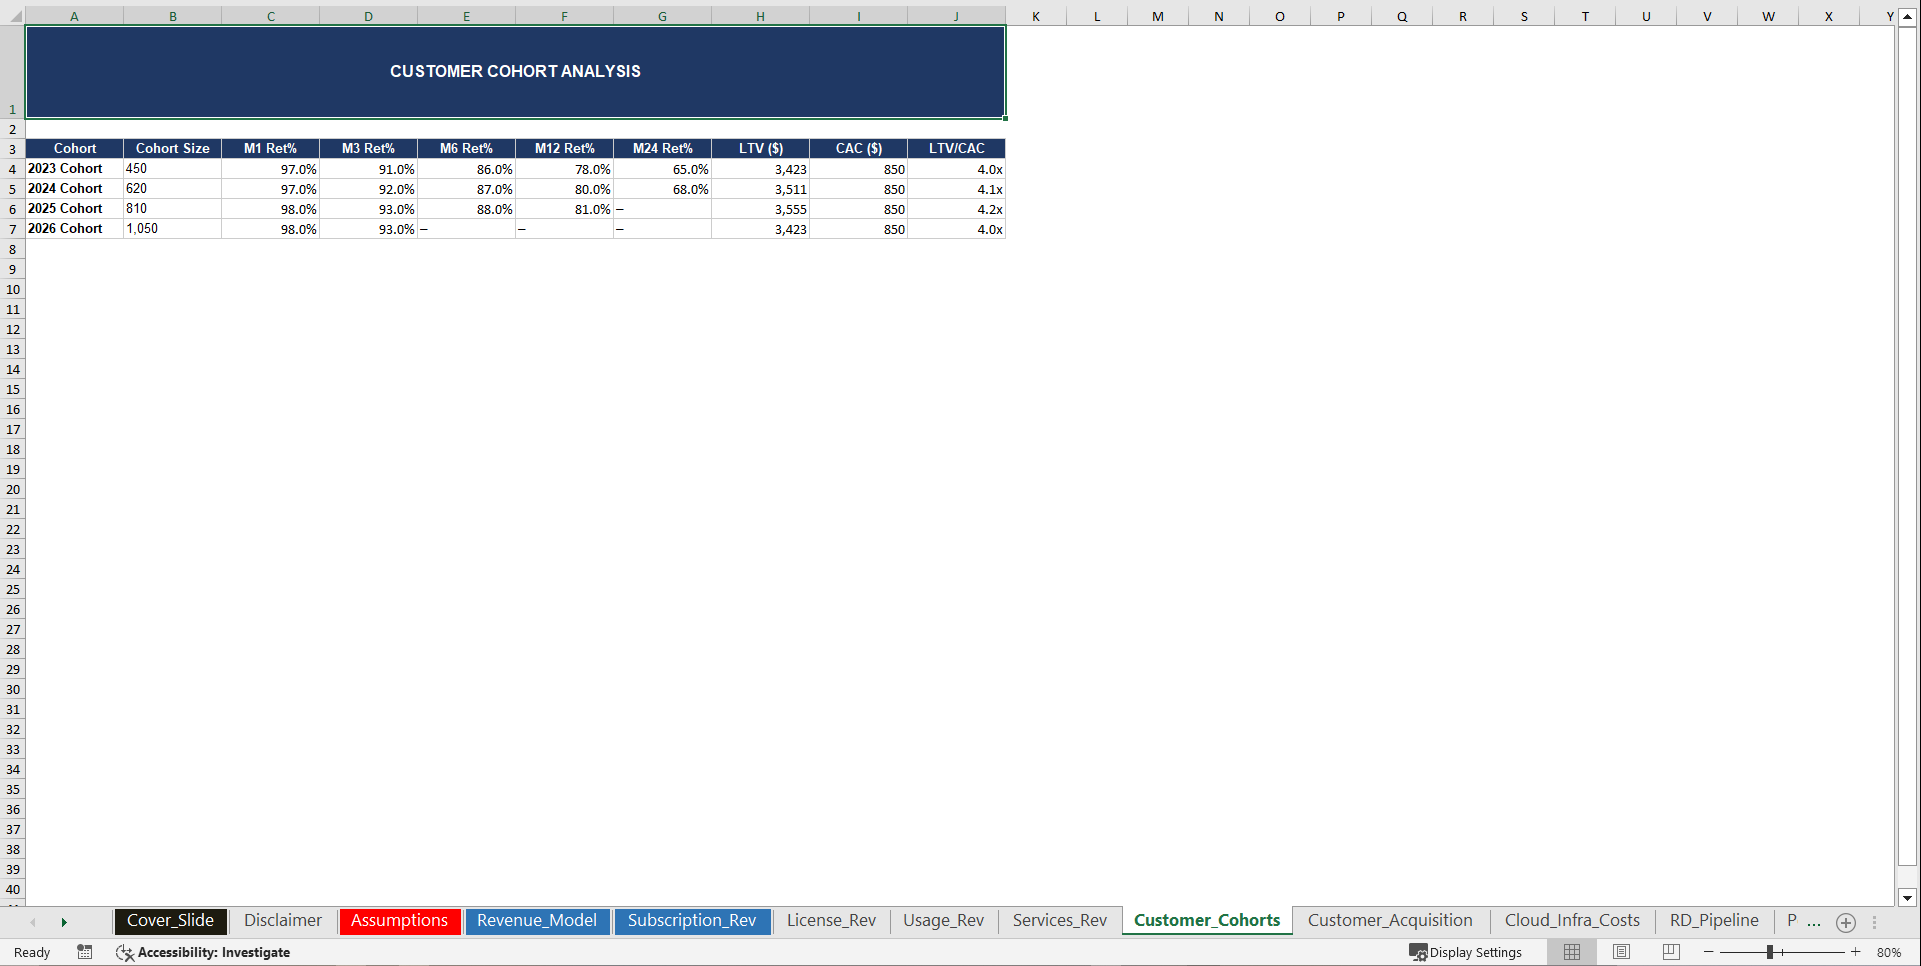
• 👥 Customer Cohort Model with Retention Analytics – Individual cohort sizing tracked from acquisition year through multi-year retention curves – M1, M3, M6, M12, and M24 retention rates populated per cohort – LTV per cohort calculated against blended ARPU and churn – LTV / CAC ratio computed and benchmarked – the exact retention intelligence every SaaS investor, growth equity buyer, and recurring revenue lender interrogates on page one of their diligence checklist
• 🔩 5-Component Cost of Revenue Engine – Cloud Infrastructure broken into Compute, Storage & CDN, Third-Party APIs, Monitoring & DevOps Tools, and Security & Compliance – Customer Support Costs – Third-Party Services – each with individual inflation rates and revenue-proportional scaling – plus Supply Chain and vendor concentration risk overlays activatable by scenario toggle – every cost component individually modeled and reconciled back to Gross Profit
• 🔬 R&D Pipeline with Program Registry – Total R&D spend driven as a percentage of revenue with a Capitalized Development Cost vs. Expensed R&D split governed by ASC 350 mechanics – broken across Platform Core Maintenance, New Feature Development, AI/ML & Data Platform, Security & Compliance, and Technical Debt – with capitalization rate, amortization schedule, and useful life all configurable from the Assumptions tab – IRAD-equivalent internal investment tracked separately from government or grant-funded development where applicable
• 👤 Personnel Plan with Full Compensation Stack – Engineering, Sales, Marketing, Customer Success, and G&A departments each with individual Year 1 headcount, annual growth rates, and average base salary – compounding annually at a configurable raise rate – plus Benefits & Health Insurance, Payroll Taxes, Retirement contributions, Bonus & Incentive Pay, and Stock-Based Compensation loaded on top as individual line items – total compensation, total headcount, revenue per employee, and average cost per employee tracked across all 10 years
• 🏗️ 3-Category CapEx with Sub-Line Detail – Technology Infrastructure CapEx covering servers, development infrastructure, and hardware – Office & Facilities CapEx covering buildout and equipment – Other CapEx for miscellaneous capital items – with a full PP&E roll-forward tracking gross PP&E, annual additions, asset disposals, accumulated depreciation, and net PP&E – plus a separate Capitalized Software Development schedule with its own amortization roll governed by useful life assumption
• 🏦 Debt & Financing Structure – Venture Debt and Term Loan modeled separately with individual interest rates, scheduled principal amortization, and configurable maturity – plus Equity Financing rounds with configurable raise amounts – total debt roll-forward, closing balances, total interest expense, Net Debt / EBITDA leverage ratio, and Interest Coverage Ratio calculated for every year of the forecast
• 📦 Deferred Revenue & Working Capital Model – Accounts Receivable sized by configurable DSO – Deferred Revenue sized by average prepaid subscription months with full roll-forward – Accounts Payable sized by configurable DPO – Prepaid & Other Current Assets – Accrued Expenses – Net Working Capital and Change in NWC fully linked into the Cash Flow Statement – the exact working capital mechanics that distinguish a SaaS model from a generic software spreadsheet
• 📊 4-Table Sensitivity & Scenario Engine – Year-5 Revenue sensitivity matrix across Churn Rate vs. Customer Growth Deceleration – EBITDA Margin matrix across Gross Margin vs. S&M Spend as % of Revenue – a full 10-year scenario comparison table across Base Case / High Growth SaaS / Churn Spike / Marketing Efficiency Decline / Recession / Rapid Product Adoption – plus a Net Income sensitivity table across Interest Rate and Debt Level – giving you instant scenario answers across 4 independent risk dimensions without touching a single formula
📤 Outputs
• 📈 10-Year Fully Integrated 3-Statement Financial Model – Income Statement, Balance Sheet, and Cash Flow Statement fully cross-linked and auto-balancing across 36 monthly periods (Years 1–3) and 7 annual periods (Years 4–10) – every line item formula-driven, zero hardcoded numbers outside the Assumptions tab
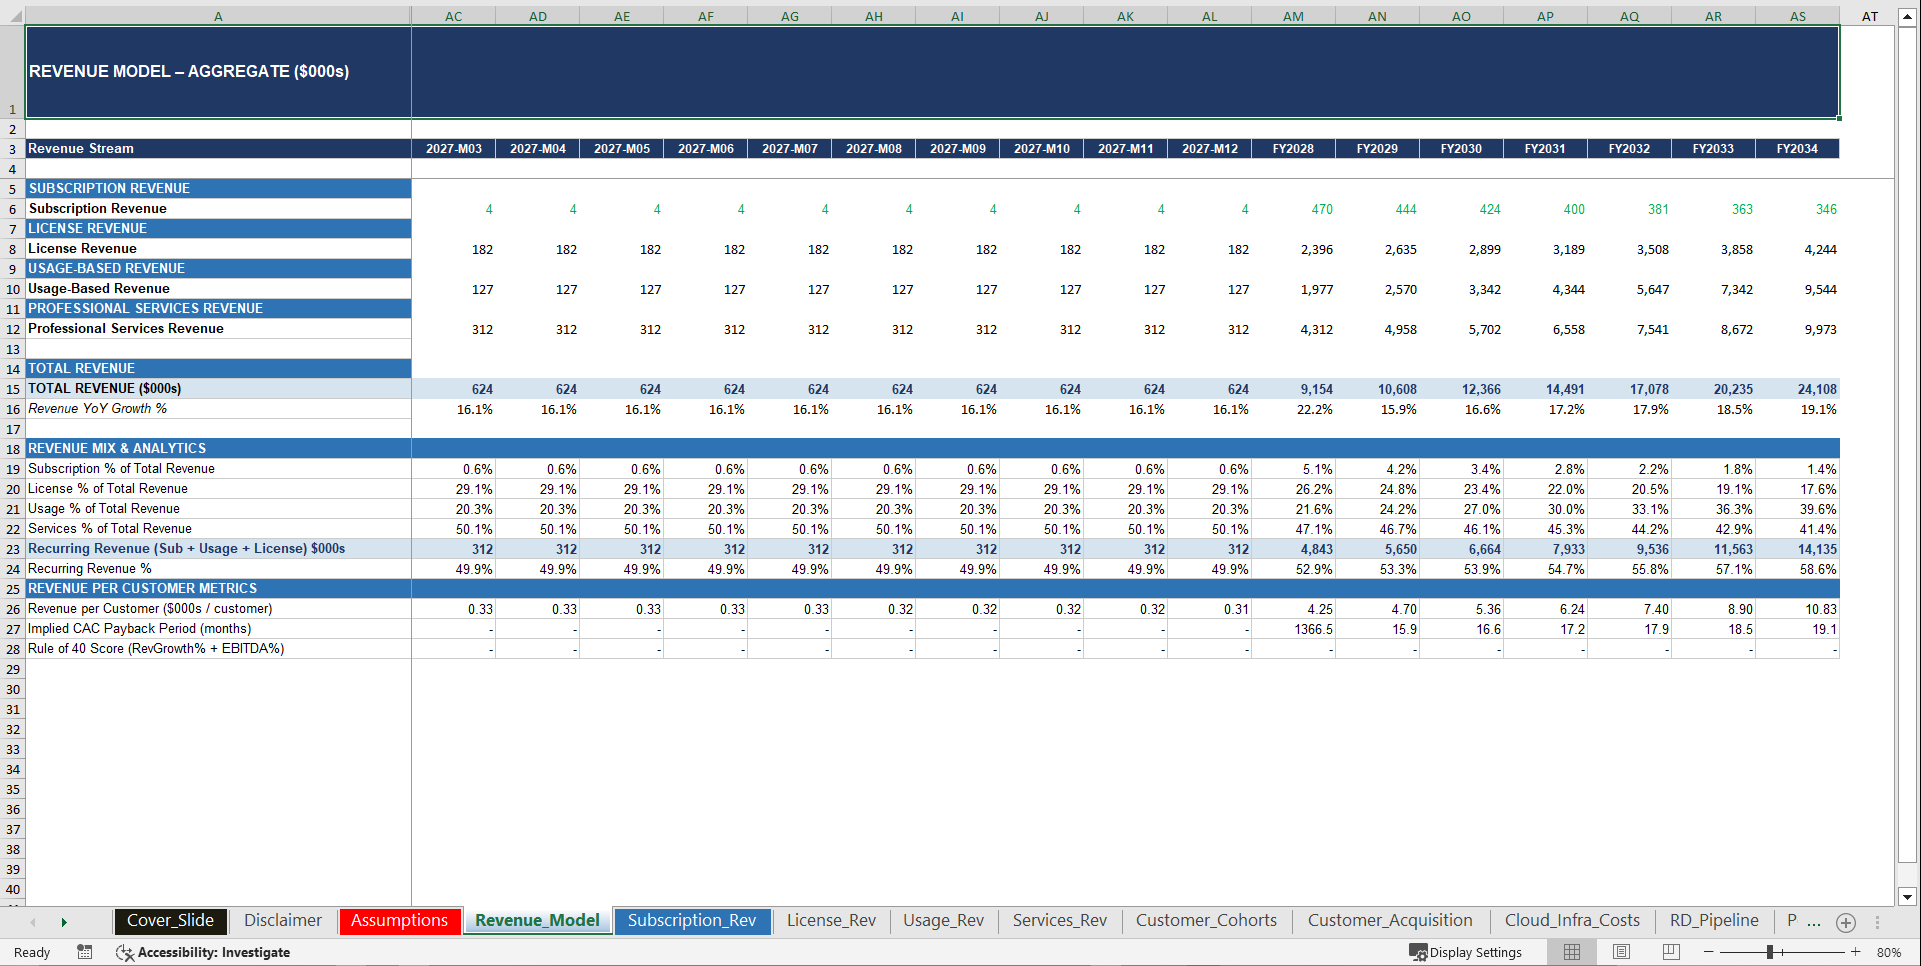
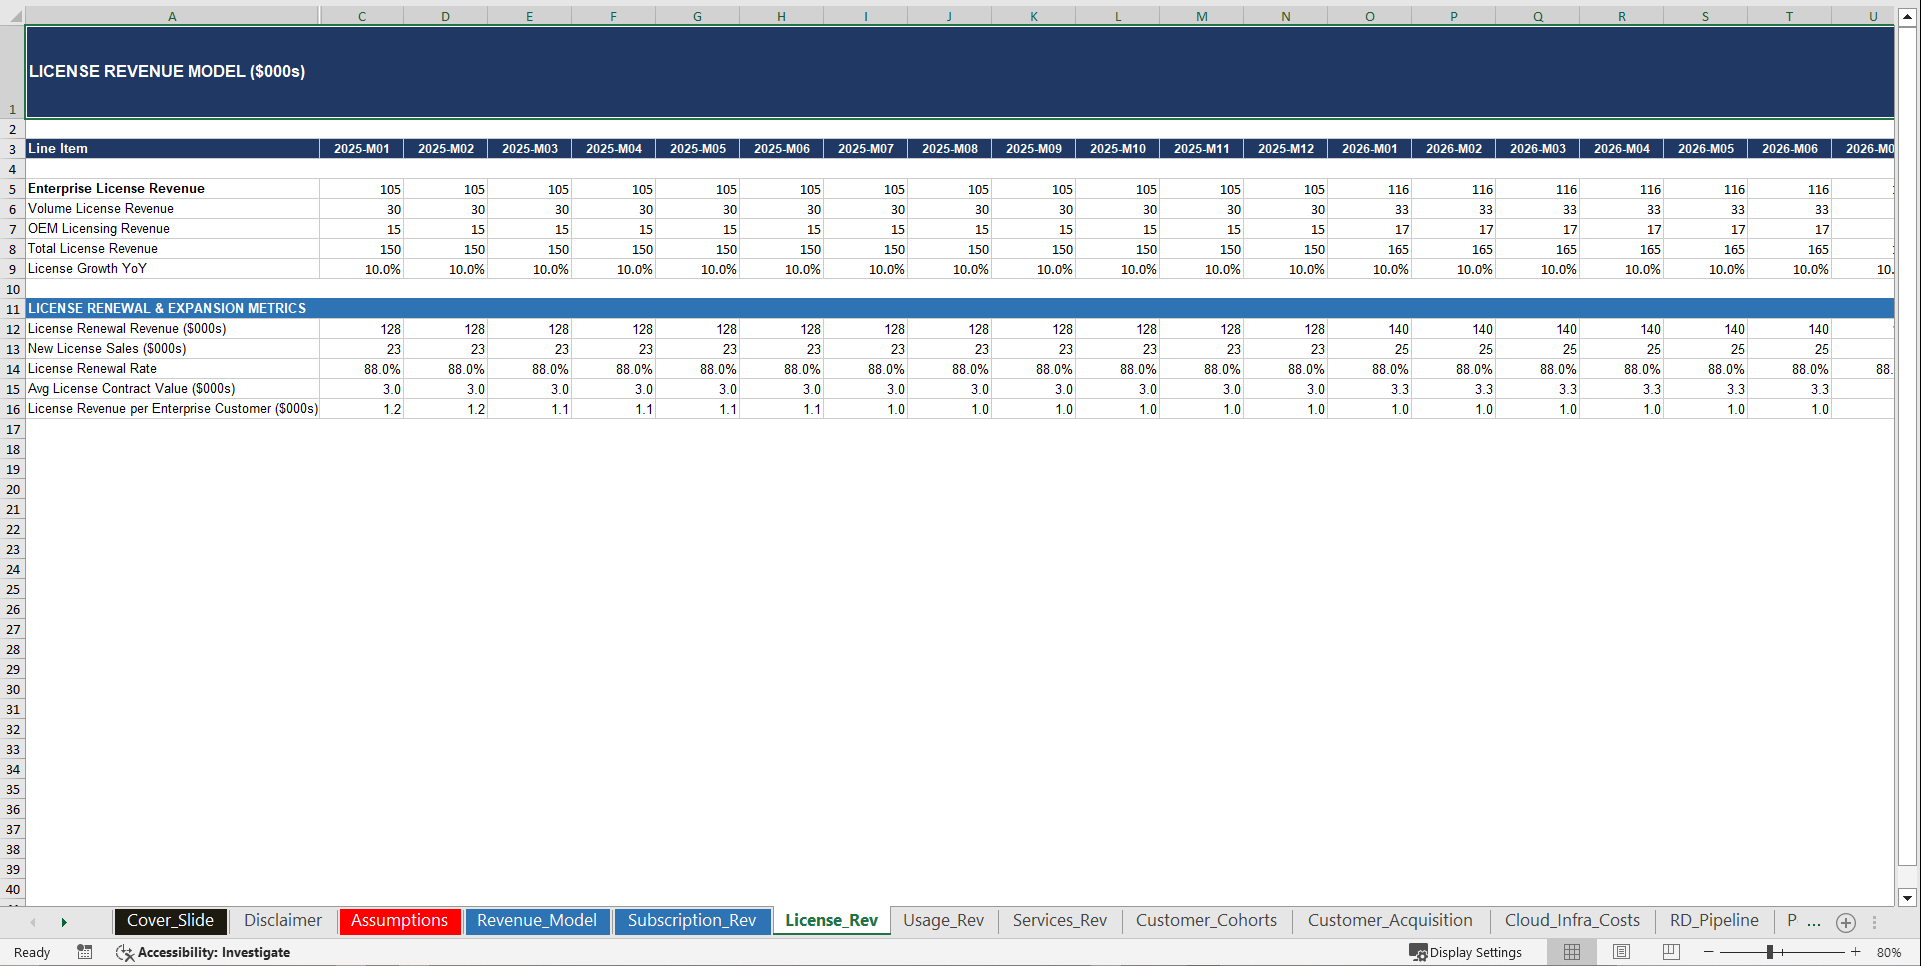
• 🎯 4-Stream Revenue Waterfall with Sub-Line Transparency – Annual and monthly projections for Subscription Revenue (3 pricing tiers), License Revenue (enterprise, volume, OEM), Usage-Based Revenue (API, compute, storage), and Professional Services Revenue (implementation, training, consulting, integration) – with year-over-year growth rates, revenue mix percentages, blended gross margin by stream, and full ARR / MRR visibility across all 10 years
• 📋 MRR / ARR Intelligence Dashboard – Basic, Pro, and Enterprise MRR tracked individually from customer counts through pricing to monthly revenue – total MRR, ARR, ARPU, MoM MRR growth, Net Revenue Retention, Gross Revenue Retention, expansion MRR, and churned MRR computed for every period – the exact SaaS metrics every recurring revenue lender, growth equity firm, and strategic acquirer interrogates on page one of their due diligence checklist
• 🔩 Cost of Revenue Waterfall – Cloud Infrastructure broken to sub-component level, Support Costs, Third-Party Services – total COGS reconciled back to Gross Profit with blended Gross Margin % for every period – with infrastructure cost per customer, infra cost as % of revenue, and YoY infra cost growth tracked as efficiency metrics
• 🔬 R&D Investment & Pipeline Tracker – Capitalized vs. Expensed R&D split annually, R&D spend as % of revenue benchmarked against SaaS industry norms, 5 program category breakdowns by workstream allocation, engineering productivity metrics including revenue per engineer – fully flowing into the Income Statement and Balance Sheet with zero reconciliation required
• 🏭 SaaS Unit Economics Dashboard – Customer Acquisition Cost (CAC), Customer Lifetime Value (LTV), LTV / CAC ratio, CAC Payback Period in months, blended ARPU, cohort-level retention curves, and Rule of 40 Score (Revenue Growth % + EBITDA Margin %) computed for every period – so every efficiency gain in your go-to-market engine is visible, defensible, and benchmarkable against public SaaS comps
• 💼 Personnel Cost Schedule – Engineering, Sales, Marketing, Customer Success, and G&A with individual headcount and salary inputs, full compensation stack with benefits and SBC compounding annually, total headcount by year, total compensation cost, revenue per employee, and average compensation per employee – fully flowing into the Income Statement as a transparent, auditable operating expense
• 🏛️ CapEx & PP&E Schedule – 3-category CapEx each with sub-line detail, total CapEx and CapEx as % of revenue for every year, gross PP&E, annual additions, asset disposals, accumulated depreciation, and Net PP&E – plus a separate Capitalized Software Development schedule with amortization tracking – D&A flowing directly into the Income Statement and Cash Flow Statement with zero manual reconciliation
• 📦 Deferred Revenue & Working Capital Schedules – Deferred Revenue roll-forward sized by prepaid subscription behavior – Accounts Receivable sized by DSO – Accounts Payable sized by DPO – Accrued Expenses – Net Working Capital and Change in NWC fully linked to the Cash Flow Statement – Current Ratio, Quick Ratio, Cash Ratio, Debt-to-Equity, Return on Assets, and Return on Equity tracked annually
• 🔄 Cash Flow Statement – Full Indirect Method – Net Income, D&A add-back, Capitalized Software amortization, individual working capital movement lines, CapEx by category, Capitalized Development Costs, debt repayment, equity financing – Free Cash Flow, FCF Margin %, Operating Cash Flow Margin, and Cash Conversion Ratio calculated and tracked for every period
• 📐 Executive Dashboard with 4 Live Charts & 8 KPI Cards – Annual Revenue & Subscription Revenue bar chart, EBITDA & Net Income trend line, Gross Margin & EBITDA Margin trend, and Total Customer Count growth line – plus 8 live KPI cards covering Total Revenue, ARR, Total Customers, Gross Margin %, EBITDA Margin %, Net Income, Cash Balance, and Monthly Churn Rate – all auto-updating from a single Assumptions tab
🏆 Why This Model Stands Out
✅ Fully integrated – every sheet talks to every other sheet. Change one assumption and 12,500+ formulas update instantly across all 20 tabs – no broken links, no manual reconciliation, no version control nightmares
✅ Investor and lender-ready – structured and formatted to answer the exact questions SaaS investors, recurring revenue lenders, growth equity buyers, and M&A acquirers ask on day one: What is ARR? What is NRR? What is CAC payback? What is the Rule of 40 score? When does the company FCF-positive? What is the IRR at a 10× revenue exit?
✅ SaaS industry realistic – built around how software businesses actually generate and protect revenue: MRR compounding through net new customer additions offset by tiered churn, gross margin expanding as infrastructure costs scale sub-linearly, S&M efficiency improving as brand and inbound mature, deferred revenue building as annual contract penetration grows – not generic manufacturing assumptions recycled into a software template
✅ Institutional color-coding throughout – blue inputs, black formulas, green cross-sheet links, yellow flagged assumptions – Financial Modeling World Cup color conventions used throughout, so any investor, lender, operator, or acquirer can open it and immediately understand the logic, trace every number to its source, and audit every formula without a guide
✅ Monthly and annual periods in a single model – Years 1–3 modeled at monthly granularity for operational precision, Years 4–10 at annual granularity for strategic planning – giving you the investor-grade detail required for early-stage fundraising and the long-range visibility required for growth equity and M&A processes in a single unified workbook
✅ Fully unlocked – no protected sheets, no black-box formulas, no hidden logic. Every assumption is visible. Every formula is auditable. Own it, customize it, present it to any SaaS investor, venture lender, strategic acquirer, or debt refinancing committee with complete confidence
📋 Model Structure – 20 Sheets
• Executive Dashboard – 4 live charts + 8 KPI summary cards covering all key revenue, margin, customer, and cash metrics, auto-updating from a single Assumptions tab
• Assumptions – Every input centralized: 50+ individually configurable drivers covering all 4 revenue streams, pricing tiers, churn by tier, COGM structure, R&D split, SG&A percentages, 3-category CapEx, working capital days, debt terms, tax rate, and 6-scenario toggles – all blue-coded for instant editing
• Revenue Model – All 4 revenue streams with full sub-product line detail formula-driven from operational assumptions, blended gross margin by stream, revenue mix %, recurring revenue %, YoY growth, and Rule of 40 Score – building up to Total Revenue for every monthly and annual period
• Subscription Revenue – Full MRR/ARR waterfall by tier (Basic, Pro, Enterprise) with customer BOM, net new adds, churn applied, EOM customers, MRR, ARR, ARPU, NRR, expansion MRR, churned MRR, and LTV – 36 monthly + 7 annual periods fully formula-driven
• License Revenue – Enterprise, volume, and OEM license revenue with renewal rates, avg contract value, new vs. renewal mix, and license revenue per enterprise customer
• Usage Revenue – API, compute, and storage revenue with implied usage volumes, revenue per unit, usage growth, and revenue per customer
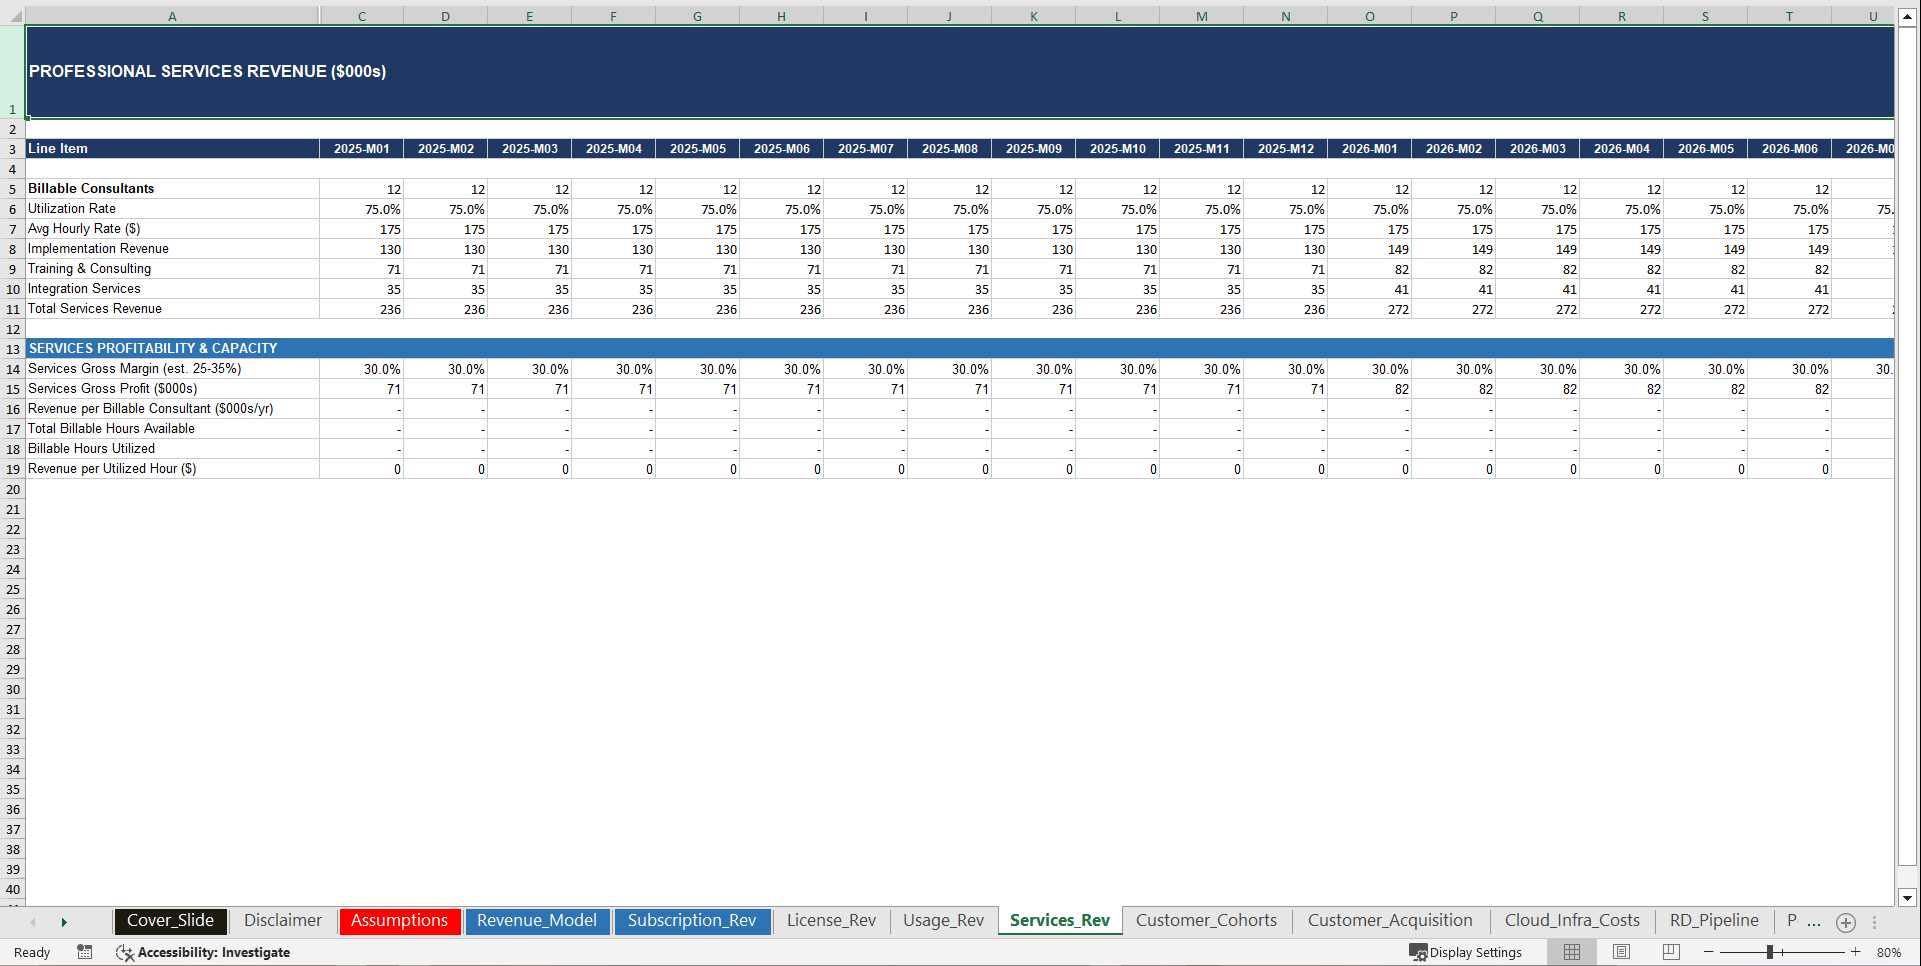
• Services Revenue – Implementation, training, consulting, and integration revenue with consultant count, utilization rate, billable hours, and services gross margin
• Customer Cohorts – Cohort sizing, M1 through M24 retention curves, LTV per cohort, CAC, and LTV/CAC ratio – the full retention picture any SaaS investor or growth equity buyer needs
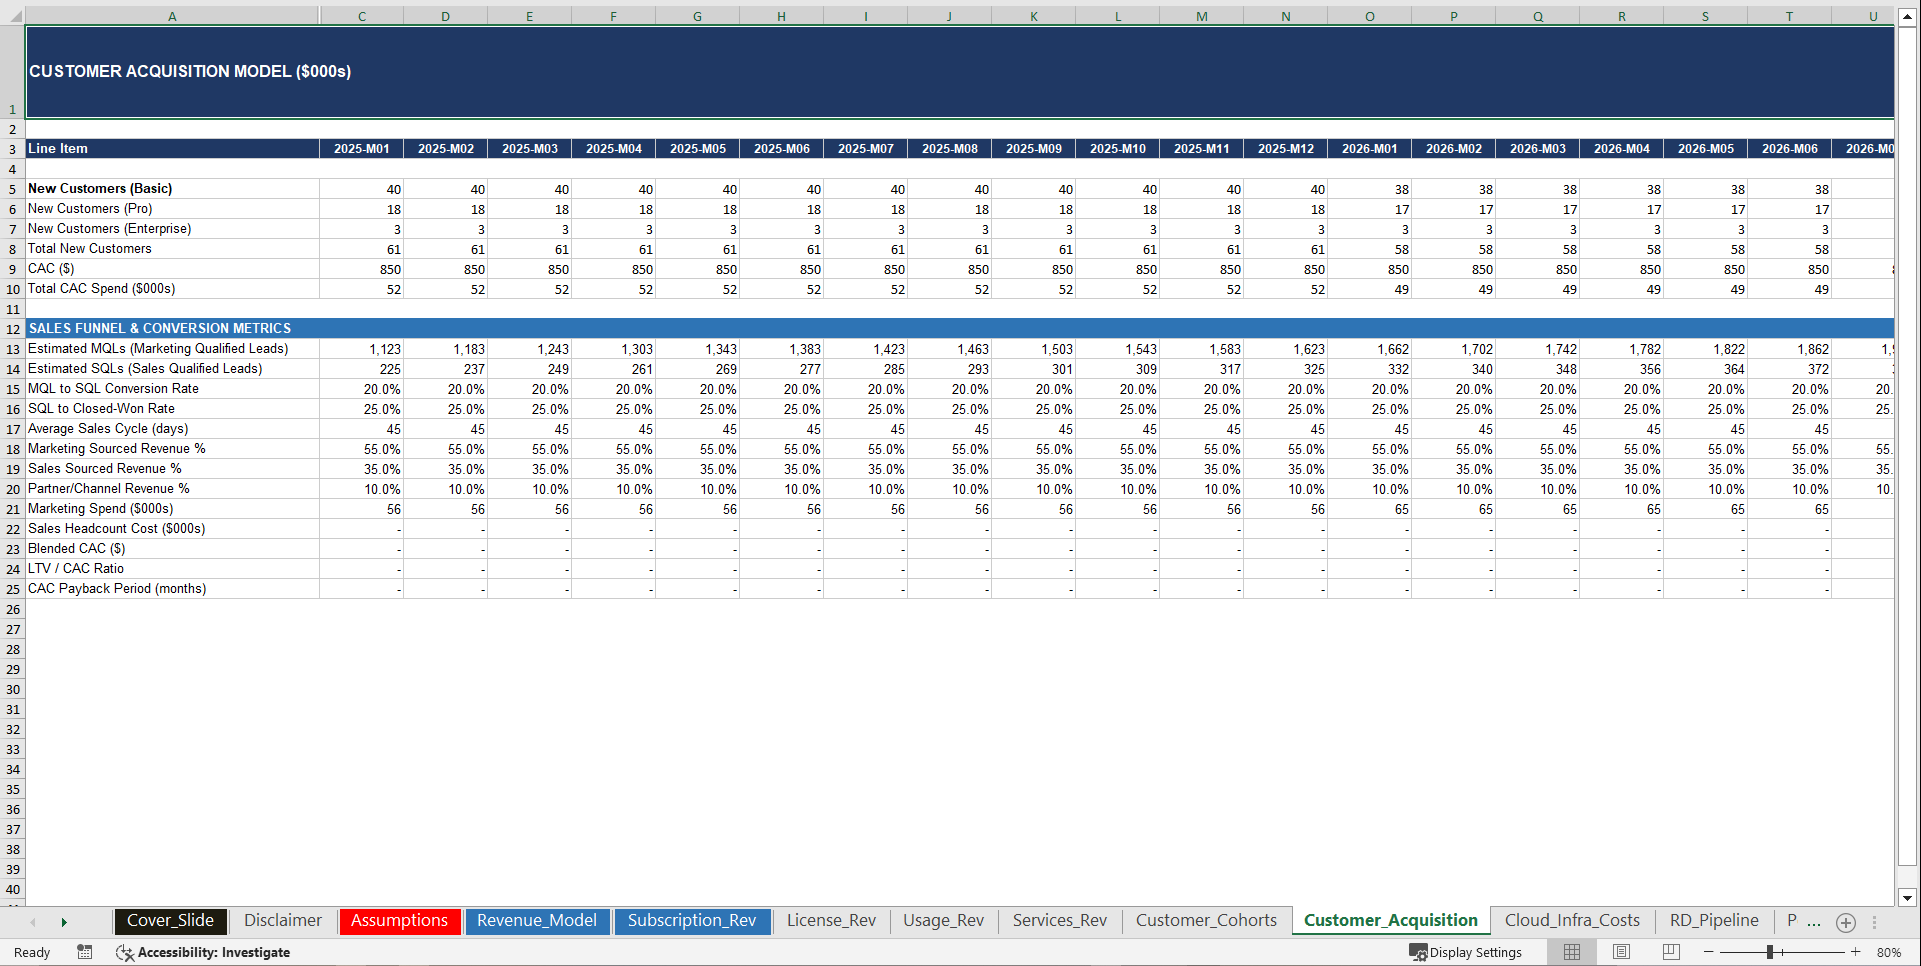
• Customer Acquisition – Full sales funnel from MQL through SQL through close, conversion rates, average sales cycle, channel mix (marketing-sourced vs. sales-sourced vs. partner), CAC by channel, CAC payback period, and blended LTV/CAC
• Cloud Infrastructure Costs – 7-line infrastructure cost breakdown (compute, storage, CDN, monitoring, security, disaster recovery, APIs) with cost per customer, infra% of revenue, and YoY efficiency metrics
• R&D Pipeline – Capitalized vs. expensed R&D split, 5 program category allocations, revenue per engineer, R&D efficiency ratio, total R&D investment including capitalized development – fully flowing into the P&L and Balance Sheet
• Personnel Plan – 5 departments with individual headcount and salary inputs, full compensation stack with benefits, SBC, and bonuses compounding annually, revenue per employee, and total people cost as % of revenue
• Operating Expenses – 9-line OpEx detail including R&D, sales commissions, marketing & advertising, G&A sub-components, SaaS tools, T&E, professional fees, insurance, and recruiting – plus opex efficiency metrics
• CapEx Plan – 3-category CapEx with full PP&E roll-forward, accumulated depreciation, capitalized software amortization, and total D&A tracking
• Working Capital – DSO, DIO, DPO, gross billing, cash collected, deferred revenue%, ACV billings, net cash cycle, and NWC fully linked to the Cash Flow Statement
• Debt Schedule – Venture debt and term loan individually modeled with leverage ratio, interest coverage, debt service coverage, and annual debt service tracking
• Income Statement – Revenue through Net Income with 4-stream revenue, 3-line COGS, 8-line OpEx, EPS, and Gross / EBITDA / EBIT / Net / FCF Margin % for every period
• Balance Sheet – Full asset, liability, and equity stack with auto-balancing check + 9 analytical ratios including Current Ratio, Quick Ratio, ROA, ROE, and Asset Turnover – confirming financial integrity across all 43 periods
• Cash Flow Statement – Full indirect method with individual working capital movements, CapEx by category, FCF, FCF margin, operating cash flow margin, cash conversion ratio, and runway in months – all linked to the Balance Sheet
• Sensitivity Analysis – 4 independent stress-test tables across EBITDA, FCF, scenario comparison, and interest rate sensitivity – 100+ instant scenario data points color-coded for at-a-glance risk assessment
*Built for SaaS founders, CFOs, investment bankers, private equity associates, venture capital analysts, growth equity investors, and strategic acquirers who need a model that works as hard as they do – from seed-stage pitch deck to Series C data room to M&A exit process.*
Key Words:
Strategy & Transformation, Growth Strategy, Strategic Planning, Strategy Frameworks, Innovation Management, Pricing Strategy, Core Competencies, Strategy Development, Business Transformation, Marketing Plan Development, Product Strategy, Breakout Strategy, Competitive Advantage, Mission, Vision, Values, Strategy Deployment & Execution, Innovation, Vision Statement, Core Competencies Analysis, Corporate Strategy, Product Launch Strategy, BMI, Blue Ocean Strategy, Breakthrough Strategy, Business Model Innovation, Business Strategy Example, Corporate Transformation, Critical Success Factors, Customer Segmentation, Customer Value Proposition, Distinctive Capabilities, Enterprise Performance Management, KPI, Key Performance Indicators, Market Analysis, Market Entry Example, Market Entry Plan, Market Intelligence, Market Research, Market Segmentation, Market Sizing, Marketing, Michael Porter's Value Chain, Organizational Transformation, Performance Management, Performance Measurement, Platform Strategy, Product Go-to-Market Strategy, Reorganization, Restructuring, SWOT, SWOT Analysis, Service 4.0, Service Strategy, Service Transformation, Strategic Analysis, Strategic Plan Example, Strategy Deployment, Strategy Execution, Strategy Frameworks Compilation, Strategy Methodologies, Strategy Report Example, Value Chain, Value Chain Analysis, Value Innovation, Value Proposition, Vision Statement, Corporate Strategy, Business Development, Business plan pdf, business plan, PDF, Business Plan DOC, Business Plan Template, PPT, Market strategy playbook, strategic market planning, competitive analysis tools, market segmentation frameworks, growth strategy templates, product positioning strategy, market execution toolkit, strategic alignment playbook, KPI and OKR frameworks, business growth strategy guide, cross-functional strategy templates, market risk management, market strategy PowerPoint doc, guide, ebook, e-book ,McKinsey Change Playbook, Organizational change management toolkit, Change management frameworks 2025, Influence model for change, Change leadership strategies, Behavioral change in organizations, Change management PowerPoint templates, Transformational leadership in change, supply chain KPIs, supply chain KPI toolkit, supply chain PowerPoint template, logistics KPIs, procurement KPIs, inventory management KPIs, supply chain performance metrics, manufacturing KPIs, supply chain dashboard, supply chain strategy KPIs, reverse logistics KPIs, sustainability KPIs in supply chain, financial supply chain KPIs, warehouse KPIs, digital supply chain KPIs, 1200 KPIs, supply chain scorecard, KPI examples, supply chain templates, Corporate Finance SOPs, Finance SOP Excel Template, CFO Toolkit, Finance Department Procedures, Financial Planning SOPs, Treasury SOPs, Accounts Payable SOPs, Accounts Receivable SOPs, General Ledger SOPs, Accounting Policies Template, Internal Controls SOPs, Finance Process Standardization, Finance Operating Procedures, Finance Department Excel Template, FP&A Process Documentation, Corporate Finance Template, Finance SOP Toolkit, CFO Process Templates, Accounting SOP Package, Tax Compliance SOPs, Financial Risk Management Procedures.
NOTE: Our digital products are sold on an "as is" basis, making returns and refunds unavailable post-download. Please preview and inquire before purchasing. Please contact us before purchasing if you have any questions! This policy aligns with the standard Flevy Terms of Usage.
Got a question about the product? Email us at support@flevy.com or ask the author directly by using the "Ask the Author a Question" form. If you cannot view the preview above this document description, go here to view the large preview instead.
Source: Best Practices in Software, Integrated Financial Model Excel: Software Development Company Advanced Financial Model Excel (XLSX) Spreadsheet, SB Consulting
ABOUT THE AUTHOR
SB Consulting is dedicated to empowering businesses to communicate their ideas with impact. This consulting firm specializes in teaching organizations how to create effective corporate and management presentations. With training from top-tier global consulting firms, including McKinsey, BCG, and Porsche Consulting, extensive expertise in presentation design and ... [read more]
Ask the Author a Question
You must be logged in to contact the author.
