
 Click main image to view in full screen. Unlock all 15 preview images:
Restaurant Financial Model - 5-Year Forecast & Dashboard – Excel XLSX
Excel (XLSX) + Zip archive file (ZIP)


BENEFITS OF THIS DOWNLOADABLE EXCEL DOCUMENT
- Build an integrated 5-year restaurant forecast connecting covers, average check, food and beverage revenue, COGS, staffing, expenses, financing, and all three financial statements.
- Analyze break-even revenue, daily covers, capacity utilization, EBITDA, liquidity, funding needs, scenarios, and Average Check × Daily Covers sensitivity.
- Turn operating assumptions into management-ready insights with an Executive Dashboard, 15-slide presentation deck, and detailed 26-page user guide.
RESTAURANT INDUSTRY EXCEL DESCRIPTION
🍷 RESTAURANT 5-YEAR FINANCIAL MODEL & BUSINESS FORECAST
Build a structured financial forecast for a restaurant or hospitality business with a professional model that connects operating drivers directly with revenue, costs, profitability, cash flow, and funding requirements.
This package combines a comprehensive 5-Year Three-Statement Financial Model, a professional 15-slide Investor / Management PowerPoint Deck, and a detailed 26-page How-to-Use Guide.
It is designed for independent restaurants, new restaurant concepts, hospitality businesses, founders, operators, consultants, finance teams, and management professionals who need a transparent framework for planning restaurant performance.
📦 WHAT IS INCLUDED
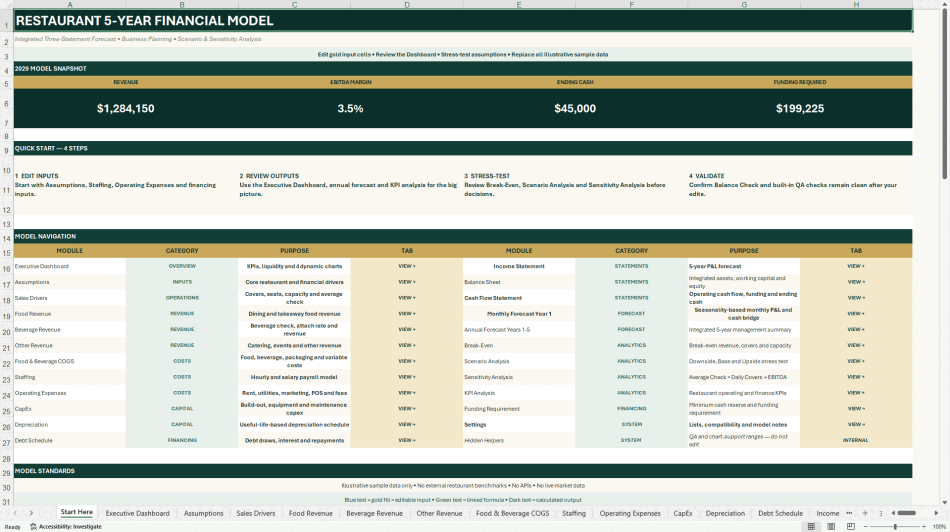
✓ Premium financial model with 25 structured worksheets
✓ 5-year forecast with illustrative sample data for 2029–2033
✓ Income Statement, Balance Sheet, and Cash Flow Statement
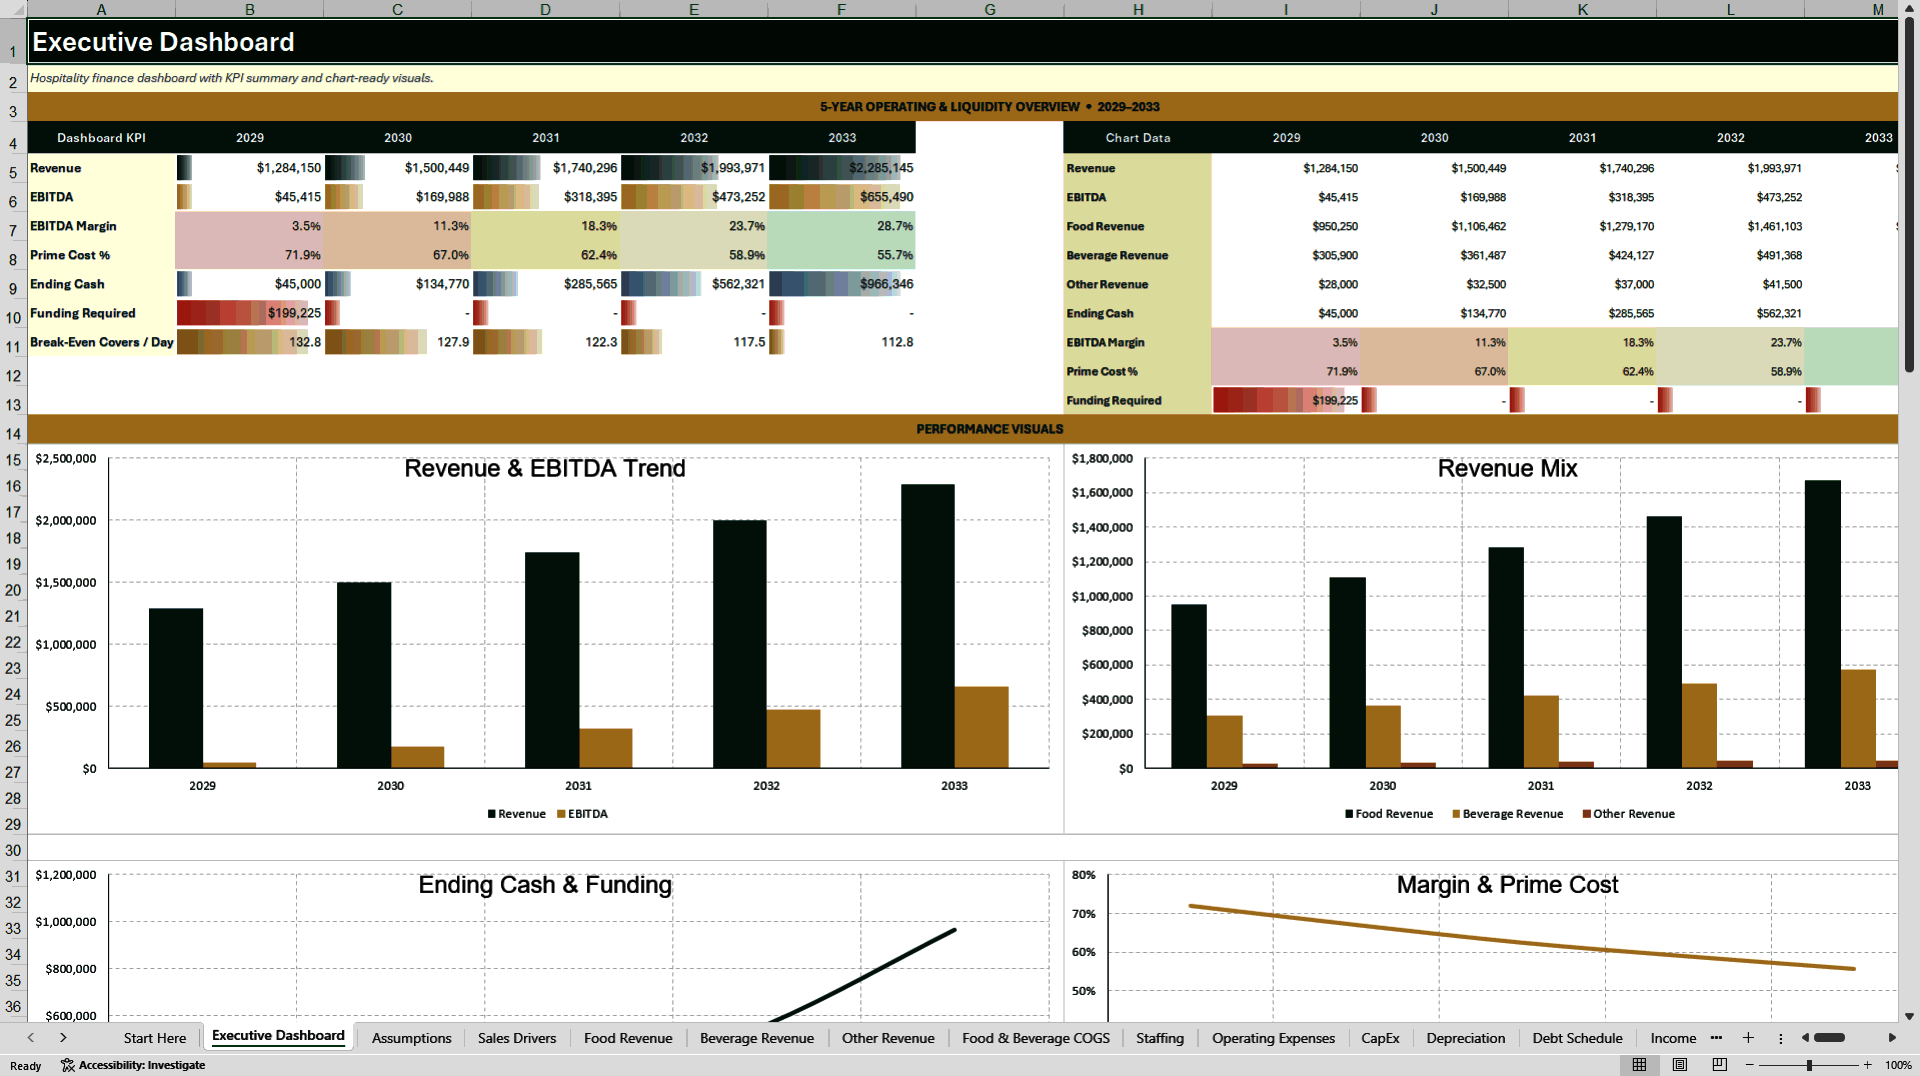
✓ Executive Dashboard with KPI reporting and 4 dynamic charts
✓ 15-slide Investor / Management PowerPoint Deck
✓ 26-page How-to-Use PDF Guide
✓ Downside / Base / Upside Scenario Analysis
✓ Average Check × Daily Covers EBITDA Sensitivity Analysis
✓ Break-Even and Funding Requirement analysis
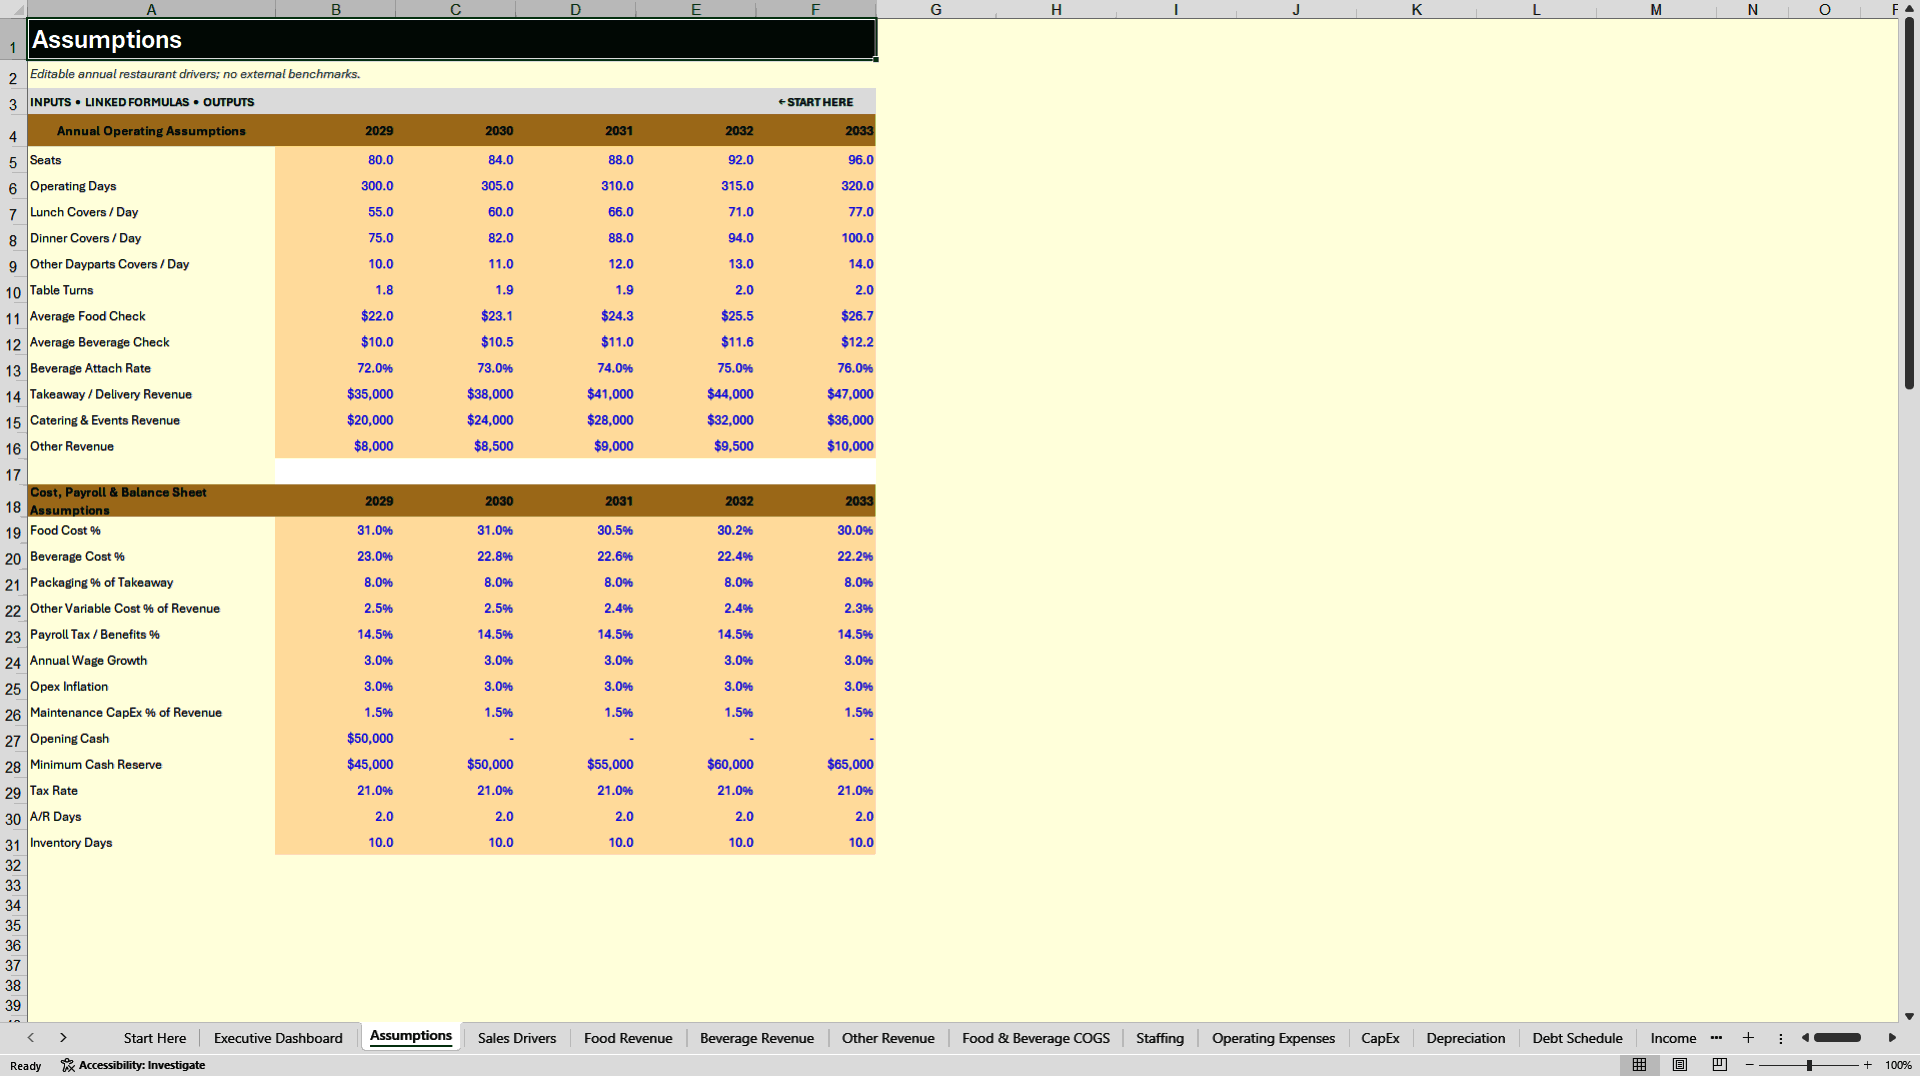
✓ Fully editable key assumptions
✓ No macros or VBA
✓ No APIs or live market-data connections
✓ No automatic restaurant-industry benchmarks
✓ All files and content provided in English
All included assumptions and sample figures are illustrative and can be replaced with restaurant-specific business data.
🍽️ SALES DRIVERS
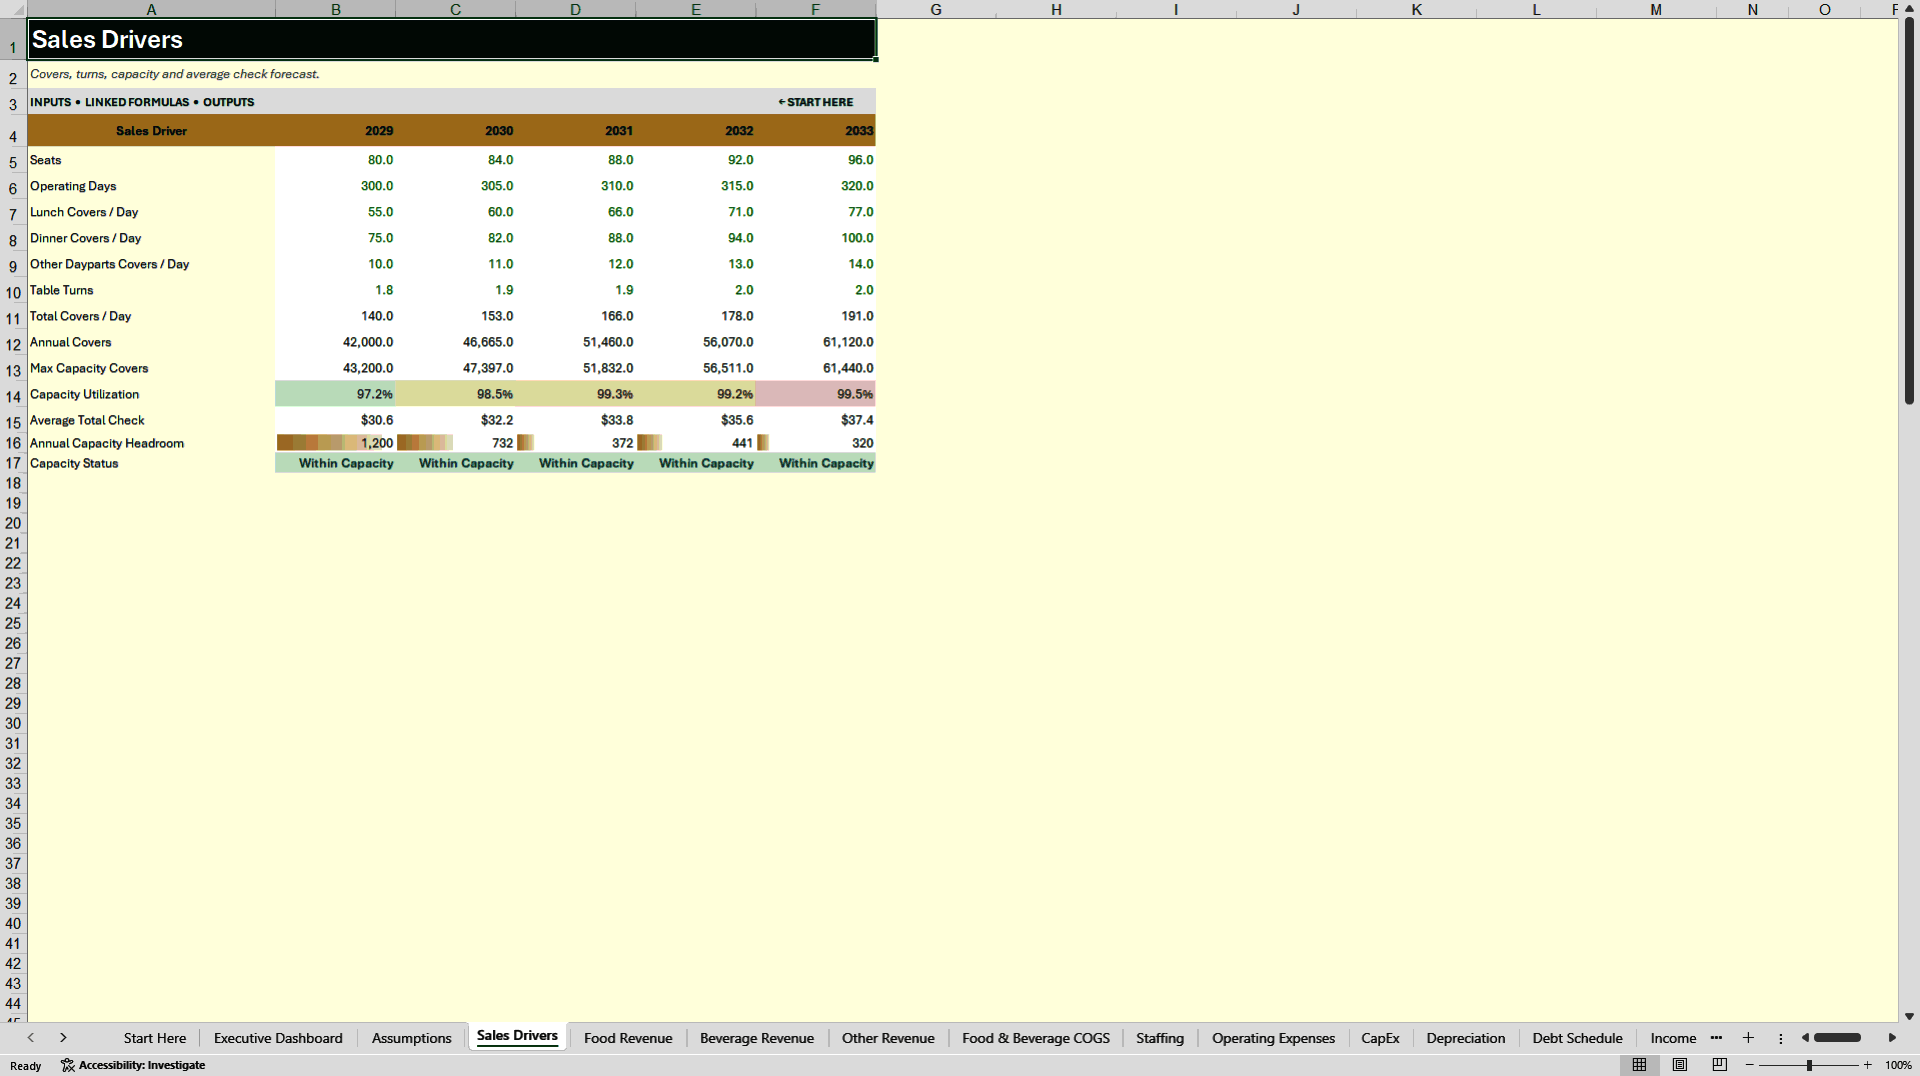
The model connects restaurant capacity and customer activity directly with the financial forecast.
Users can plan:
✓ Seats
✓ Operating Days
✓ Lunch Covers
✓ Dinner Covers
✓ Additional Dayparts
✓ Table Turns
✓ Capacity Utilization
✓ Average Food Check
✓ Average Beverage Check
✓ Beverage Attach Rate
These operating assumptions provide the foundation for the restaurant revenue forecast.
💰 REVENUE FORECAST
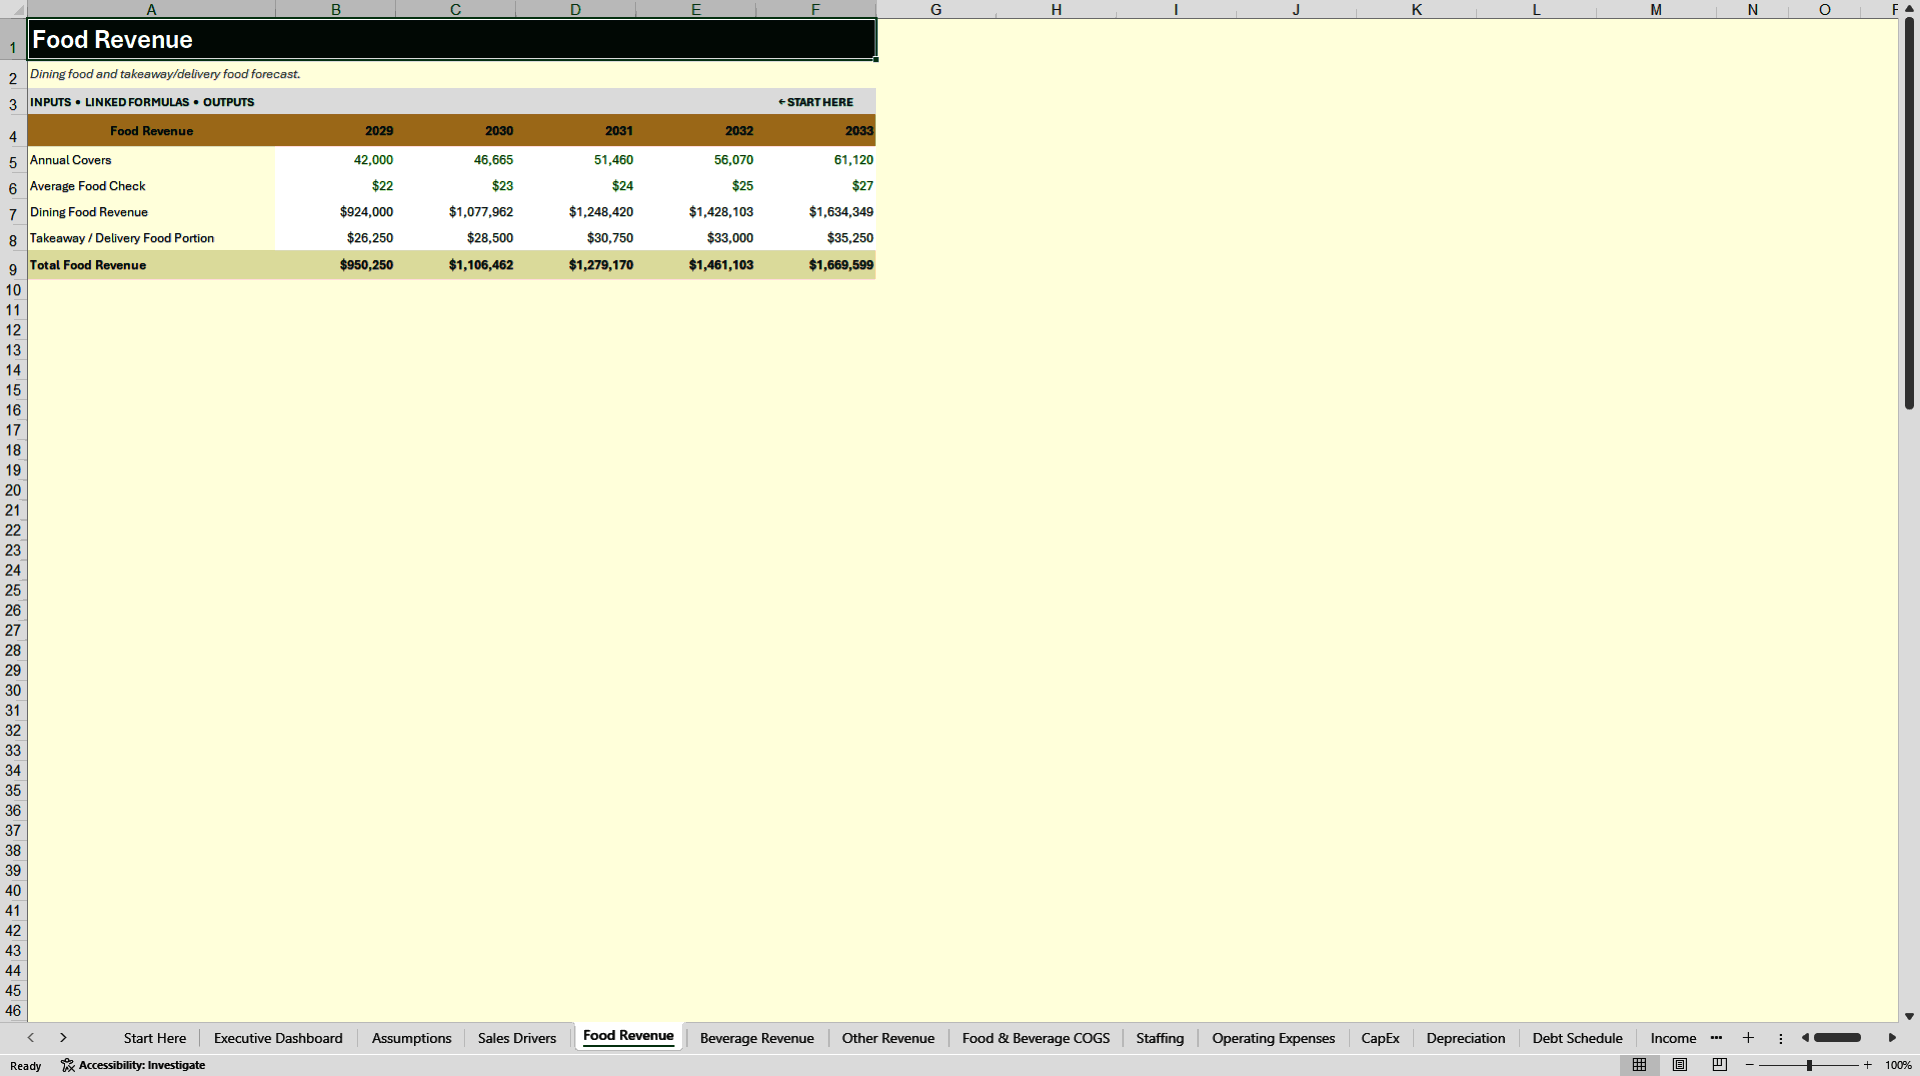
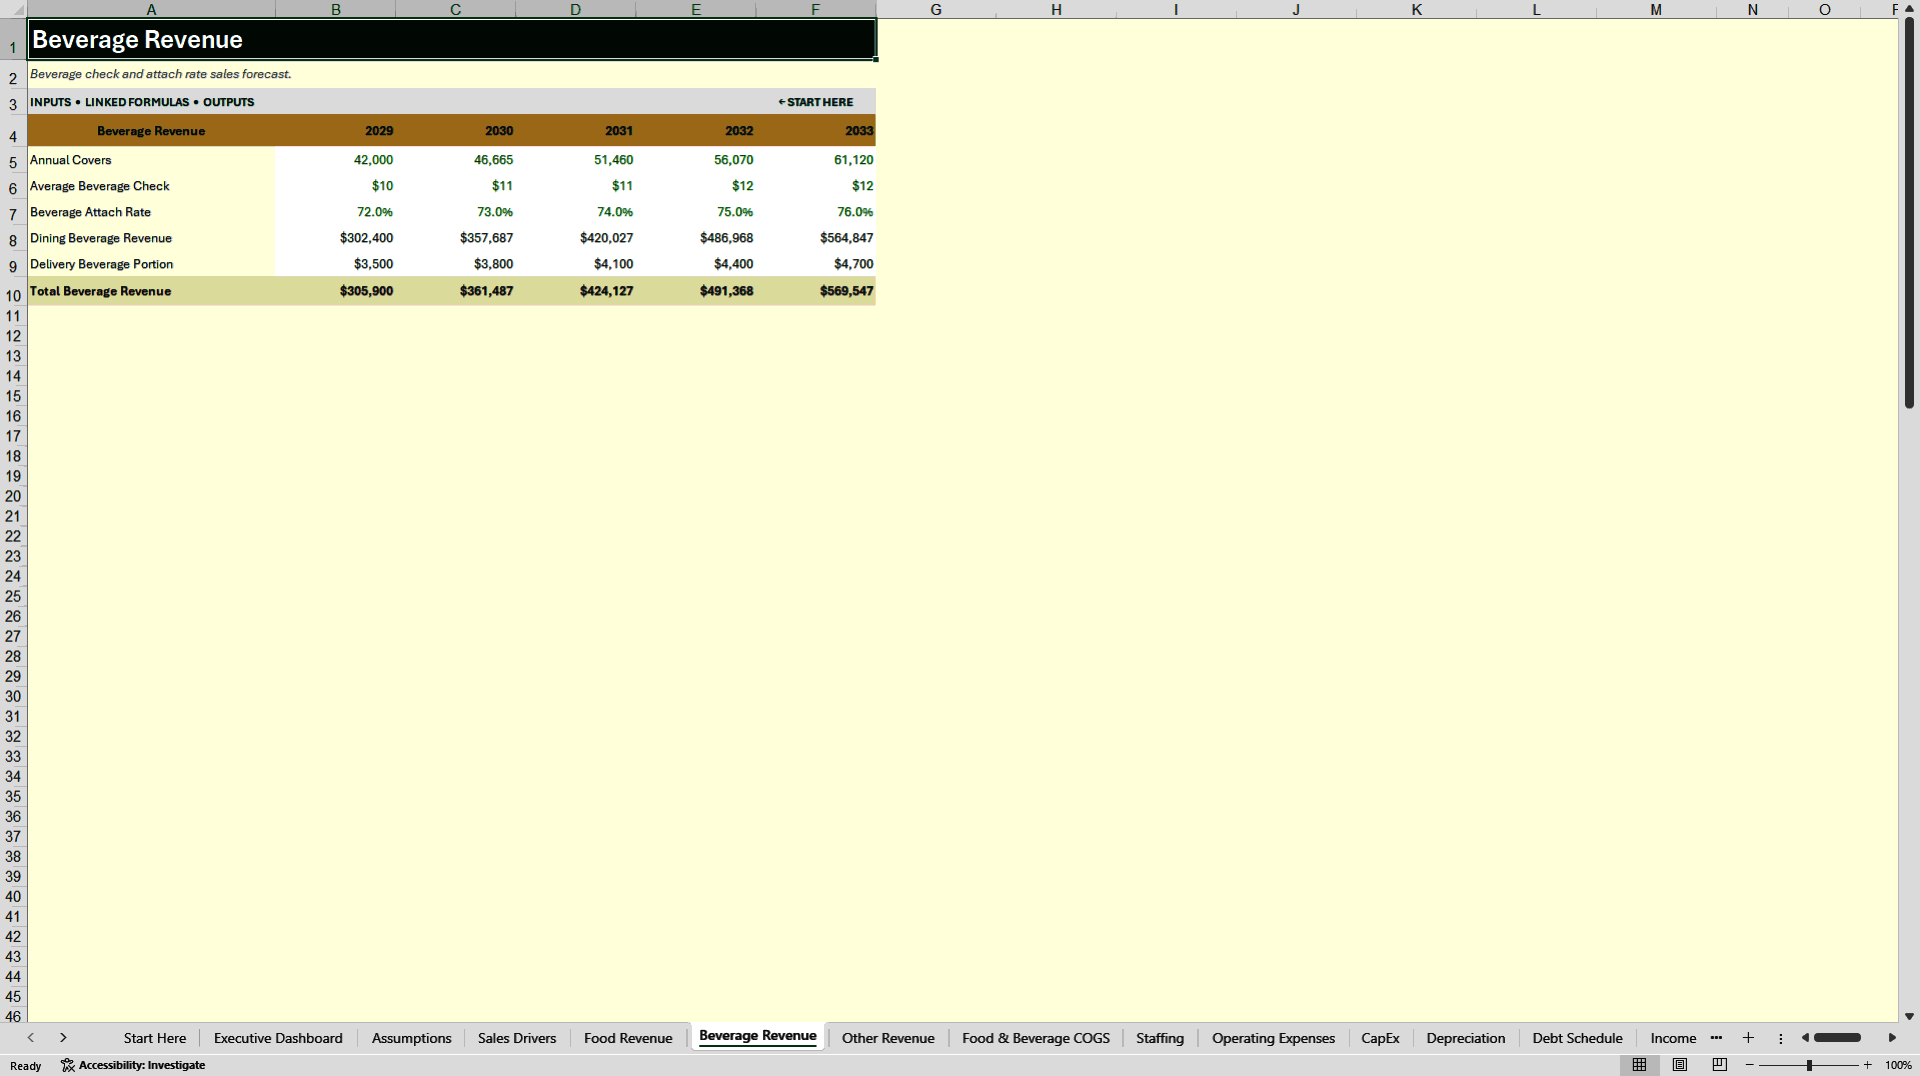
Food and beverage revenue are modeled separately to provide clearer visibility into restaurant economics.
The model includes:
✓ Food Revenue
✓ Beverage Revenue
✓ Takeaway / Delivery Revenue
✓ Catering & Events Revenue
✓ Other Revenue
Takeaway and delivery assumptions are incorporated into food and beverage revenue logic, while catering, events, and other revenue streams remain separately identifiable.
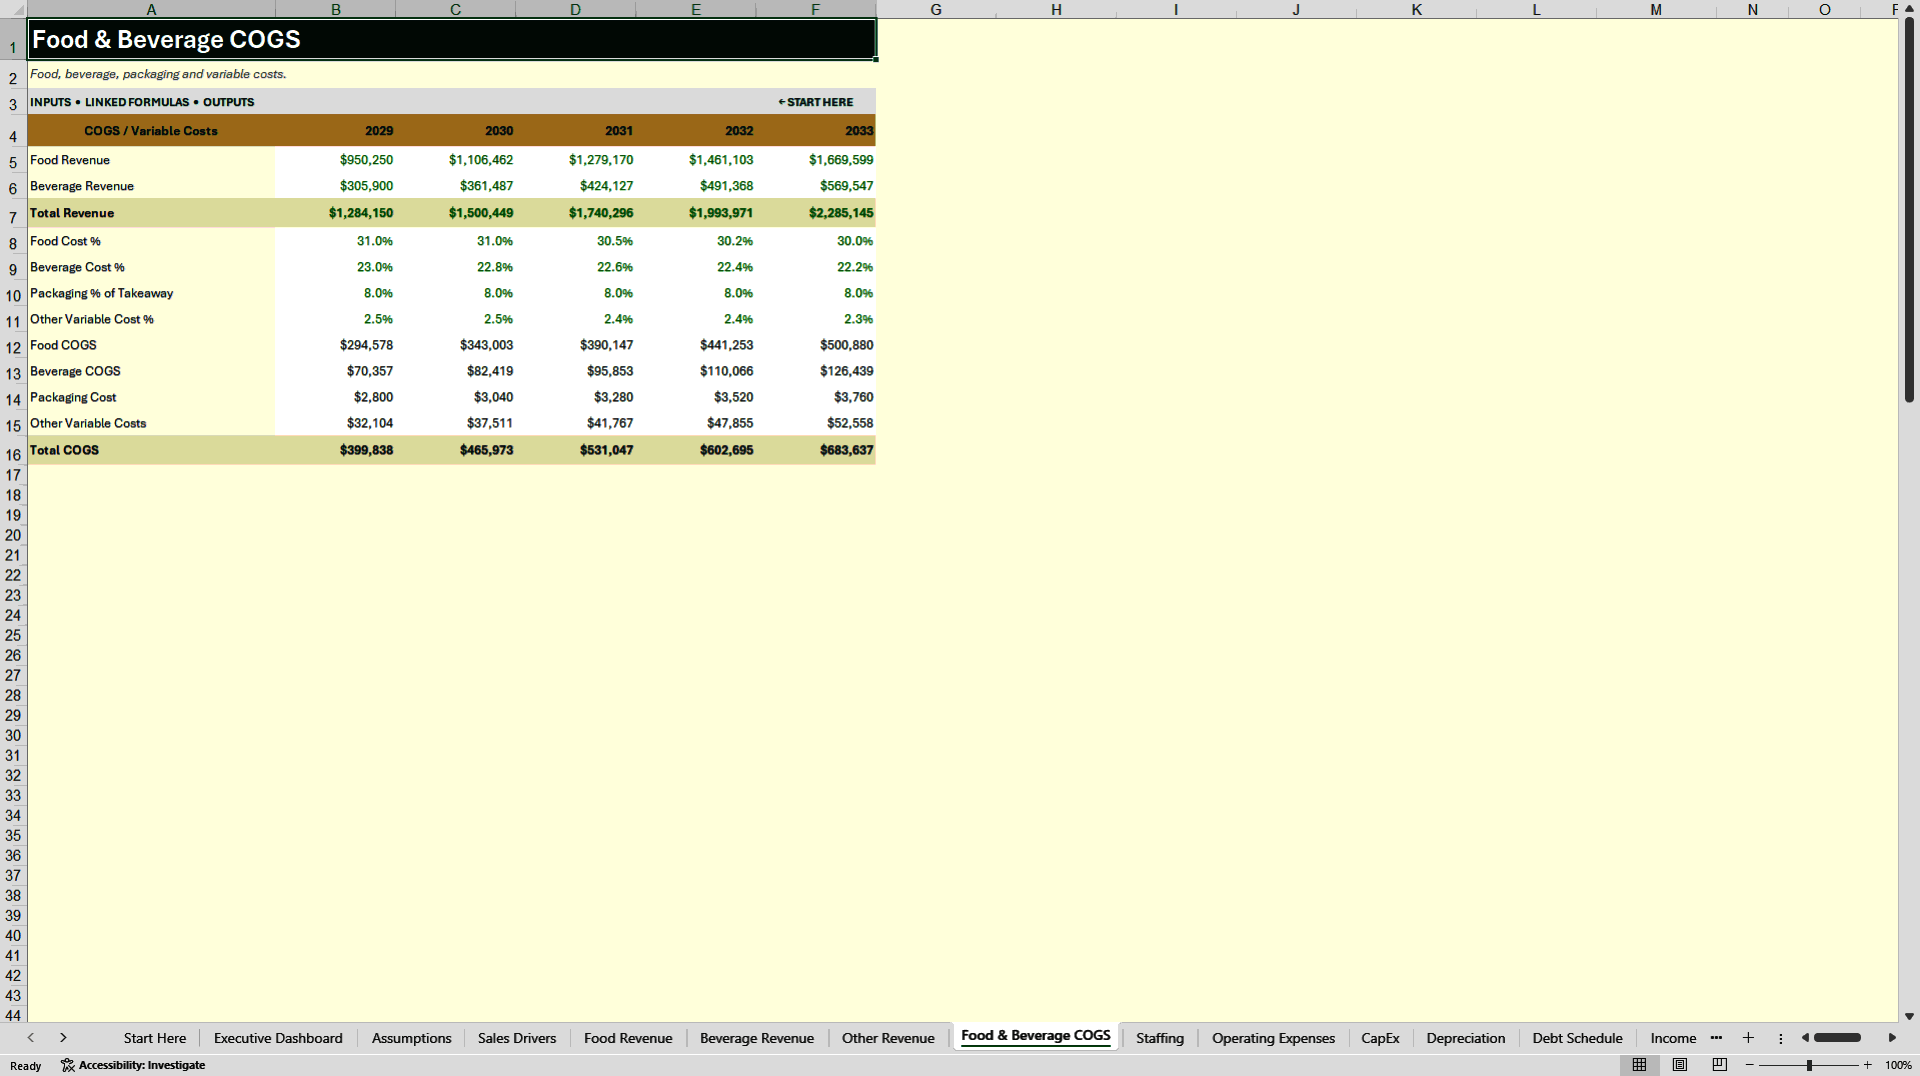
🥘 FOOD & BEVERAGE COGS
The cost structure includes dedicated assumptions for:
✓ Food Cost %
✓ Beverage Cost %
✓ Packaging
✓ Other Variable Costs
This allows food and beverage margins to be reviewed independently rather than using one blended restaurant COGS percentage.
👨🍳 STAFFING & PAYROLL
The Staffing section supports both hourly and salaried workforce planning.
Roles include:
✓ Management
✓ Kitchen
✓ Servers
✓ Bar
✓ Hosts
✓ Cleaning
✓ Administration
Payroll assumptions, wage growth, payroll taxes, and benefits flow into the integrated financial forecast.
🏢 OPERATING EXPENSES
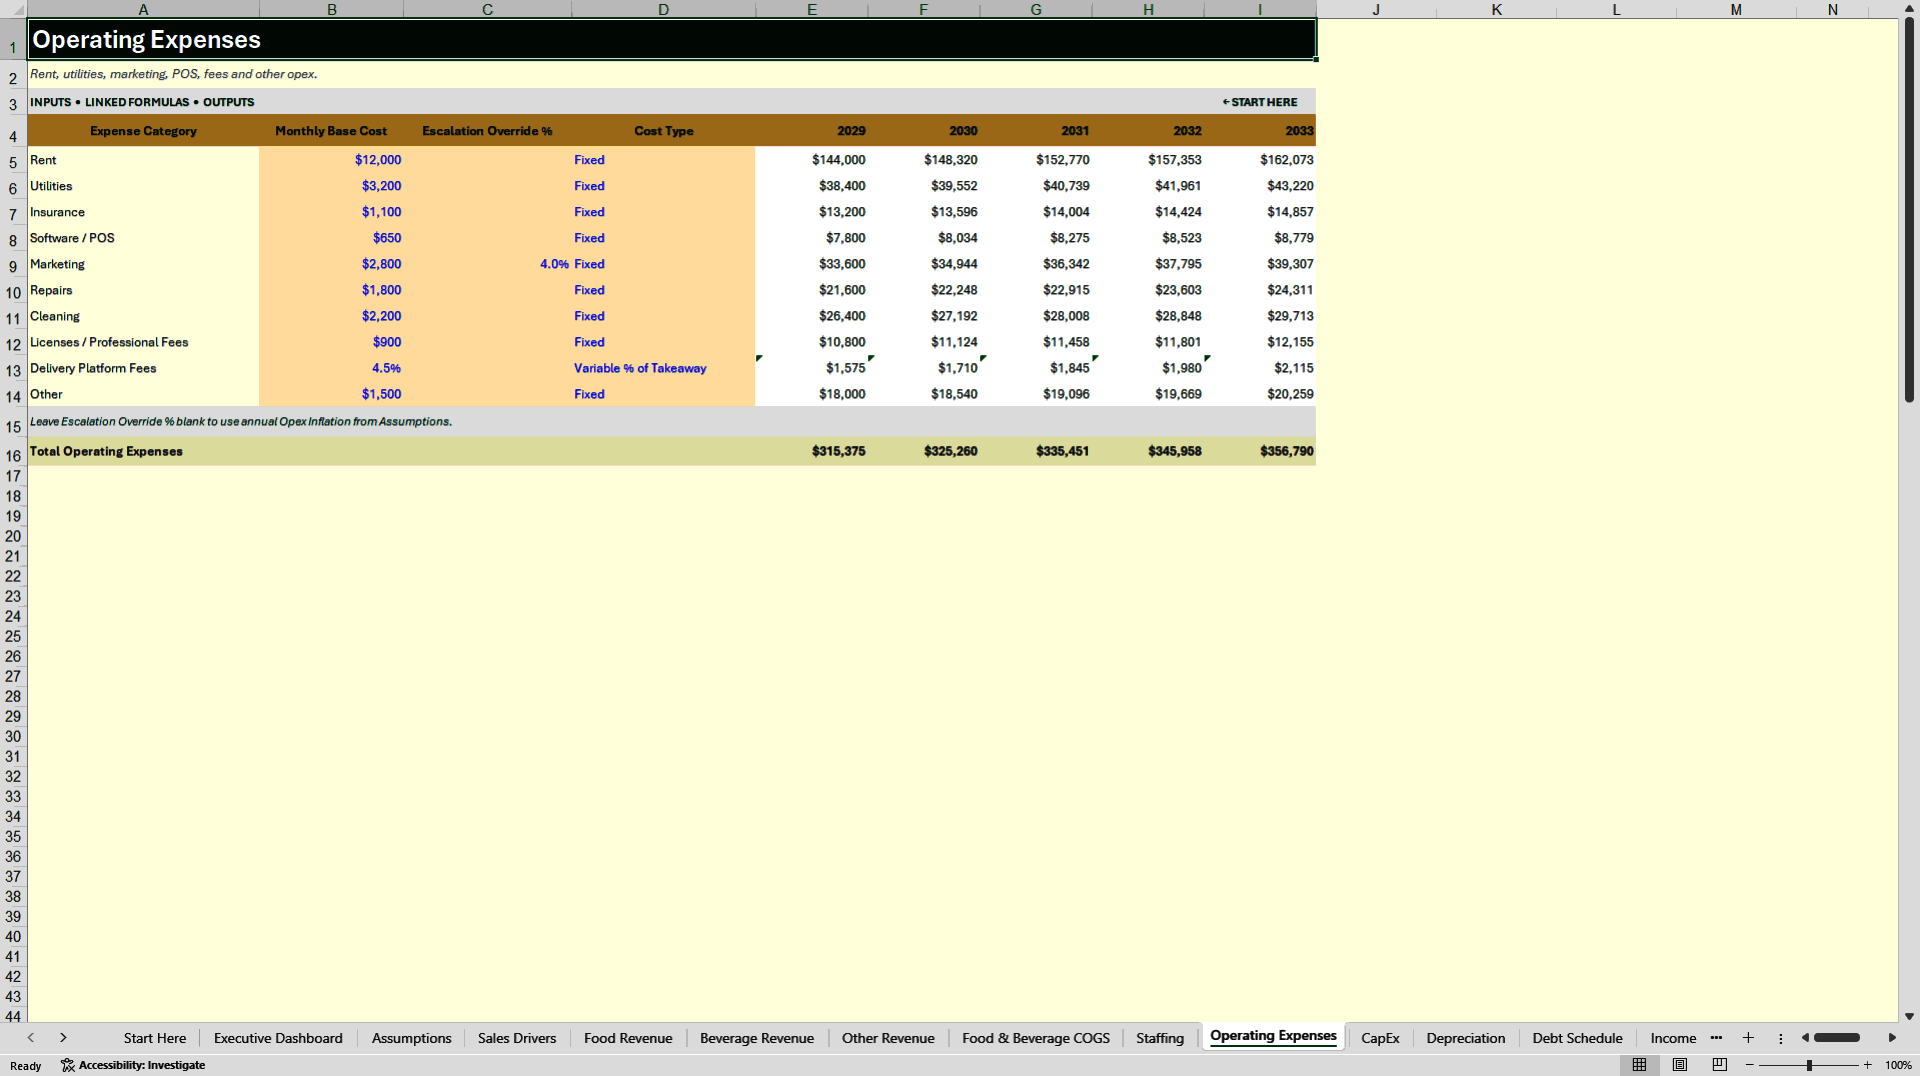
Operating expenses can be planned across key restaurant cost categories including:
✓ Rent
✓ Utilities
✓ Insurance
✓ Software / POS
✓ Marketing
✓ Repairs
✓ Cleaning
✓ Licenses / Professional Fees
✓ Delivery Platform Fees
✓ Other Expenses
🏗️ CAPEX, DEPRECIATION & DEBT
The model includes dedicated schedules for:
✓ Capital Expenditure
✓ Depreciation
✓ Debt Draws
✓ Interest Expense
✓ Principal Repayments
These items are integrated directly into the financial statements and cash-flow forecast.
🧾 INTEGRATED THREE-STATEMENT MODEL
The workbook includes fully connected:
✓ Income Statement
✓ Balance Sheet
✓ Cash Flow Statement
Revenue, COGS, payroll, operating expenses, CapEx, debt, working capital, taxes, and funding requirements flow through the model as one integrated system.
📅 MONTHLY & 5-YEAR FORECAST
The model combines:
✓ Monthly Forecast – Year 1
✓ Annual Forecast – Years 1 to 5
This provides detailed short-term operating visibility together with a full five-year financial outlook.
📊 EXECUTIVE DASHBOARD
The Executive Dashboard consolidates important restaurant KPIs and financial outputs.
Metrics include:
✓ Revenue
✓ EBITDA
✓ EBITDA Margin
✓ Prime Cost %
✓ Ending Cash
✓ Funding Required
✓ Break-Even Covers / Day
✓ Revenue Trends
✓ EBITDA Trends
✓ Revenue Mix
✓ Liquidity Trends
Four integrated charts provide a management-ready visual overview of the forecast.
🎯 BREAK-EVEN ANALYSIS
The model calculates:
✓ Break-Even Revenue
✓ Break-Even Covers / Year
✓ Break-Even Covers / Day
✓ Break-Even Capacity Utilization
✓ Contribution Margin
This helps users understand the sales and customer-volume levels required to cover the modeled cost structure.
🔄 DOWNSIDE / BASE / UPSIDE SCENARIOS
Scenario Analysis allows users to test changes in:
✓ Customer Covers
✓ Average Check
✓ COGS
✓ Payroll
✓ Operating Expenses
Each scenario shows the resulting impact on revenue, EBITDA, EBITDA margin, cash before funding, funding requirements, and ending cash.
Scenarios are planning tools and are not market predictions.
📈 EBITDA SENSITIVITY ANALYSIS
A dedicated sensitivity matrix evaluates how different combinations of:
✓ Average Check
✓ Daily Covers
can affect EBITDA.
This provides a clear view of the relationship between restaurant traffic, customer spending, and profitability.
🏦 LIQUIDITY & FUNDING REQUIREMENT
The model evaluates whether forecast cash remains above the defined Minimum Cash Reserve.
The Funding Requirement section includes:
✓ Minimum Cash Reserve
✓ Cash Before Funding
✓ Funding Required
✓ Cumulative Funding Required
This connects restaurant profitability with liquidity and potential capital requirements.
🖥️ 15-SLIDE INVESTOR / MANAGEMENT DECK
The included presentation provides a professional structure for communicating restaurant performance, operating assumptions, financial projections, break-even, scenarios, and funding requirements.
It can be adapted for management reviews, business-planning discussions, financing preparation, consultant deliverables, or investor-oriented presentations.
📘 26-PAGE HOW-TO-USE GUIDE
The detailed PDF guide explains the complete model workflow, including:
✓ Revenue
✓ Food & Beverage COGS
✓ Staffing
✓ Operating Expenses
✓ CapEx
✓ Debt
✓ Three Financial Statements
✓ Monthly Forecast
✓ Break-Even
✓ Scenario Analysis
✓ Sensitivity Analysis
✓ KPIs
✓ Funding Requirements
✓ QA Checks
✓ Google Sheets Guidance
👥 WHO THIS MODEL IS FOR
✓ Existing Restaurants
✓ New Restaurant Concepts
✓ Independent Restaurant Operators
✓ Hospitality Businesses
✓ Founders and Business Owners
✓ Finance and Management Teams
✓ Consultants and Advisors
✓ Business Plan Preparation
✓ Funding and Investor Discussions
💻 COMPATIBILITY
The primary model is provided in Microsoft Excel XLSX format.
Supplemental files include Microsoft PowerPoint PPTX and PDF.
The workbook is designed to remain suitable for Google Sheets import where practical. Microsoft Excel remains the reference environment, and formatting or certain functionality may vary after import.
⚖️ IMPORTANT DISCLAIMER
This product is an editable planning and financial-modeling template.
It does not constitute financial, investment, tax, legal, accounting, valuation, funding, or business advice.
All assumptions, sample data, scenarios, forecasts, and outputs are illustrative only. No automatic restaurant-industry benchmarks or current market pricing data are provided.
Users should replace the sample assumptions with their own business information and independently review all outputs before making decisions.
All SheetworksStudio templates are independently created and unofficial. SheetworksStudio is not affiliated with, endorsed by, or sponsored by Microsoft, Google, or any other third-party brand.
Got a question about the product? Email us at support@flevy.com or ask the author directly by using the "Ask the Author a Question" form. If you cannot view the preview above this document description, go here to view the large preview instead.
Source: Best Practices in Restaurant Industry, Integrated Financial Model Excel: Restaurant Financial Model - 5-Year Forecast & Dashboard Excel (XLSX) Spreadsheet, SheetworksStudio
ABOUT THE AUTHOR

SheetworksStudio creates premium Excel-based business templates, dashboards, trackers, financial models, and management systems for professionals, consultants, entrepreneurs, and organizations.
Our portfolio covers finance, project management, operations, risk management, compliance, AI governance, HR, supply chain, performance management, and business planning. Each product is designed to
... [read more]
Ask the Author a Question
You must be logged in to contact the author.




























