
Oil and Gas Company 12-Month Profit and Loss (P&L) Dashboard – Excel XLSX
Excel (XLSX)
BENEFITS OF THIS DOWNLOADABLE EXCEL DOCUMENT
- Provides a framework for tracking and optimizing your Oil & Gas company's financial performance year-round.
- Enables automated calculation of gross profit, total expenses, and net profit/loss for precise financial insights.
- Offers a visually intuitive P&L Dashboard to identify revenue trends, control costs, and boost profitability.
OIL & GAS EXCEL DESCRIPTION
Curated by McKinsey-trained Executives
Maximize Your Oil & Gas Company Profits with the Ultimate 12-Month Profit & Loss (P&L) Dashboard Excel Template
Are you looking for a powerful, automated solution to track and optimize your oil and gas company's financial performance? Look no further! Our 12-Month Profit & Loss (P&L) Dashboard Excel Template is specifically designed to help oil and gas businesses like yours streamline financial reporting, monitor revenue streams, control expenses, and drive profitability with zero hassle.
This all-in-one P&L Dashboard template provides a comprehensive, year-long view of your company's financial health, combining monthly revenue tracking, cost management, and expense oversight into a single, easy-to-use Excel file. It's perfect for financial managers, CFOs, accountants, and business owners who demand accuracy, efficiency, and instant insights.
Why Our Oil & Gas P&L Dashboard is Essential for Your Business
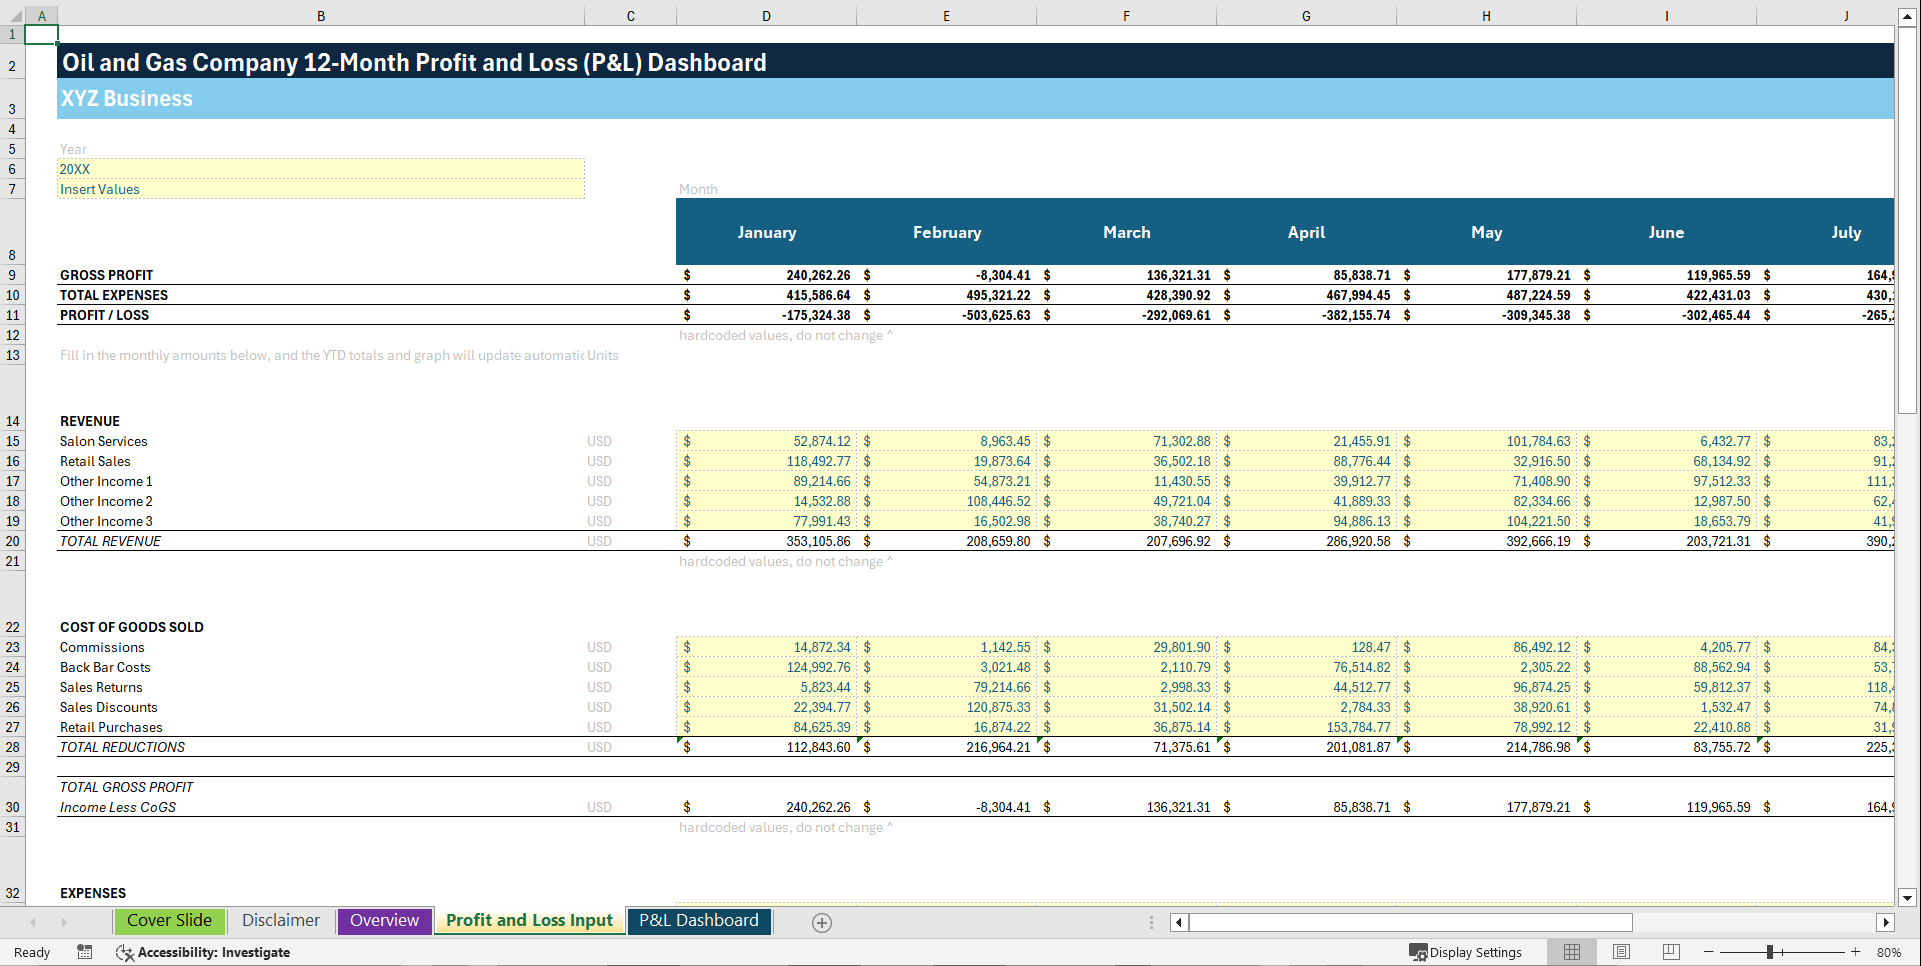
1. Revenue Tracking Made Simple
Input monthly revenue from multiple sources including oil production, gas sales, service contracts, and other income streams, and watch the template automatically calculate total revenue and year-to-date (YTD) performance. Quickly identify seasonal trends, high-performing months, and key revenue drivers to make smarter business decisions.
2. Cost of Goods Sold & Reductions
Track all direct costs including commissions, production costs, equipment purchases, and operational reductions. The template automatically calculates total reductions and gross profit, giving you an instant view of operational efficiency across the year.
3. Gross Profit & Net Profit Insights
See how effectively your company converts revenue into profit. With automatic gross profit calculations and monthly/year-to-date net profit figures, you can immediately evaluate profitability, margins, and financial performance trends—crucial for making informed strategic decisions.
4. Detailed Expense Management
From employee salaries, wages, and benefits to rent, utilities, marketing, and insurance, our template lets you input and track all operating expenses effortlessly. Expenses are summed automatically, and the dashboard visualizations reveal spending patterns and variances over time.
5. Tax & Total Expense Calculations
Easily manage sales tax, property tax, B&O tax, and other liabilities, with automatic total expense calculations for each month and the full year. Ensure your P&L is accurate, compliant, and ready for stakeholders or auditors.
6. Interactive Dashboard & Visualizations
Our P&L Dashboard includes dynamic charts and summary tiles that update automatically as you enter data:
• Operating Income & Expense Trends (Past 12 Months) – line or bar graphs showing revenue, expenses, and profit over time.
• Total Revenue per Month – clear month-by-month revenue comparison.
• Cost of Goods Sold / Reductions – track how direct costs fluctuate across the year.
• Summary Metrics Tiles – instant insights for Total Revenue, Total Gross Profit, Total Operating Expenses, Total Expenses, and Net Profit/Loss (YTD).
7. Fully Automated Excel Template
Simply fill in your monthly figures, and watch the gross profit, total expenses, and profit/loss calculations update automatically. It's designed for flexibility, accuracy, and scalability, perfect for any oil and gas operation—whether you're managing a small production site or a multinational portfolio.
Who Should Use This Oil & Gas P&L Template?
• Oil & Gas CFOs and Financial Controllers
• Business Owners in Energy & Natural Resources
• Accounting and Finance Teams
• Operations Managers looking to optimize profitability
Key Features at a Glance
• Monthly revenue input by source (Oil, Gas, Services, Other Income)
• Automatic calculation of Gross Profit, Total Expenses, and Net Profit/Loss
• Track COGS, commissions, sales reductions, and retail purchases
• Detailed operating expense categories with automatic totals
• Tax tracking including Sales, Property, and Other Taxes
• Dynamic visual dashboards with monthly trends and YTD totals
• Fully automated Excel formula-driven template
Take control of your oil and gas company's financial future today. With our 12-Month Profit & Loss Dashboard Excel Template, you'll save hours on reporting, maximize profitability, and make smarter, data-driven decisions that drive growth.
Key Words:
Strategy & Transformation, Growth Strategy, Strategic Planning, Strategy Frameworks, Innovation Management, Pricing Strategy, Core Competencies, Strategy Development, Business Transformation, Marketing Plan Development, Product Strategy, Breakout Strategy, Competitive Advantage, Mission, Vision, Values, Strategy Deployment & Execution, Innovation, Vision Statement, Core Competencies Analysis, Corporate Strategy, Product Launch Strategy, BMI, Blue Ocean Strategy, Breakthrough Strategy, Business Model Innovation, Business Strategy Example, Corporate Transformation, Critical Success Factors, Customer Segmentation, Customer Value Proposition, Distinctive Capabilities, Enterprise Performance Management, KPI, Key Performance Indicators, Market Analysis, Market Entry Example, Market Entry Plan, Market Intelligence, Market Research, Market Segmentation, Market Sizing, Marketing, Michael Porter's Value Chain, Organizational Transformation, Performance Management, Performance Measurement, Platform Strategy, Product Go-to-Market Strategy, Reorganization, Restructuring, SWOT, SWOT Analysis, Service 4.0, Service Strategy, Service Transformation, Strategic Analysis, Strategic Plan Example, Strategy Deployment, Strategy Execution, Strategy Frameworks Compilation, Strategy Methodologies, Strategy Report Example, Value Chain, Value Chain Analysis, Value Innovation, Value Proposition, Vision Statement, Corporate Strategy, Business Development, Busienss plan pdf, business plan, PDF, Biusiness Plan DOC, Bisiness Plan Template, PPT, Market strategy playbook, strategic market planning, competitive analysis tools, market segmentation frameworks, growth strategy templates, product positioning strategy, market execution toolkit, strategic alignment playbook, KPI and OKR frameworks, business growth strategy guide, cross-functional strategy templates, market risk management, market strategy PowerPoint dec, guide, ebook, e-book ,McKinsey Change Playbook, Organizational change management toolkit, Change management frameworks 2025, Influence model for change, Change leadership strategies, Behavioral change in organizations, Change management PowerPoint templates, Transformational leadership in change, supply chain KPIs, supply chain KPI toolkit, supply chain PowerPoint template, logistics KPIs, procurement KPIs, inventory management KPIs, supply chain performance metrics, manufacturing KPIs, supply chain dashboard, supply chain strategy KPIs, reverse logistics KPIs, sustainability KPIs in supply chain, financial supply chain KPIs, warehouse KPIs, digital supply chain KPIs, 1200 KPIs, supply chain scorecard, KPI examples, supply chain templates, Corporate Finance SOPs, Finance SOP Excel Template, CFO Toolkit, Finance Department Procedures, Financial Planning SOPs, Treasury SOPs, Accounts Payable SOPs, Accounts Receivable SOPs, General Ledger SOPs, Accounting Policies Template, Internal Controls SOPs, Finance Process Standardization, Finance Operating Procedures, Finance Department Excel Template, FP&A Process Documentation, Corporate Finance Template, Finance SOP Toolkit, CFO Process Templates, Accounting SOP Package, Tax Compliance SOPs, Financial Risk Management Procedures.
NOTE: Our digital products are sold on an "as is" basis, making returns and refunds unavailable post-download. Please preview and inquire before purchasing. Please contact us before purchasing if you have any questions! This policy aligns with the standard Flevy Terms of Usage.
Got a question about the product? Email us at support@flevy.com or ask the author directly by using the "Ask the Author a Question" form. If you cannot view the preview above this document description, go here to view the large preview instead.
Source: Best Practices in Oil & Gas Excel: Oil and Gas Company 12-Month Profit and Loss (P&L) Dashboard Excel (XLSX) Spreadsheet, SB Consulting
ABOUT THE AUTHOR
SB Consulting is dedicated to empowering businesses to communicate their ideas with impact. This consulting firm specializes in teaching organizations how to create effective corporate and management presentations. With training from top-tier global consulting firms, including McKinsey, BCG, and Porsche Consulting, extensive expertise in presentation design and ... [read more]
Ask the Author a Question
You must be logged in to contact the author.
