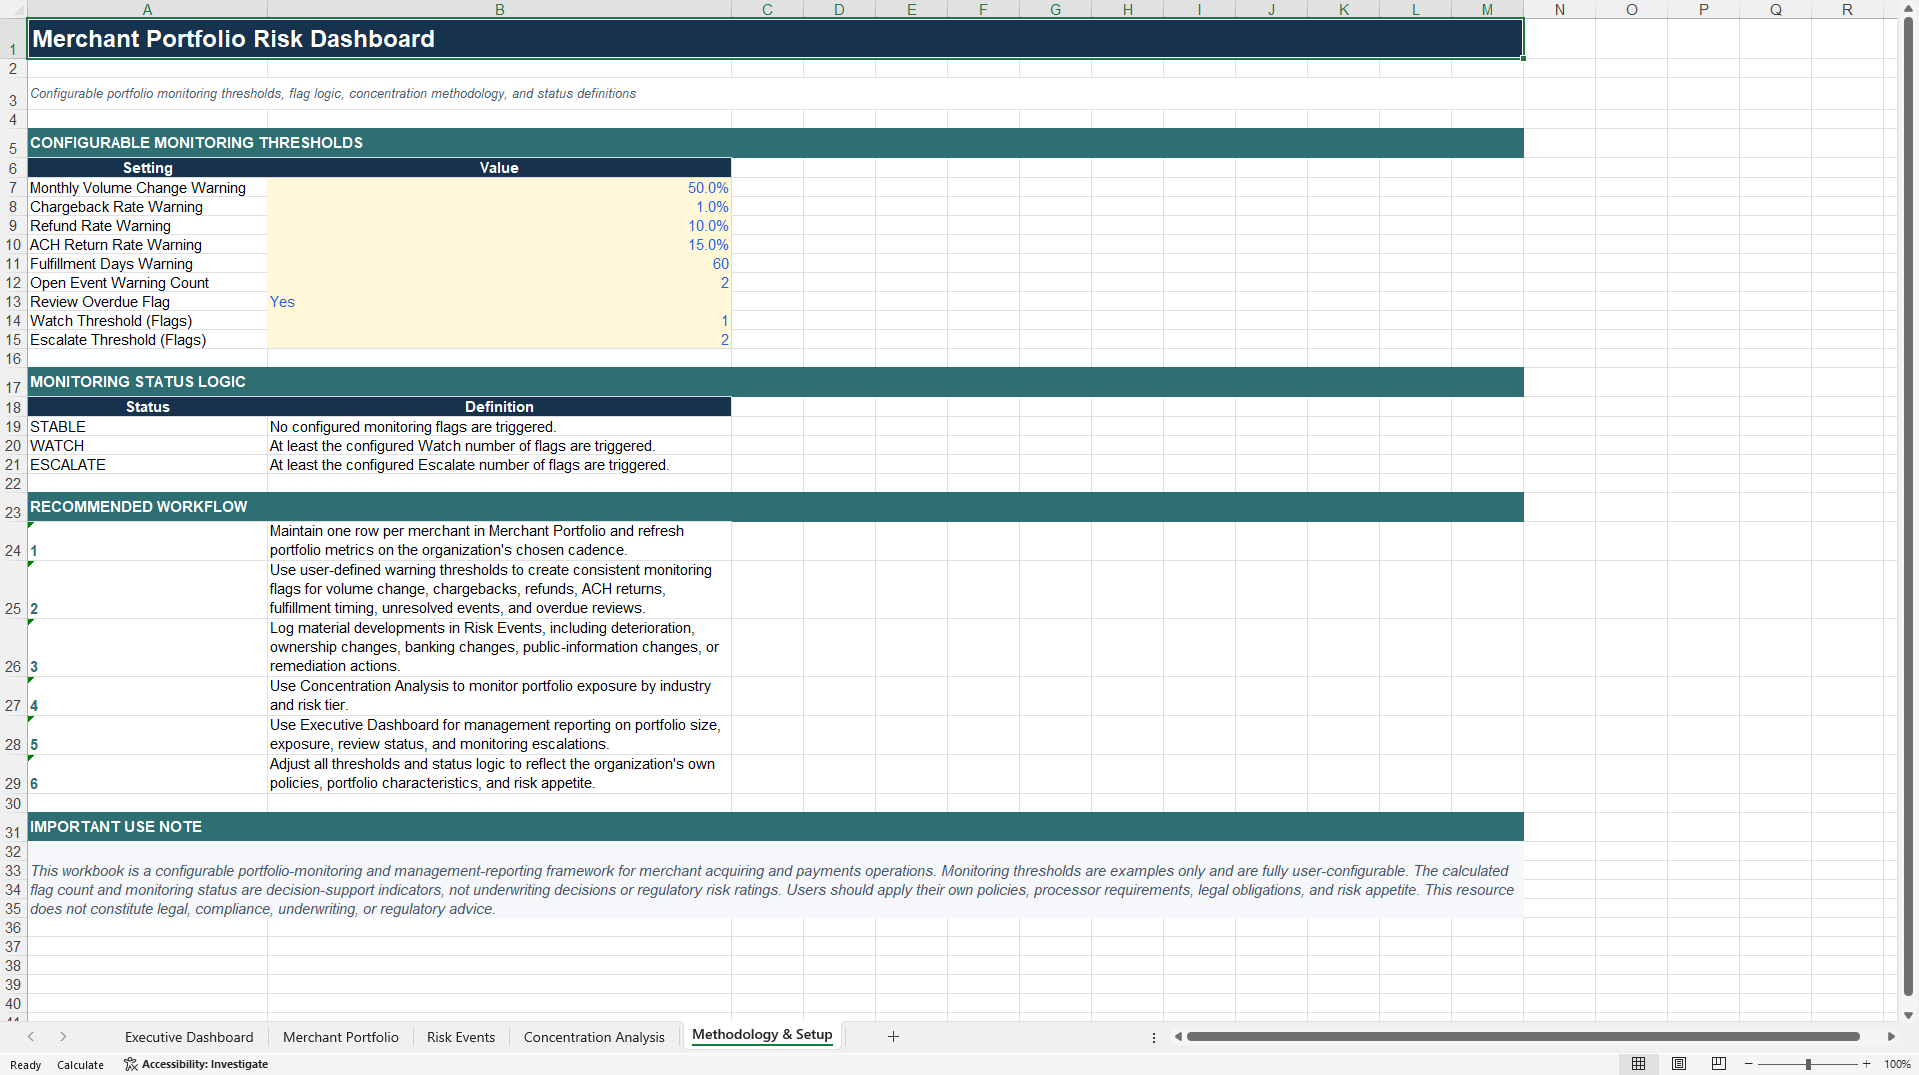

 Click main image to view in full screen.
Merchant Portfolio Risk Dashboard – Excel XLSX
Excel (XLSX)


BENEFITS OF THIS DOWNLOADABLE EXCEL DOCUMENT
- Provides an executive-level view of merchant portfolio risk, processing volume, review status, unresolved events, reserves, and monitoring escalations.
- Automatically converts configurable merchant-level risk indicators into Stable, Watch, and Escalate monitoring statuses for more consistent portfolio oversight.
- Includes portfolio concentration analysis by industry and risk tier to help management identify exposure concentrations and emerging areas of concern.
FINANCIAL RISK EXCEL DESCRIPTION
The Merchant Portfolio Risk Dashboard is a professional portfolio-monitoring and management-reporting tool designed for payment processors, fintech companies, merchant acquirers, payment facilitators, ISOs, underwriting teams, and risk operations leaders responsible for ongoing merchant oversight.
The workbook provides a consolidated view of merchant portfolio performance, operational risk indicators, review cadence, portfolio concentration, open risk events, and configurable monitoring flags.
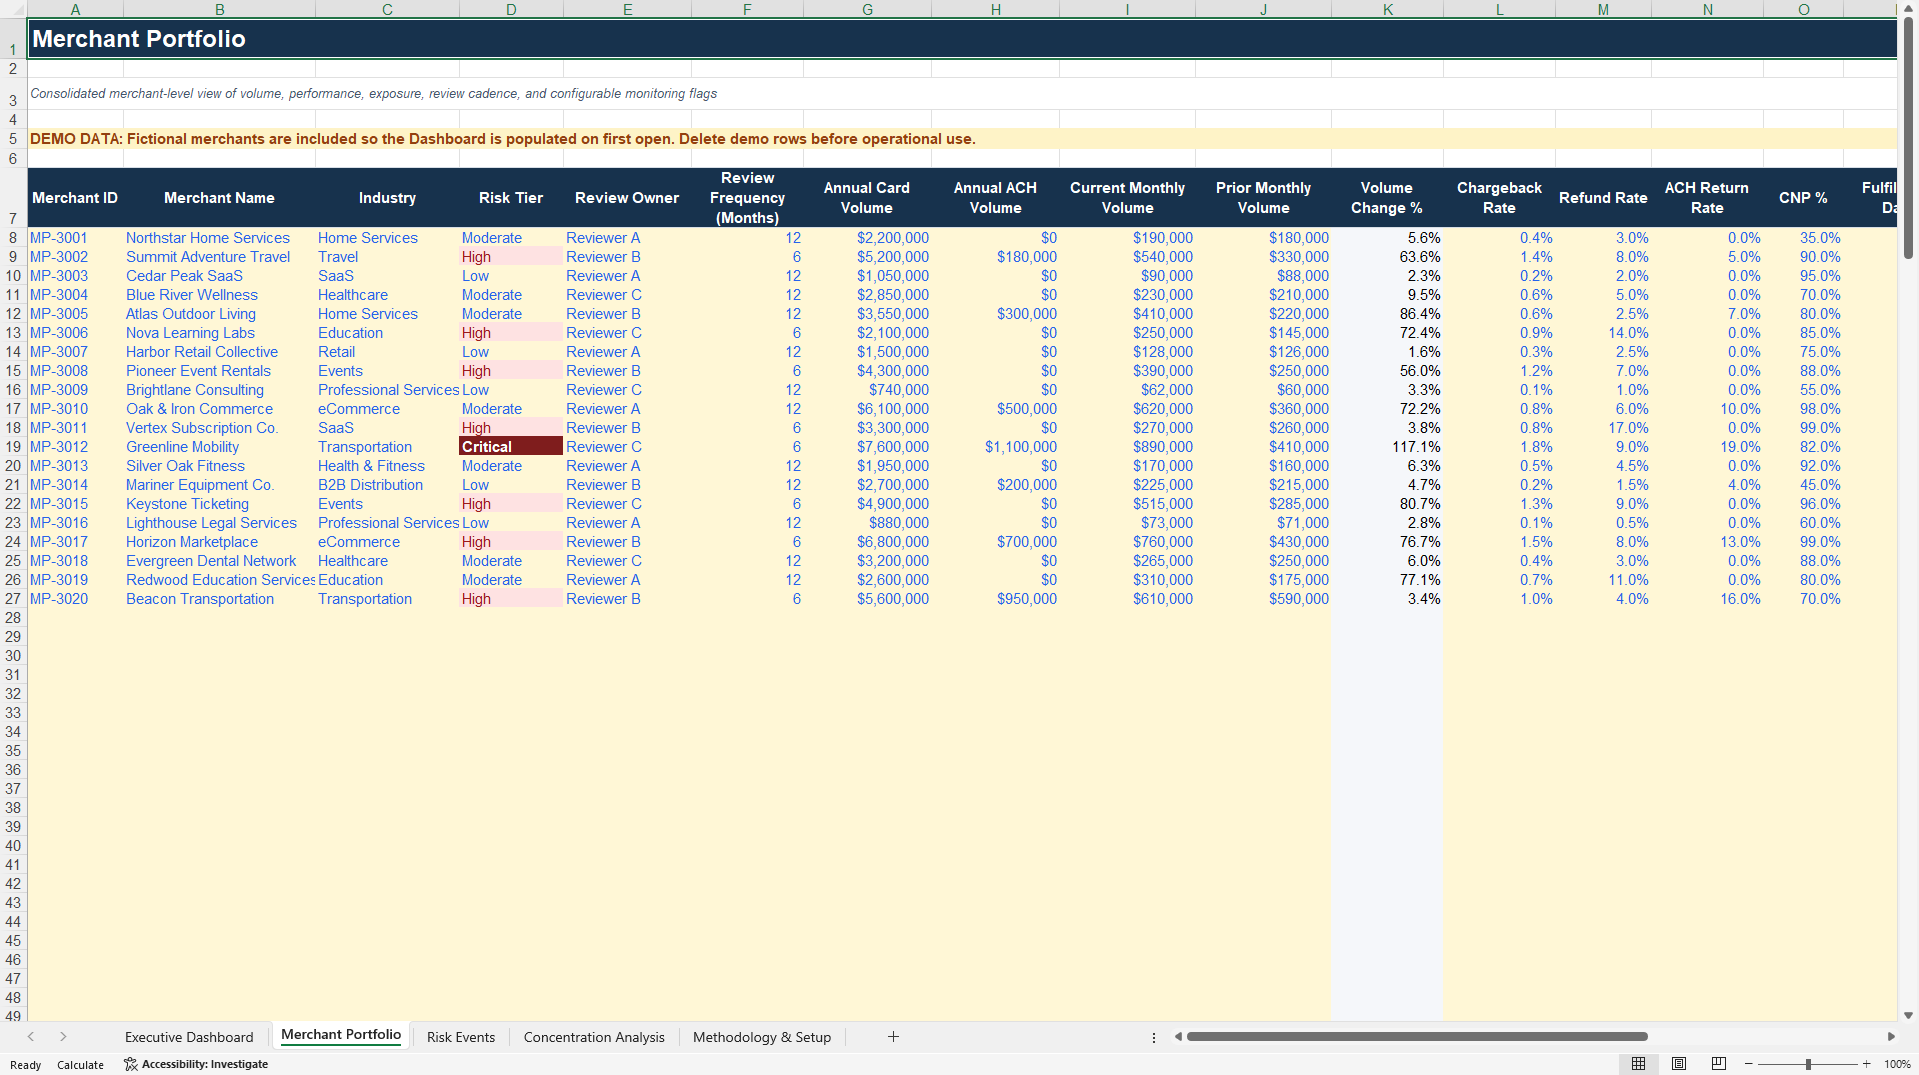
The Merchant Portfolio sheet maintains a centralized record for each merchant, including industry, risk tier, review owner, annual card and ACH volume, current and prior monthly processing volume, month-over-month volume change, chargeback rate, refund rate, ACH return rate, card-not-present mix, fulfillment timing, reserve balance, open risk events, and periodic review dates.
Configurable monitoring thresholds allow organizations to establish their own warning levels for material volume changes, chargeback activity, refunds, ACH returns, fulfillment timing, unresolved events, and overdue reviews. The workbook automatically counts triggered monitoring flags and categorizes merchants as Stable, Watch, or Escalate based on user-defined thresholds.
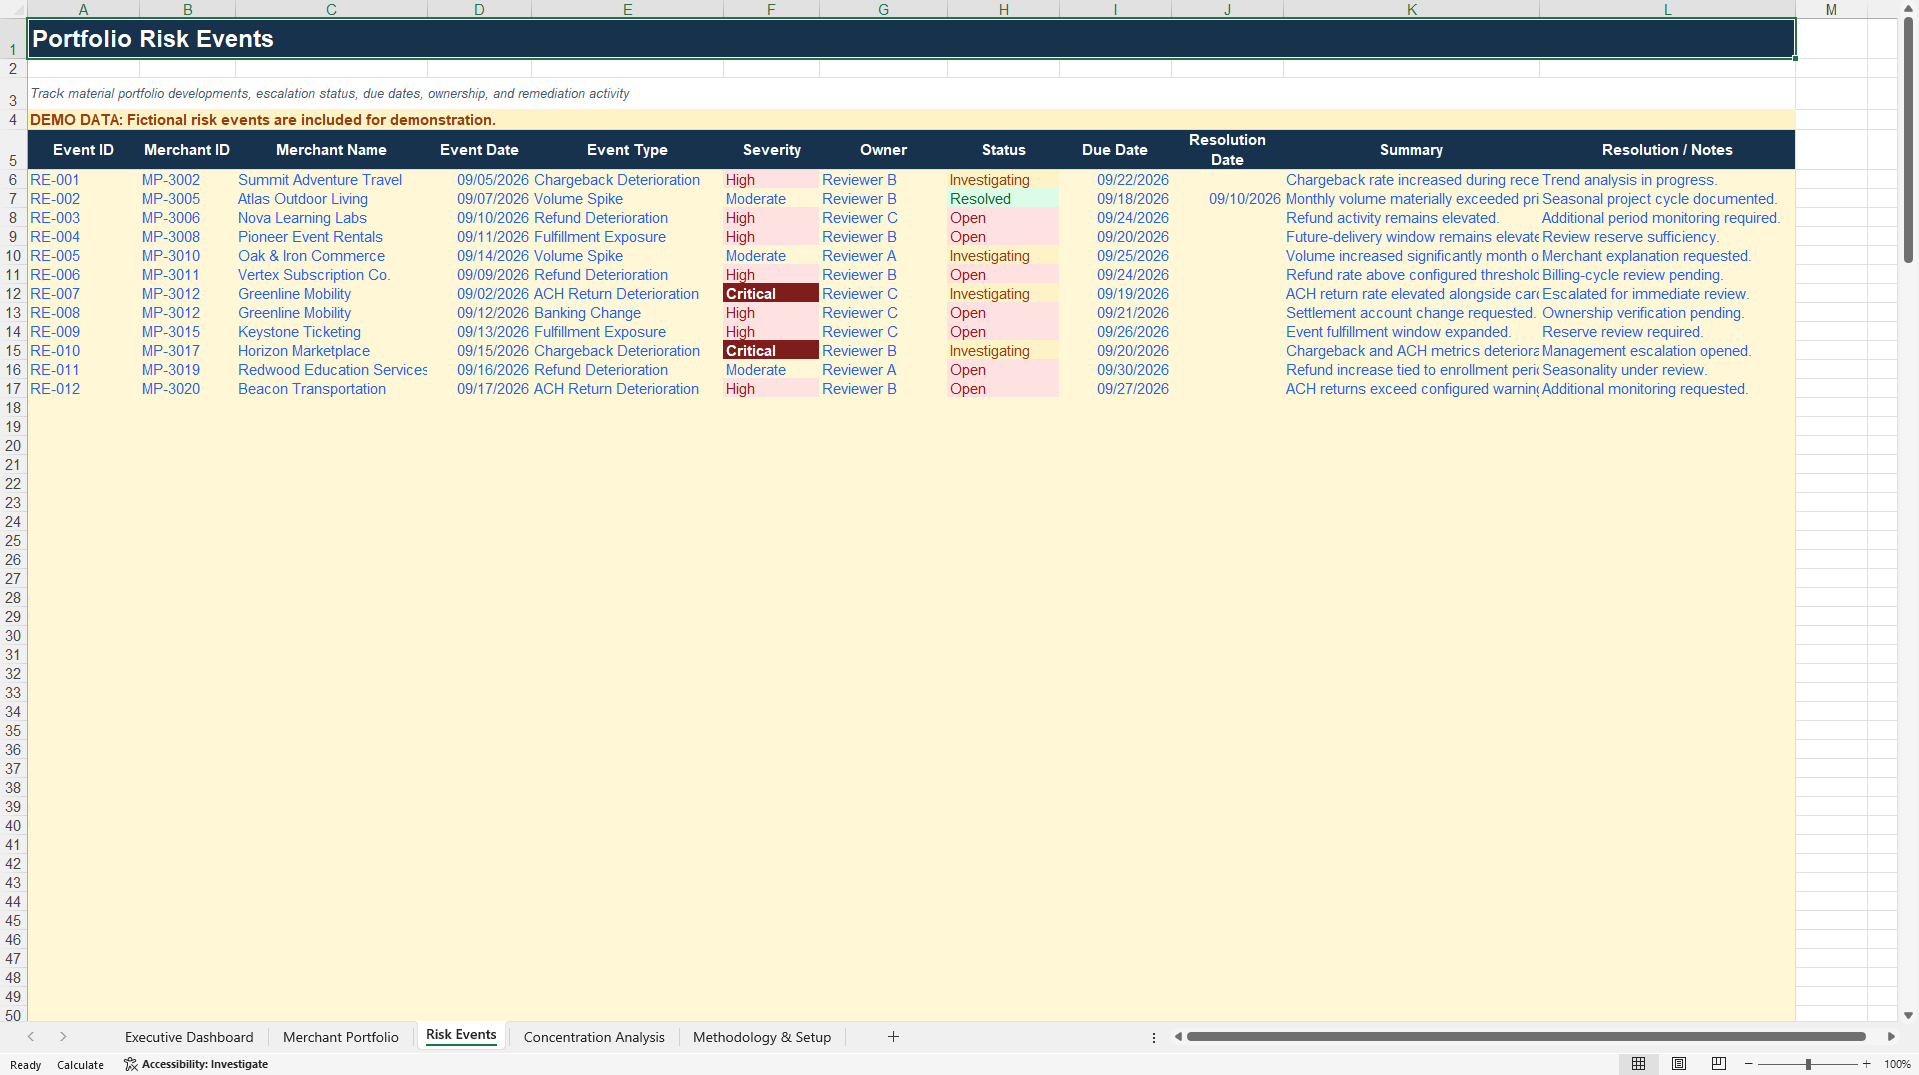
A dedicated Risk Events Log provides a structured way to document material portfolio developments such as chargeback deterioration, refund increases, ACH return issues, unusual volume growth, banking changes, fulfillment exposure, ownership concerns, and other developments requiring investigation or remediation. Events can be assigned by severity, owner, status, due date, and resolution outcome.
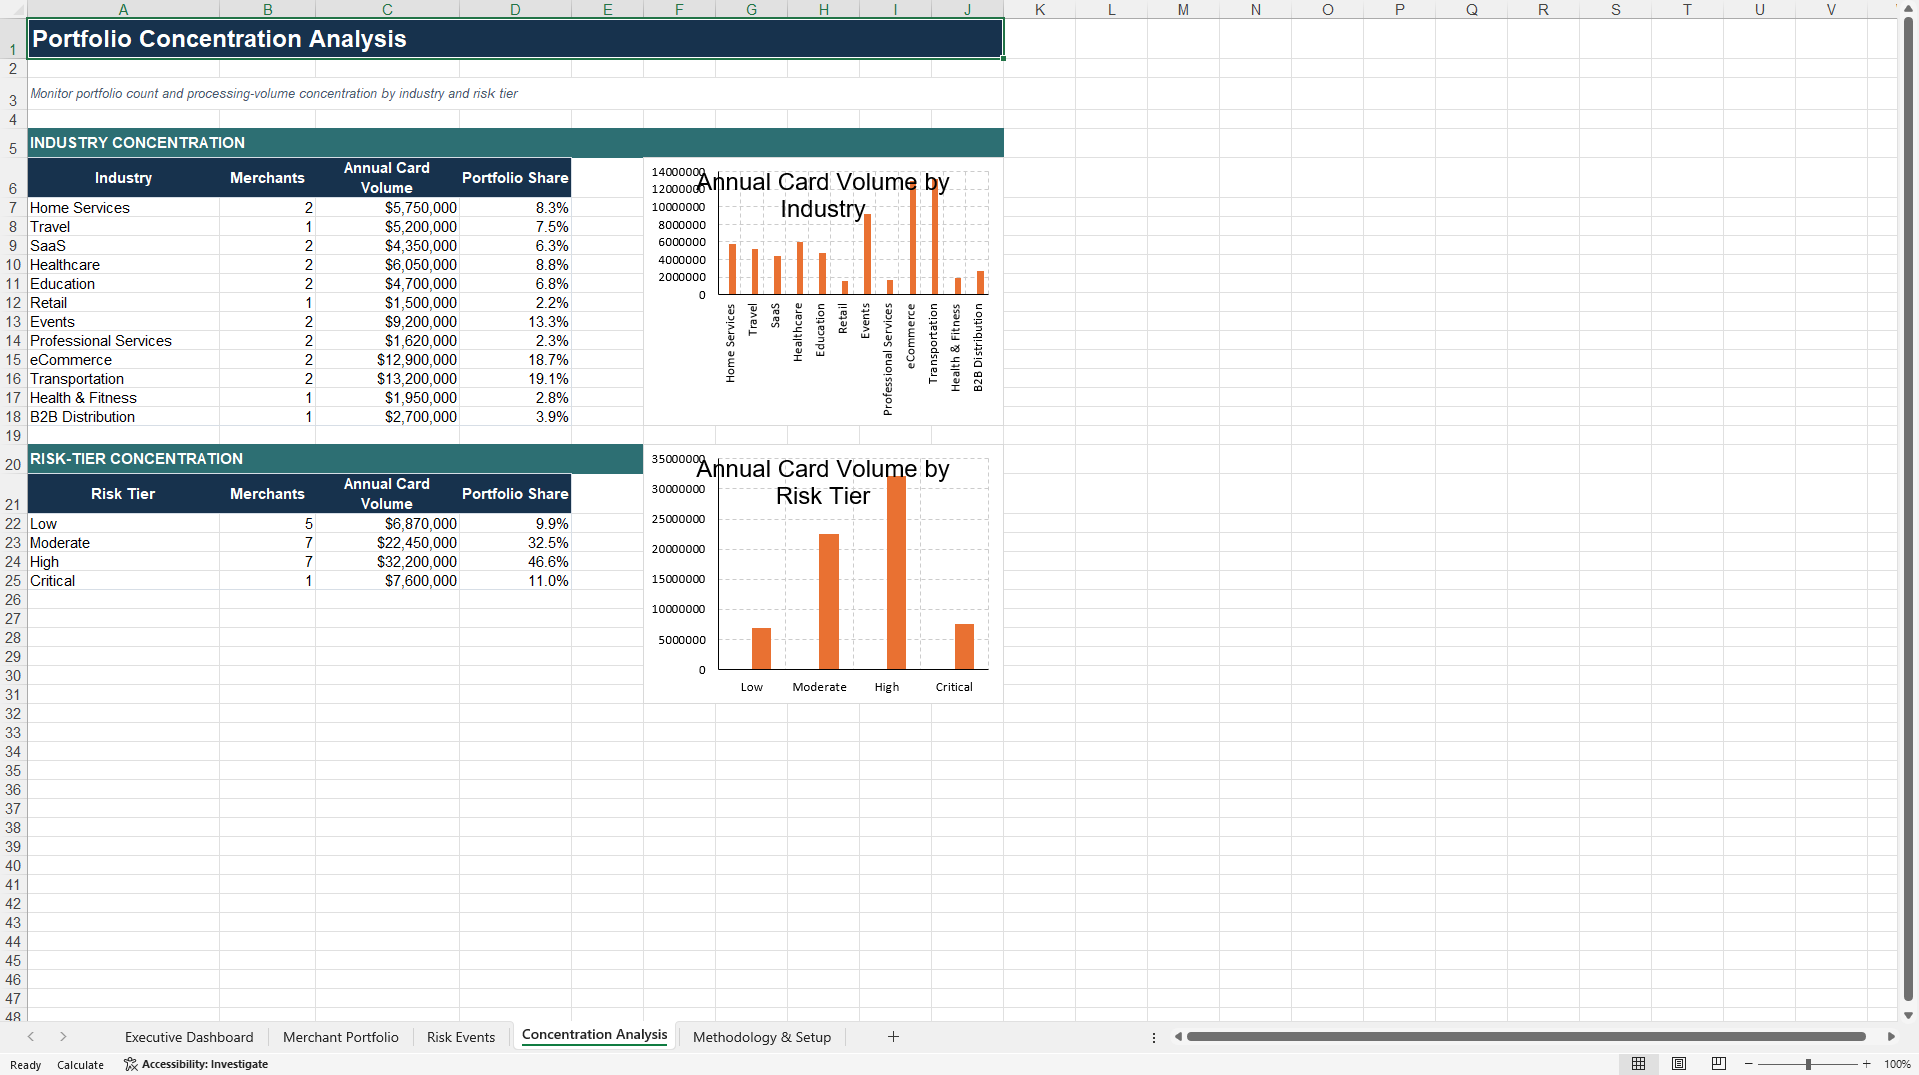
The Concentration Analysis section summarizes merchant count and annual card-processing volume by industry and risk tier, helping management identify areas of portfolio concentration and understand how processing exposure is distributed across the book.
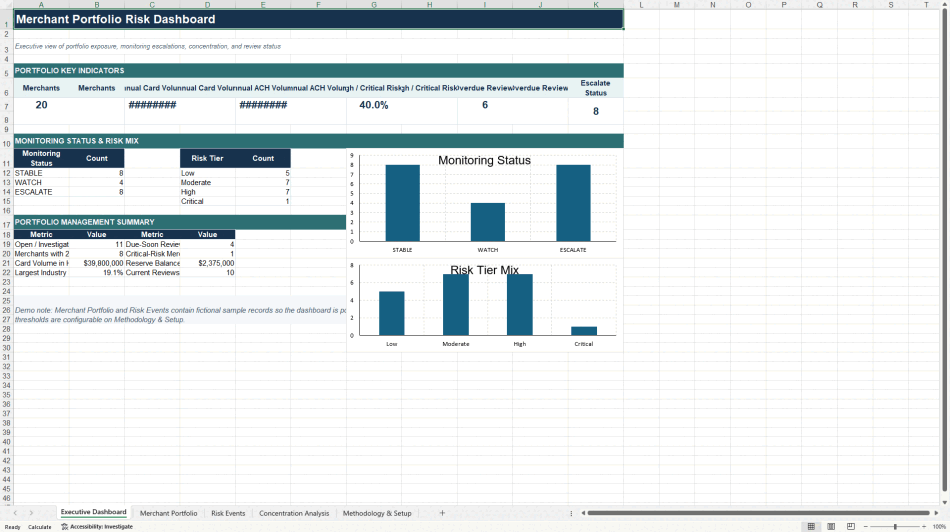
The Executive Dashboard provides a high-level management view of merchant count, annual card and ACH volume, high- and critical-risk concentration, overdue reviews, merchants requiring escalation, unresolved risk events, reserve balances, review status, and monitoring-status distribution.
Fictional demonstration data for 20 merchants is included so users can immediately see how the dashboard, monitoring flags, risk-event tracking, and concentration reporting work. Demo records can be removed before operational use.
This workbook is intentionally configurable and does not impose a specific underwriting policy or risk appetite. Monitoring thresholds, escalation logic, review cadence, and risk classifications should be adapted to the organization's own policies, processor requirements, regulatory obligations, portfolio characteristics, and management standards.
The calculated monitoring status is intended as a decision-support indicator rather than an underwriting decision or regulatory risk classification. This resource does not constitute legal, regulatory, compliance, accounting, or underwriting advice.
Got a question about the product? Email us at support@flevy.com or ask the author directly by using the "Ask the Author a Question" form. If you cannot view the preview above this document description, go here to view the large preview instead.
Source: Best Practices in Financial Risk, Portfolio Management Excel: Merchant Portfolio Risk Dashboard Excel (XLSX) Spreadsheet, MintedTools | Scott Kwidzinski
ABOUT THE AUTHOR

Scott Kwidzinski is a payments and fintech operations professional with 6+ years of leadership experience across merchant underwriting, risk operations, quality assurance, and process improvement.
He has led underwriting and risk teams of up to 19 professionals, with hands-on experience evaluating merchant risk, analyzing card and ACH exposure, reviewing financial and banking documentation,
... [read more]
Ask the Author a Question
You must be logged in to contact the author.




























