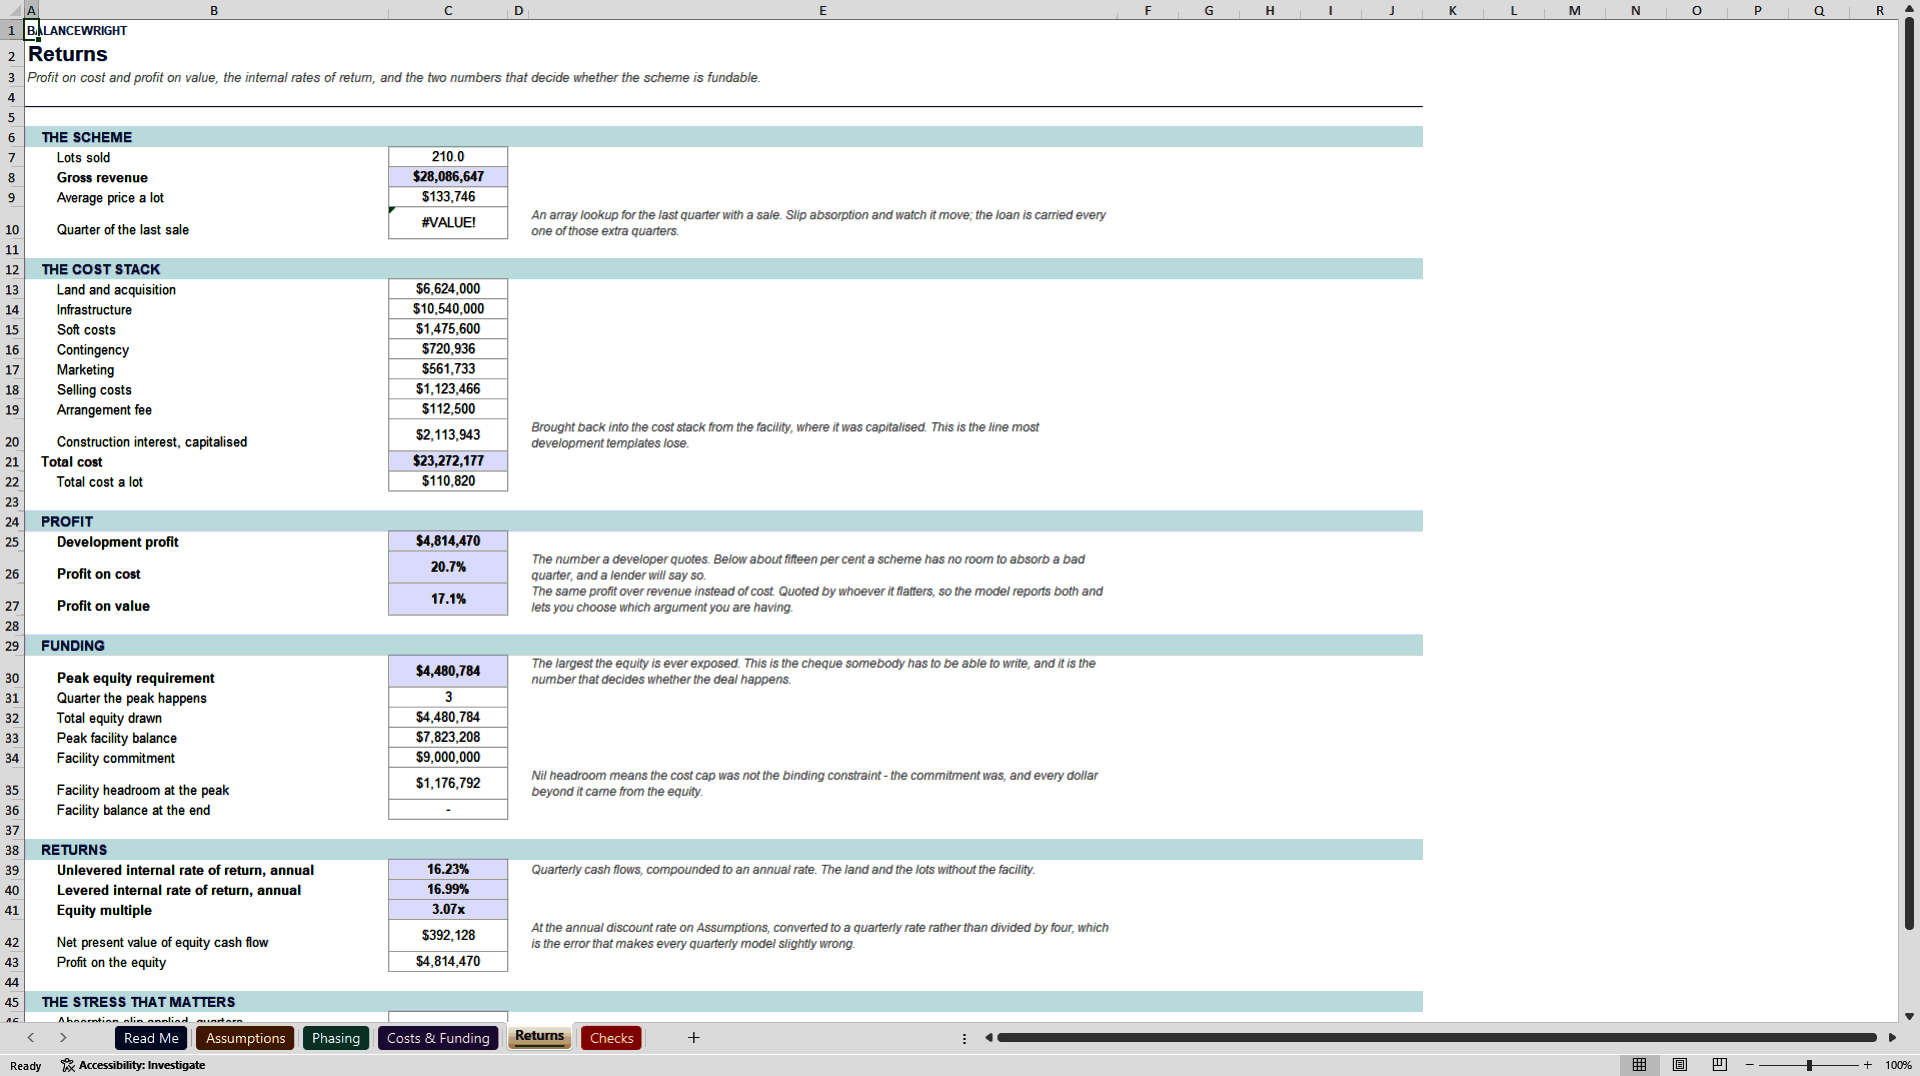

 Click main image to view in full screen.
Land Development & Subdivision Model with Construction Loan – Excel XLSX
Excel (XLSX) + supplemental PDF


BENEFITS OF THIS DOWNLOADABLE EXCEL DOCUMENT
- See the peak equity requirement and the exact quarter it happens - the cheque somebody has to write, not just the margin at the end.
- Stress absorption from one cell: slip every phase up to four quarters, or cut lots sold per quarter, and watch the interest reserve, peak equity and levered return move.
- Construction interest charged on the opening balance, capitalised into the loan and shown as its own line in the cost stack - with 18 built-in checks that all have to read nil.
REAL ESTATE EXCEL DESCRIPTION
Most subdivision templates are a revenue line, a cost line and a difference. They give you a margin, and the margin is usually about right. What they do not give you are the two numbers a scheme actually lives or dies on: how much cash the equity has to have in the ground at the worst moment, and what happens to all of it when the lots sell more slowly than the promoter says they will.
This workbook answers both on the face of the file.
WHAT IT DOES
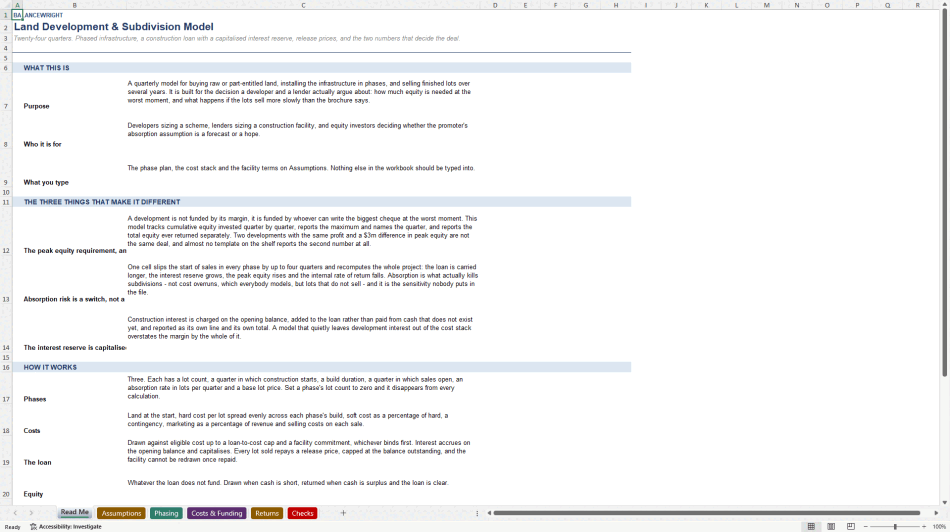
Buys raw or part-entitled land, installs infrastructure in three phases, sells finished lots over twenty-four quarters, and funds the whole thing with a construction facility drawn against eligible cost. Six tabs, 1,326 live formulas, eighteen built-in checks, and a worked scheme loaded and balancing the moment you open it.
THE THREE THINGS THAT MAKE IT DIFFERENT
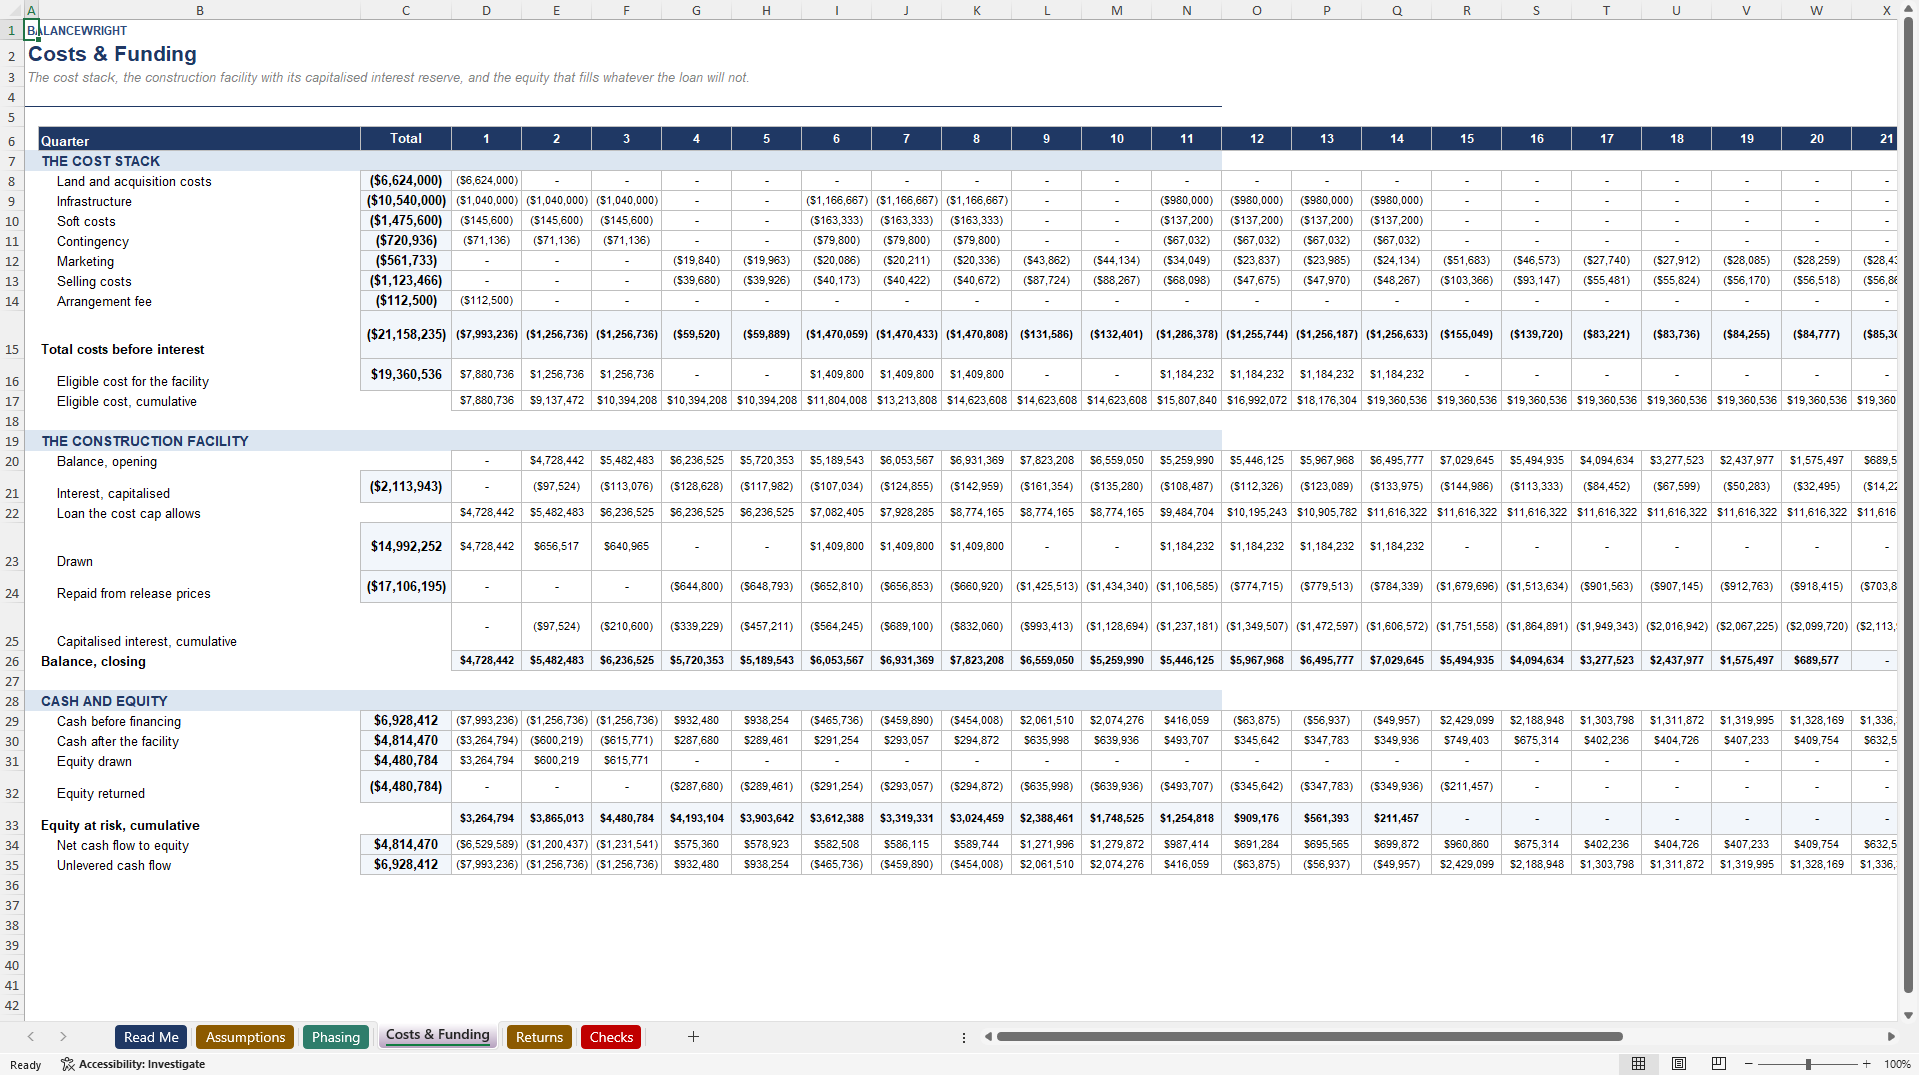
1. The peak equity requirement, and the quarter it happens in. A development is not funded by its margin. It is funded by whoever can write the biggest cheque at the worst moment. The model tracks cumulative equity invested less capital returned in every quarter, reports the maximum, and names the quarter. In the worked scheme that is $4.48m in quarter three, against $4.81m of profit over six years. Anyone who cannot fund the first number does not get the second.
2. Absorption risk is a switch, not a footnote. Two cells on the Assumptions tab. One slips the opening of every phase by up to four quarters; the other cuts the lots sold per quarter without moving the dates. Slip the worked scheme by two quarters and the levered return falls from 16.99 per cent to 11.0 per cent, the interest reserve grows from $2.11m to $2.52m, and the peak equity rises to $5.15m. One keystroke, and you know whether you have a deal or a story.
3. The interest reserve is capitalised, and it is visible. Construction interest is charged on the opening balance, added to the loan rather than paid out of cash that does not exist yet, and reported as its own line in the cost stack. In the worked scheme that is $2.11m – nine per cent of total cost, and the line most development templates lose entirely. Because it is charged on the opening balance there is no circular reference anywhere in the file and iterative calculation stays off.
THE FACILITY, PROPERLY MODELLED
The draw each quarter is the smallest of three things: what the loan-to-cost cap still allows, what is left of the commitment, and the eligible cost incurred that quarter. Eligible means land, acquisition, infrastructure, soft costs and contingency – not marketing, not selling costs, not capitalised interest, which is the usual market position and the reason a facility sized off total cost is always too big. Repayment is the release price, a share of each lot price, capped at the balance outstanding. Set the release share too low and check 11 fails because the loan is still outstanding when the last lot goes; too high and the developer sees no cash until the end.
The loan-to-cost cap is tested against principal drawn, not against the raw balance, because the cap applies to money drawn against cost and not to the interest the facility rolls up on itself. A model that tests the raw balance fails as soon as the scheme slips, and that failure tells you nothing.
WHAT IS IN THE FILE
Read Me – what the model is, who it is for, and the conventions it uses.
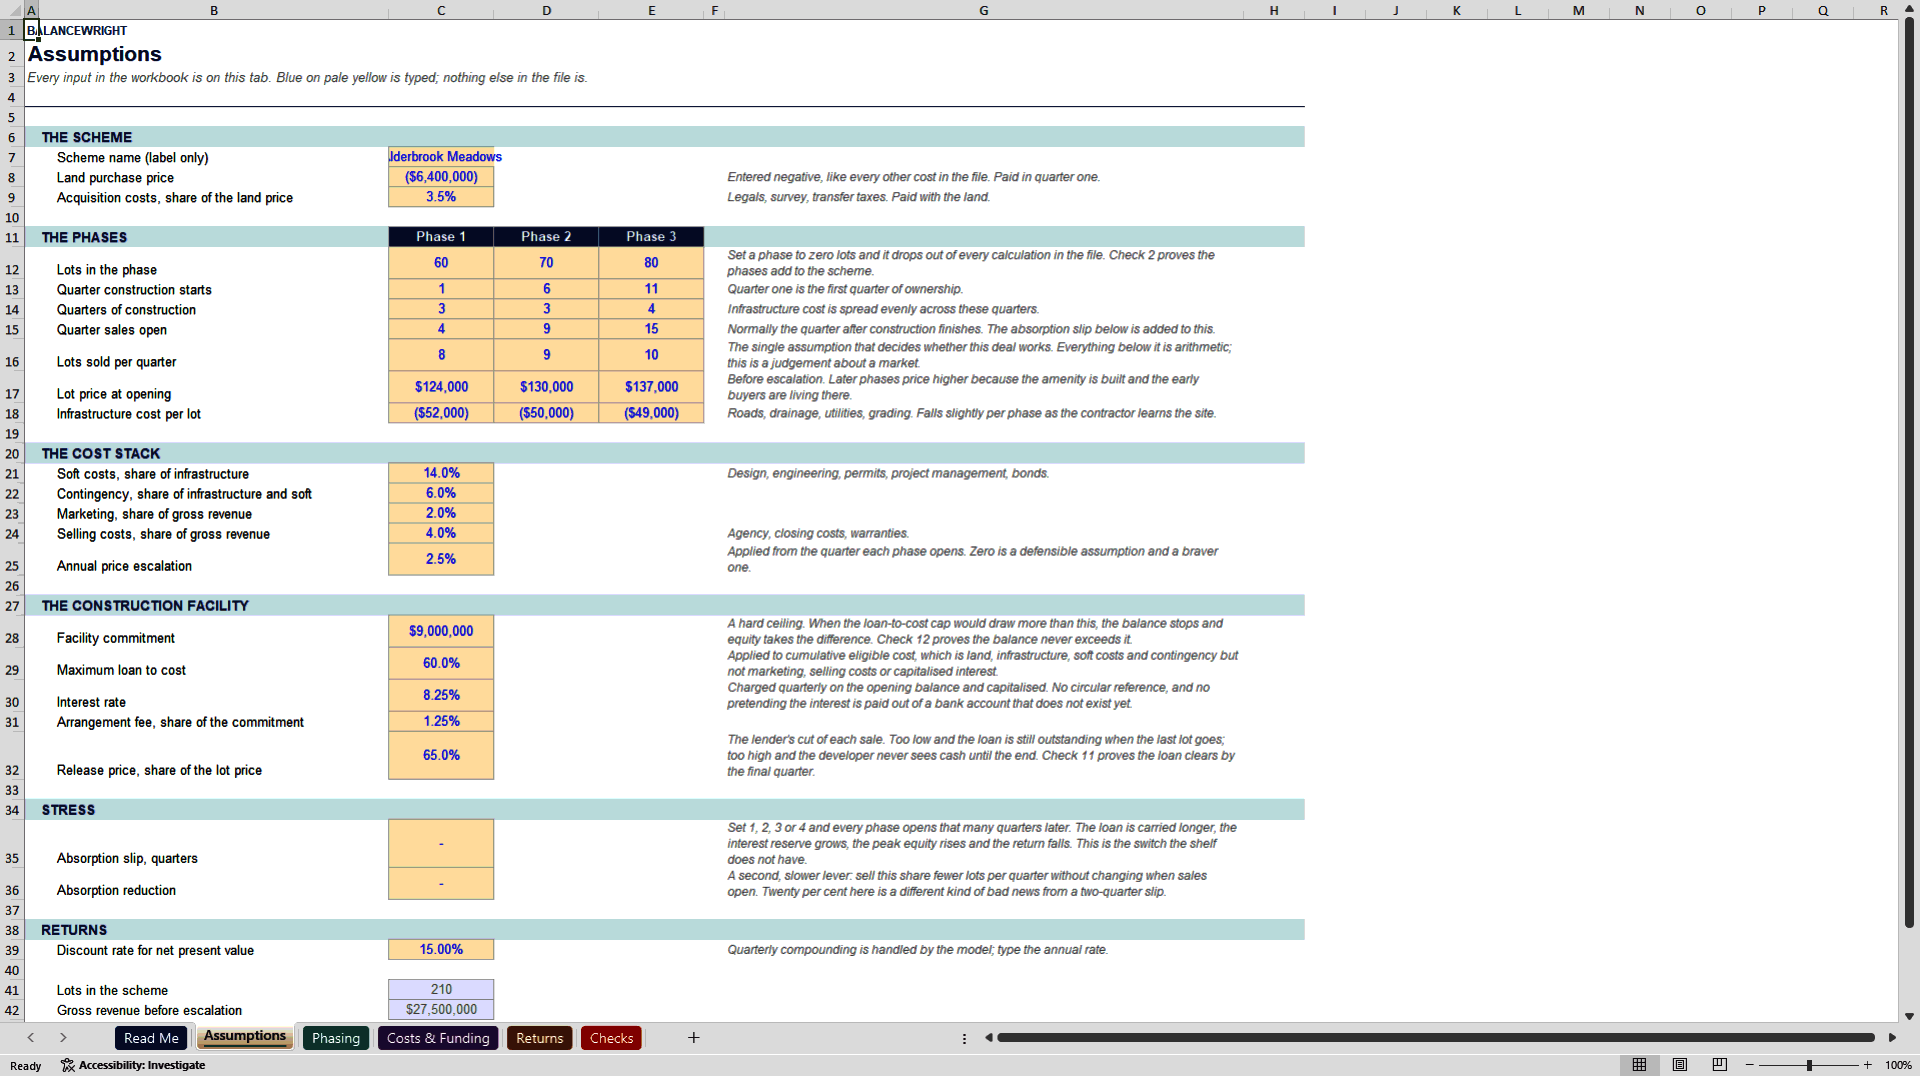
Assumptions – every input in the workbook, on one tab: the phase plan, the cost stack, the facility terms, two stress levers and the discount rate.
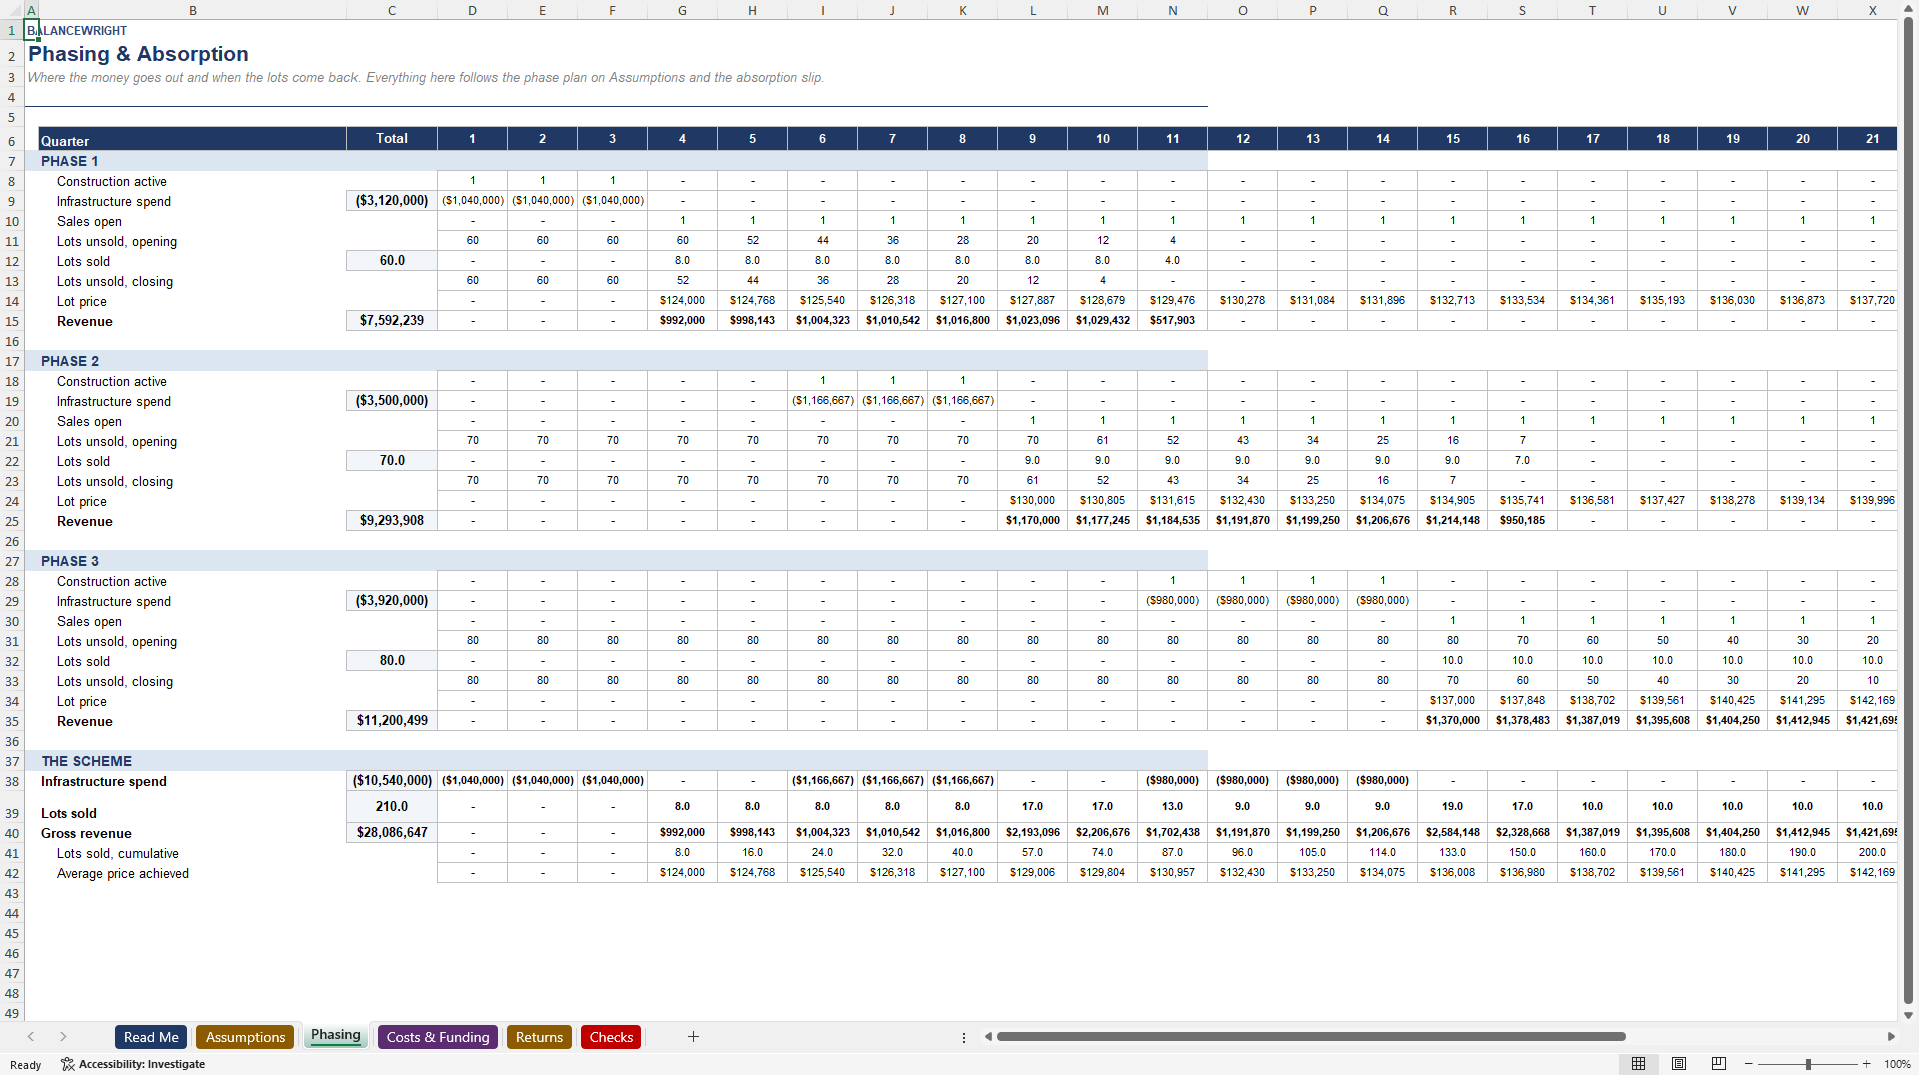
Phasing & Absorption – three phases, twenty-four quarters. Lots remaining, lots sold, escalated lot price and revenue, phase by phase.
Costs & Funding – the cost stack quarter by quarter, the facility with its capitalised interest reserve, and the equity that fills whatever the loan will not.
Returns – profit on cost and profit on value side by side, unlevered and levered internal rates of return on quarterly cash flows, the equity multiple, net present value, and the funding block: peak equity, the quarter it happens, peak facility balance, headroom at the peak and the balance at the end.
Checks – eighteen tests, each measuring a number that must be nil or a condition that must hold in every one of the twenty-four quarters.
THE CHECKS
Every lot sold inside the horizon. Each phase sells exactly its own lot count. Lots unsold never negative. No lot sold before its phase opens. Infrastructure spend equal to the phase plan. Every cost line an outflow. Total cost equal to the sum of its eight components. Revenue equal to lots sold times the price achieved. The facility never negative, never above the commitment, never redrawn after it is repaid, clear by the final quarter. Principal drawn never above the loan-to-cost cap. Interest equal to the rate on the opening balance. Equity at risk never negative. Cash never negative after the facility and the equity. Sources equal to uses across the whole scheme. Profit equal to revenue less every cost including the interest.
All eighteen were independently re-derived in 86 separate comparisons against a second, from-scratch implementation of the entire scheme, with both internal rates of return recomputed by bisection rather than by calling Excel.
THE WORKED EXAMPLE
Alderbrook Meadows. 210 lots in three phases of 60, 70 and 80. Land at $6.4m. Infrastructure from $52,000 to $49,000 a lot. Lot prices from $124,000 to $137,000 with 2.5 per cent annual escalation. A $9m facility at 8.25 per cent, 60 per cent loan to cost, 65 per cent release price.
Revenue $28.09m. Total cost $23.27m including $2.11m of capitalised interest. Development profit $4.81m. Profit on cost 20.7 per cent, profit on value 17.1 per cent. Peak equity $4.48m in quarter three. Peak facility $7.82m against a $9m commitment, clear by the end. Unlevered return 16.23 per cent, levered 16.99 per cent, equity multiple 3.07 times.
WHAT IT IS NOT
It is not a vertical construction model – it sells finished lots, not houses. It is not an entitlement model – zoning and impact-fee negotiation sit before this workbook. It is not a joint-venture waterfall – one equity, no promote, no tiers. It does not model a revolving facility, and check 10 enforces that. It has no tax, because the right treatment depends on the vehicle and pretending otherwise is worse than leaving it out.
FORMAT
One Microsoft Excel workbook (.xlsx). Opens in Excel 2016 and later, Microsoft 365, LibreOffice Calc, Apple Numbers and Google Sheets. No macros, no add-ins, no external links, no password protection, no locked cells, iterative calculation off. Blue on pale yellow is an input; nothing else in the file should be typed into. A guide and preview PDF is included.
Got a question about the product? Email us at support@flevy.com or ask the author directly by using the "Ask the Author a Question" form. If you cannot view the preview above this document description, go here to view the large preview instead.
Source: Best Practices in Real Estate, Financial Modeling Excel: Land Development & Subdivision Model with Construction Loan Excel (XLSX) Spreadsheet, Balancewright
ABOUT THE AUTHOR

Balancewright builds working financial models for subscription and recurring-revenue businesses -- cohort retention, revenue movement, unit economics, cash flow and scenario forecasting.
Every model is formula-driven end to end. No locked cells, no passwords, no macros and no external links, so any calculation can be inspected, adapted and audited. Each file ships with a visible
... [read more]
Ask the Author a Question
You must be logged in to contact the author.




























