
BENEFITS OF THIS DOWNLOADABLE EXCEL DOCUMENT
- Organizes complex process brainstorming data into the standardized six industrial categories of the Ishikawa framework.
- Bridges structural brainstorming models directly with five-level iterative questioning logs to identify root failure causes.
- Secures process remediation milestones using an integrated task execution and ownership status tracker in dark mode.
FISHBONE DIAGRAM EXCEL DESCRIPTION
Conducting rigorous operational diagnostics and establishing bulletproof preventative countermeasures requires a highly structured, visually coherent causal tracking framework. Across modern engineering and business landscapes—such as Lean Six Sigma workflows, ISO-certified manufacturing hubs, and fast-paced supply chain networks—recurring quality deviations often trigger superficial operational fixes because teams focus purely on outward symptoms. Without a centralized, systematic architecture to organize potential failure pathways across core industrial dimensions, corporate problem solvers run the risk of misallocating resources to secondary issues while leaving the true systemic failure points entirely unmitigated.
The Ishikawa Fishbone Root Cause Analysis Excel Template is an executive-grade operational excellence and quality management framework engineered specifically for Six Sigma Black Belts, Plant Managers, Continuous Improvement Engineers, and Supply Chain Consultants. Derived directly from classic industrial engineering methodologies, this fully interactive tool establishes an automated environment to trace process deviances back to their exact source. By linking qualitative brainstorming categories seamlessly with a downstream task tracker, this template delivers immediate, boardroom-ready clarity to high-stress problem-solving cycles.
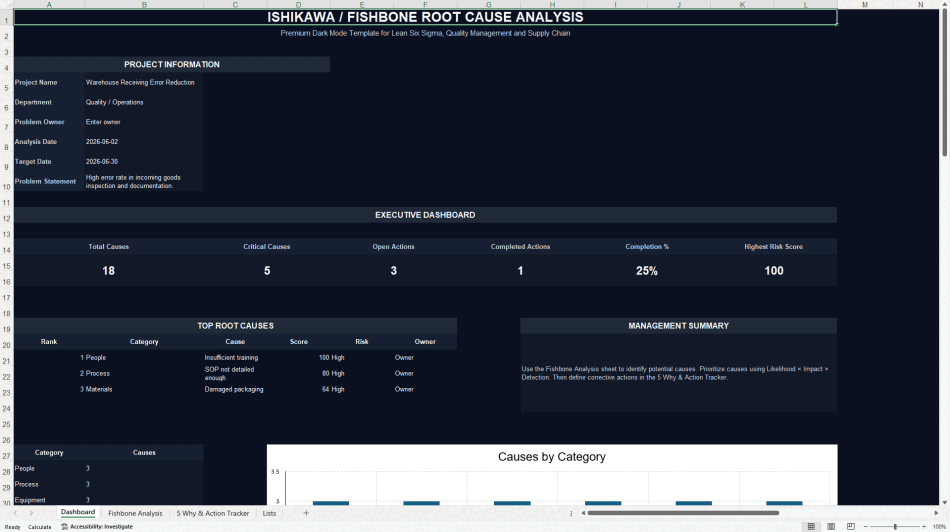
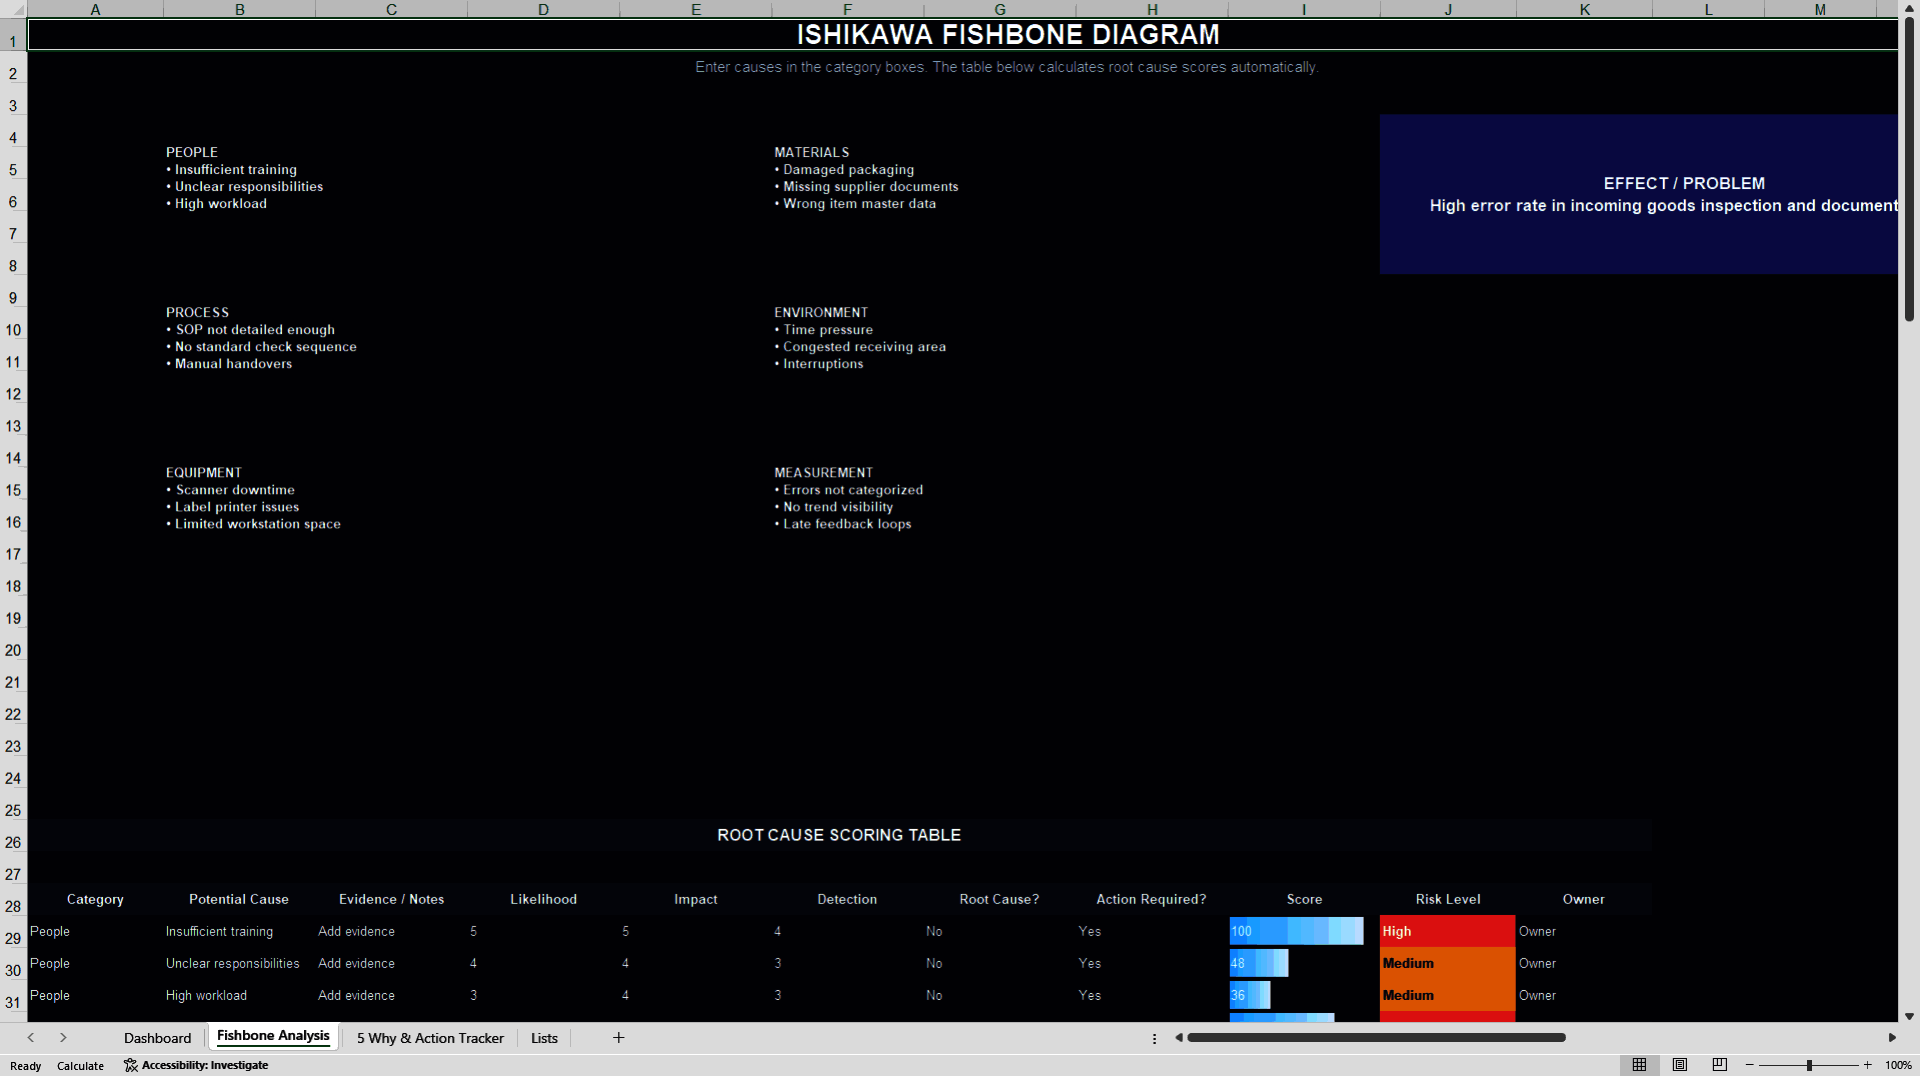
The structural design of the model coordinates data through distinct operational phases distributed over specialized registers. The process begins on the Dashboard, where users establish baseline project meta-data, documenting functional owners, target timelines, and precise problem statements. Moving into analytical mapping, the Fishbone Analysis layout provides a dedicated visual workspace categorized around the classic industrial 6M model nodes, including People, Process, Materials, Equipment, Environment, and Measurement variables. This interactive canvas captures group brainstorming points and applies mathematical weight parameters to isolate priority failure vectors automatically.
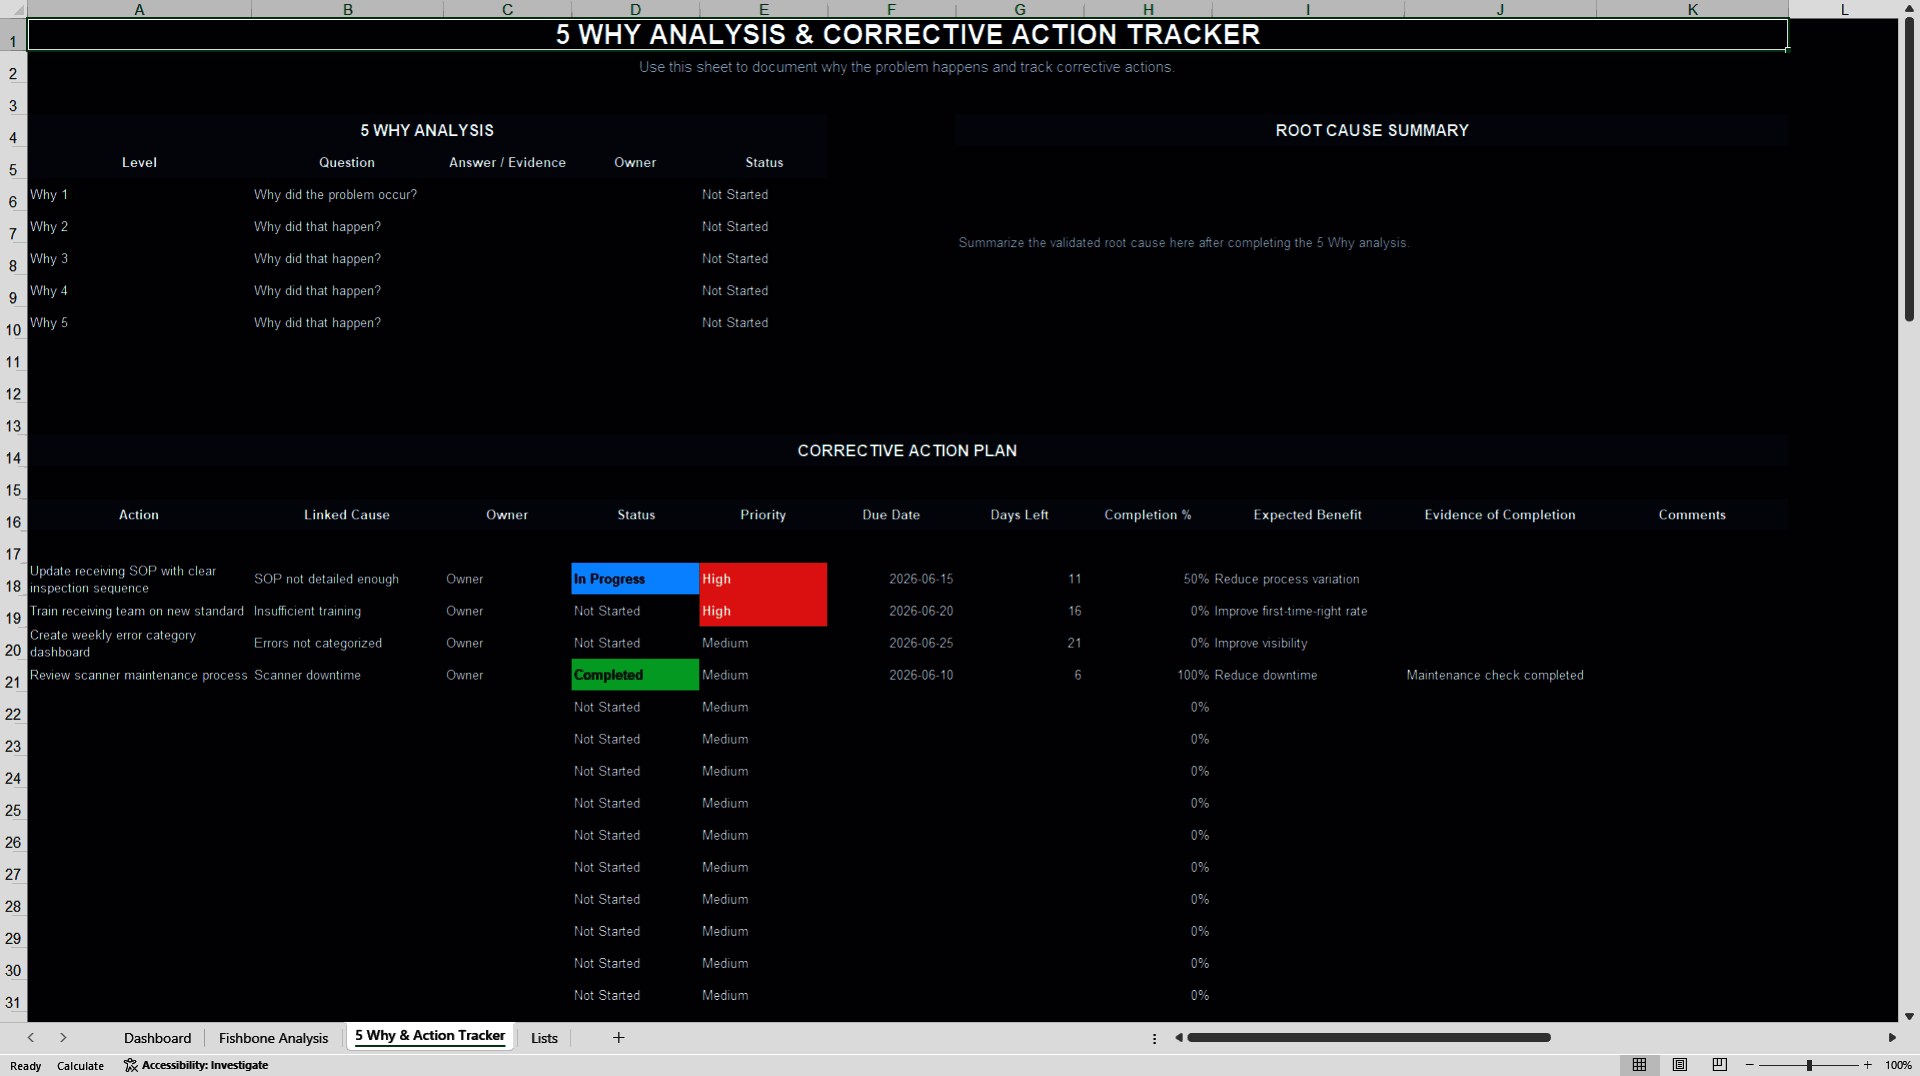
Following primary cause isolation, the 5 Why & Action Tracker workbook drives deep root-cause verification using consecutive iterative questioning lanes. This analytical drill-down integrates a full corrective action tracker to record dedicated action items, manage clear ownership, and display dynamic milestone progress dropdowns.
Got a question about the product? Email us at support@flevy.com or ask the author directly by using the "Ask the Author a Question" form. If you cannot view the preview above this document description, go here to view the large preview instead.
Source: Best Practices in Fishbone Diagram Excel: Ishikawa Fishbone Root Cause Analysis Excel Template Excel (XLSX) Spreadsheet, g54219585o85
