
Generic Monthly 5-Year 3 Statement Rolling Financial Projection Model with Scenario Analysis – Excel XLSX
Excel (XLSX) + Excel (XLSX)
VIDEO DEMO
BENEFITS OF THIS DOWNLOADABLE EXCEL DOCUMENT
- Preparation of a monthly financial projection with scenario analysis for a new or existing business.
INTEGRATED FINANCIAL MODEL EXCEL DESCRIPTION
A Generic Monthly 3-Statement Rolling Financial Projection is crucial for businesses. It provides real-time insights into cash flows, income, and balance sheets, aiding in proactive financial management. This model helps in tracking performance against budgets, adjusting strategies, and identifying potential issues promptly. It's invaluable for decision-making, as it enables informed choices based on current financial data. Investors and lenders gain confidence in a company's financial stability. Overall, it ensures financial health, enhances responsiveness to market changes, and supports sound fiscal decision-making for sustainable business growth.
PURPOSE OF TOOL
Highly versatile and user-friendly Excel model for the preparation a of 5-year rolling 3 statement (Income Statement, Balance Sheet and Cash flow Statement) financial projection with a monthly timeline across 3 scenarios for a generic new or existing business. The model allows businesses to plan for uncertainty.
The model follows good practice financial modelling principles and includes instructions, line item explanations, checks and input validations.
KEY OUTPUTS
The model is generic and not industry-specific. The key outputs include:
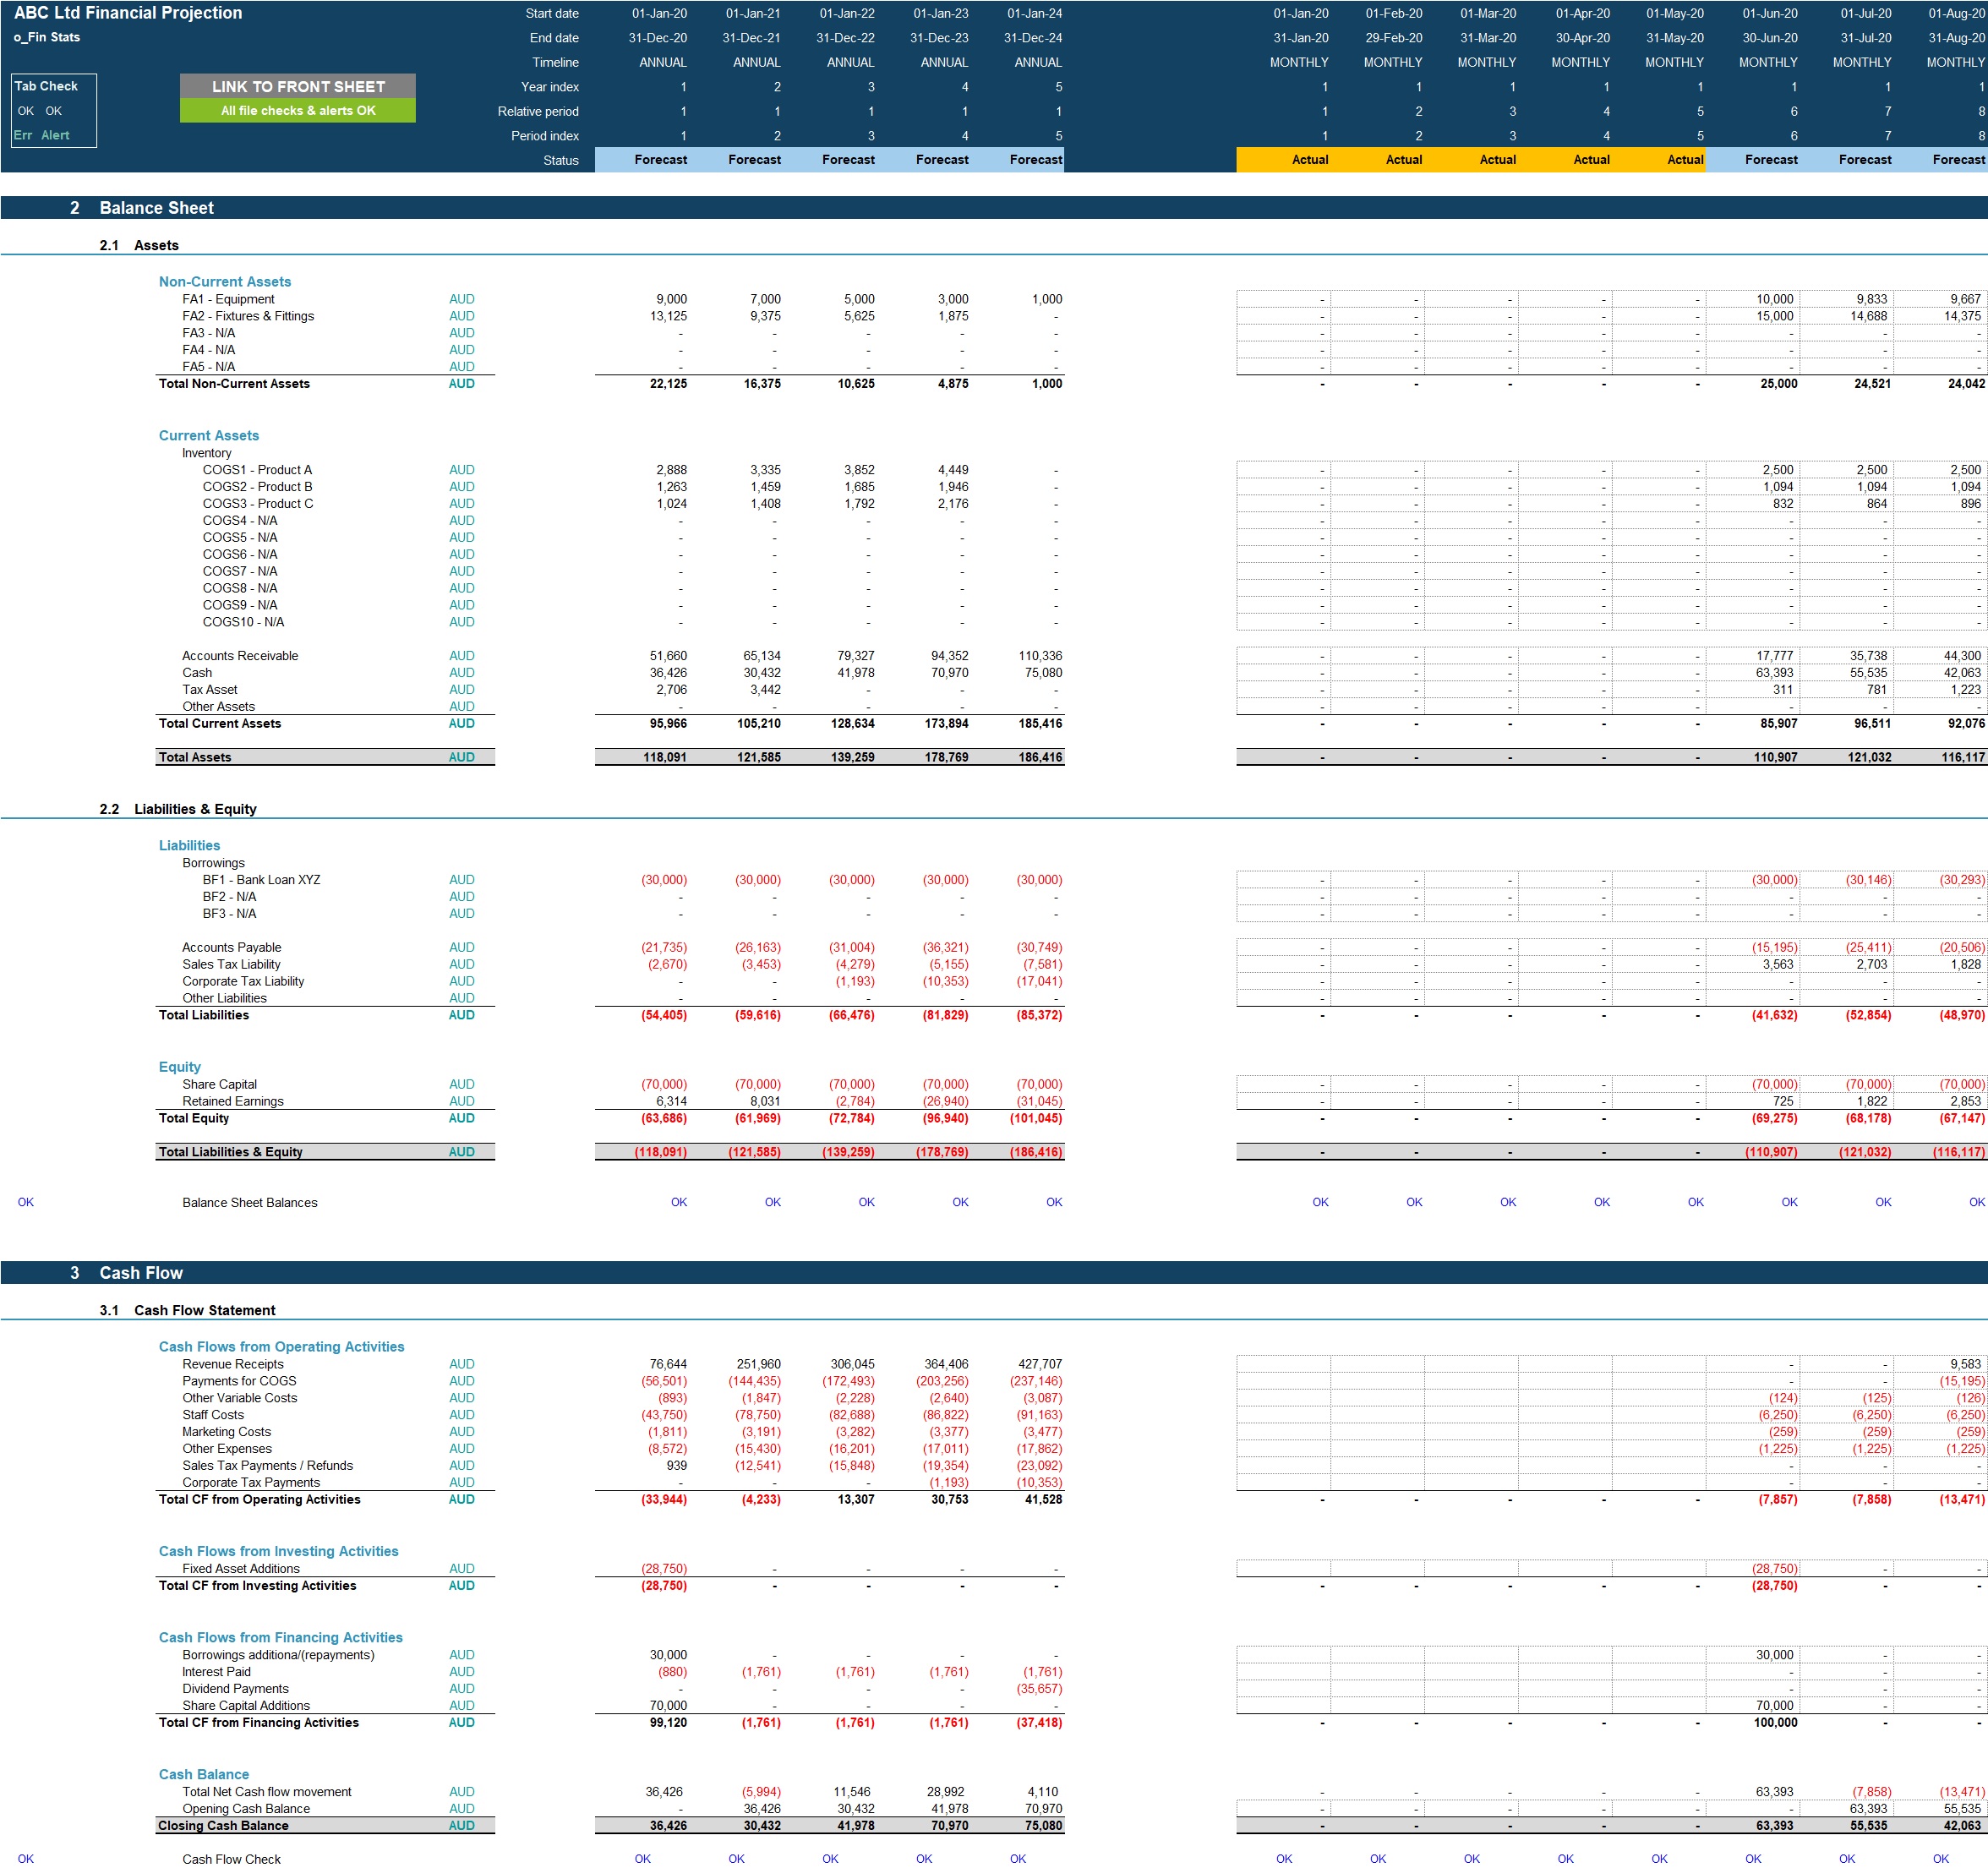
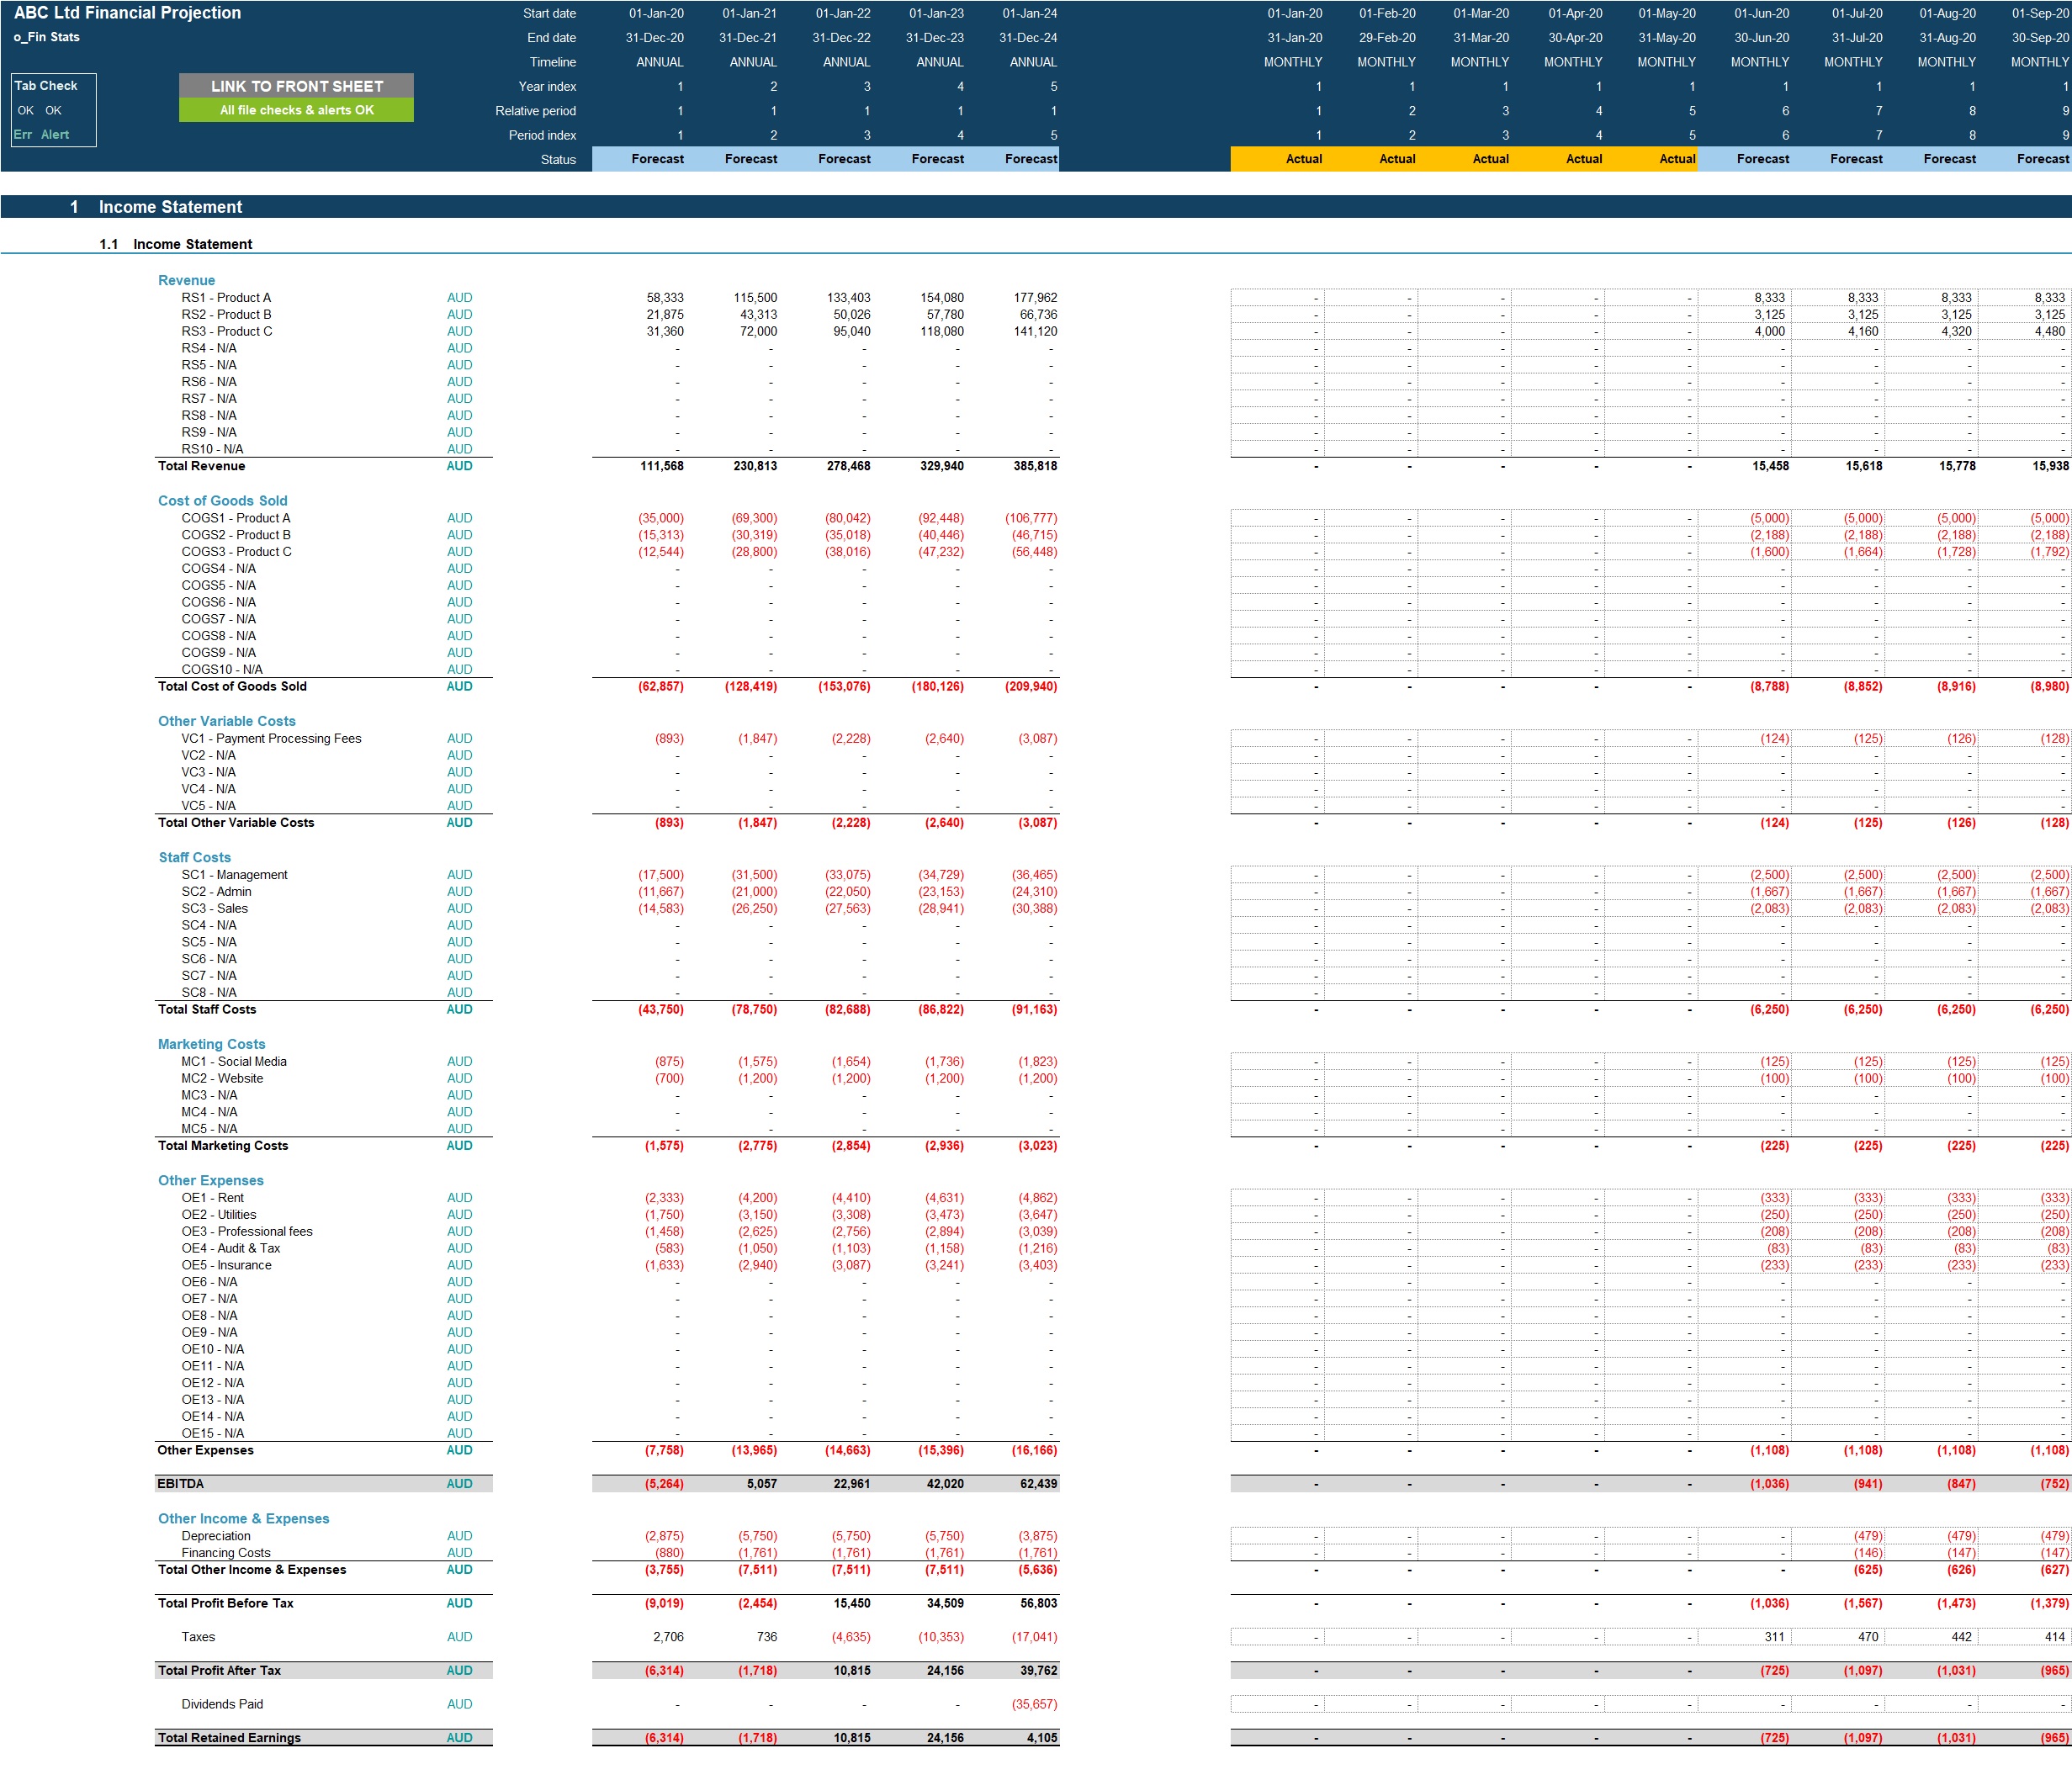
• Projected full financial statements (Income Statement, Balance Sheet and Cash flow Statement) for all 3 scenarios, presented on a monthly basis across up to 5 years and summarised on an annual basis.
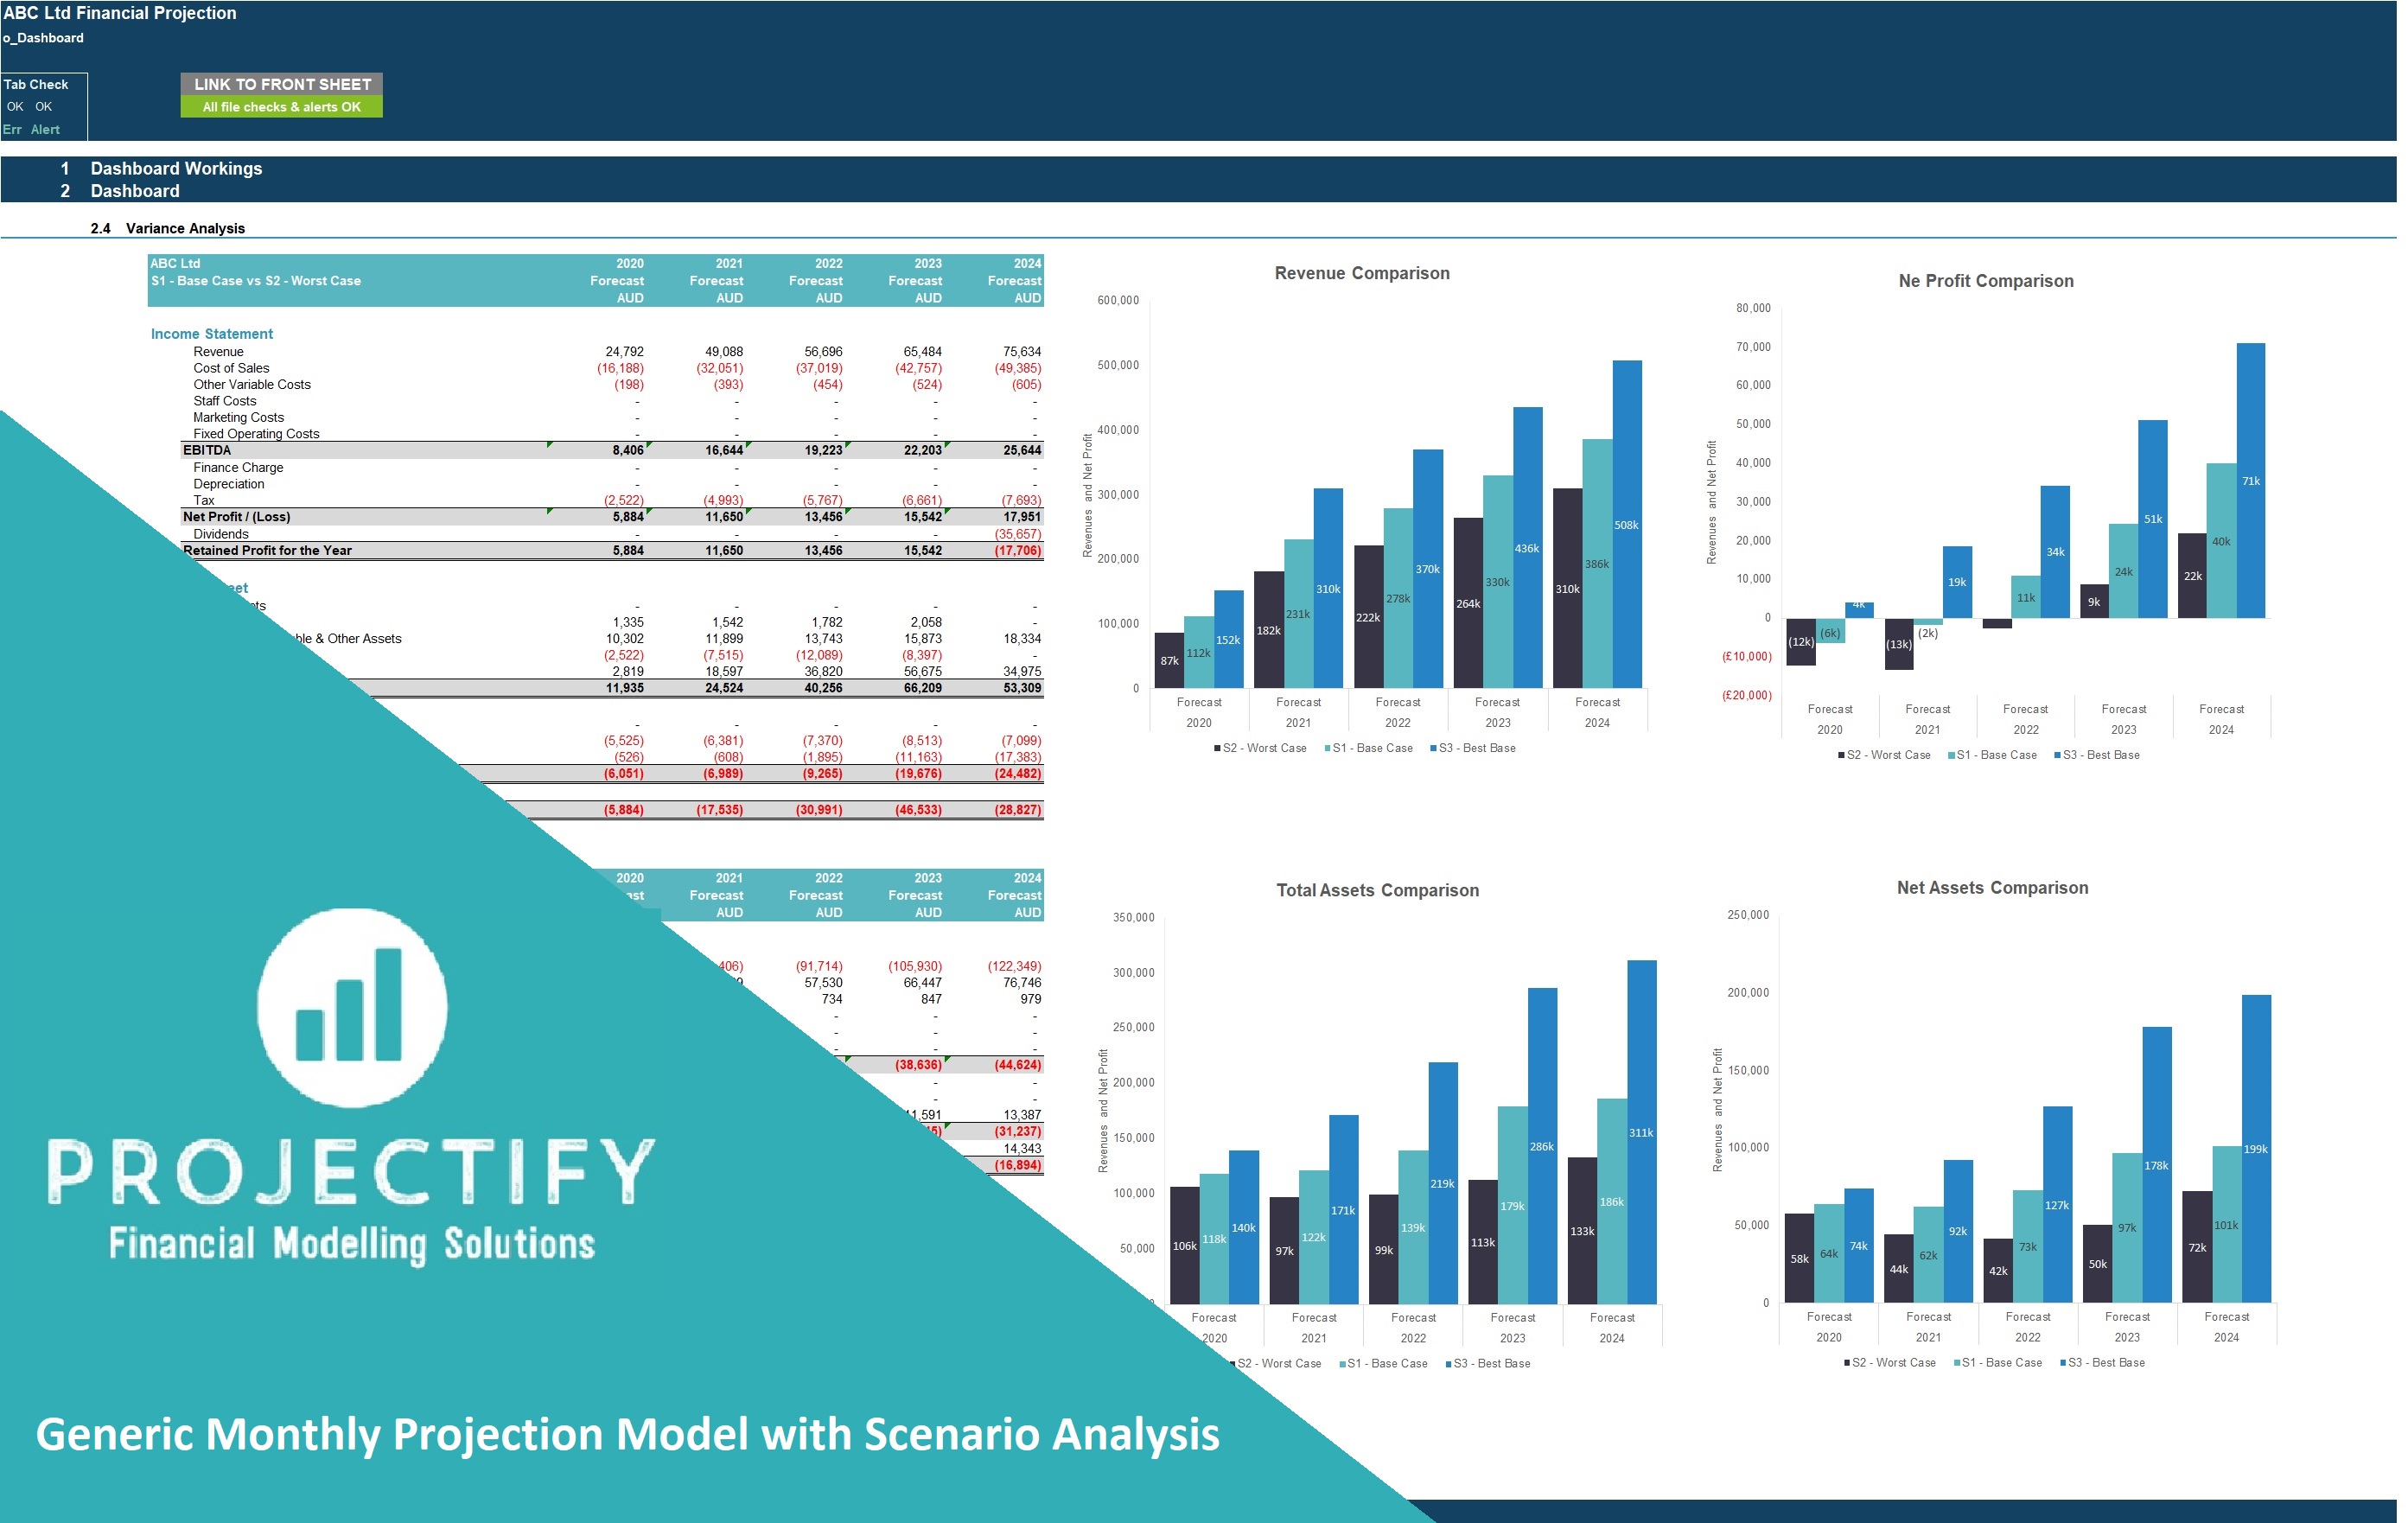
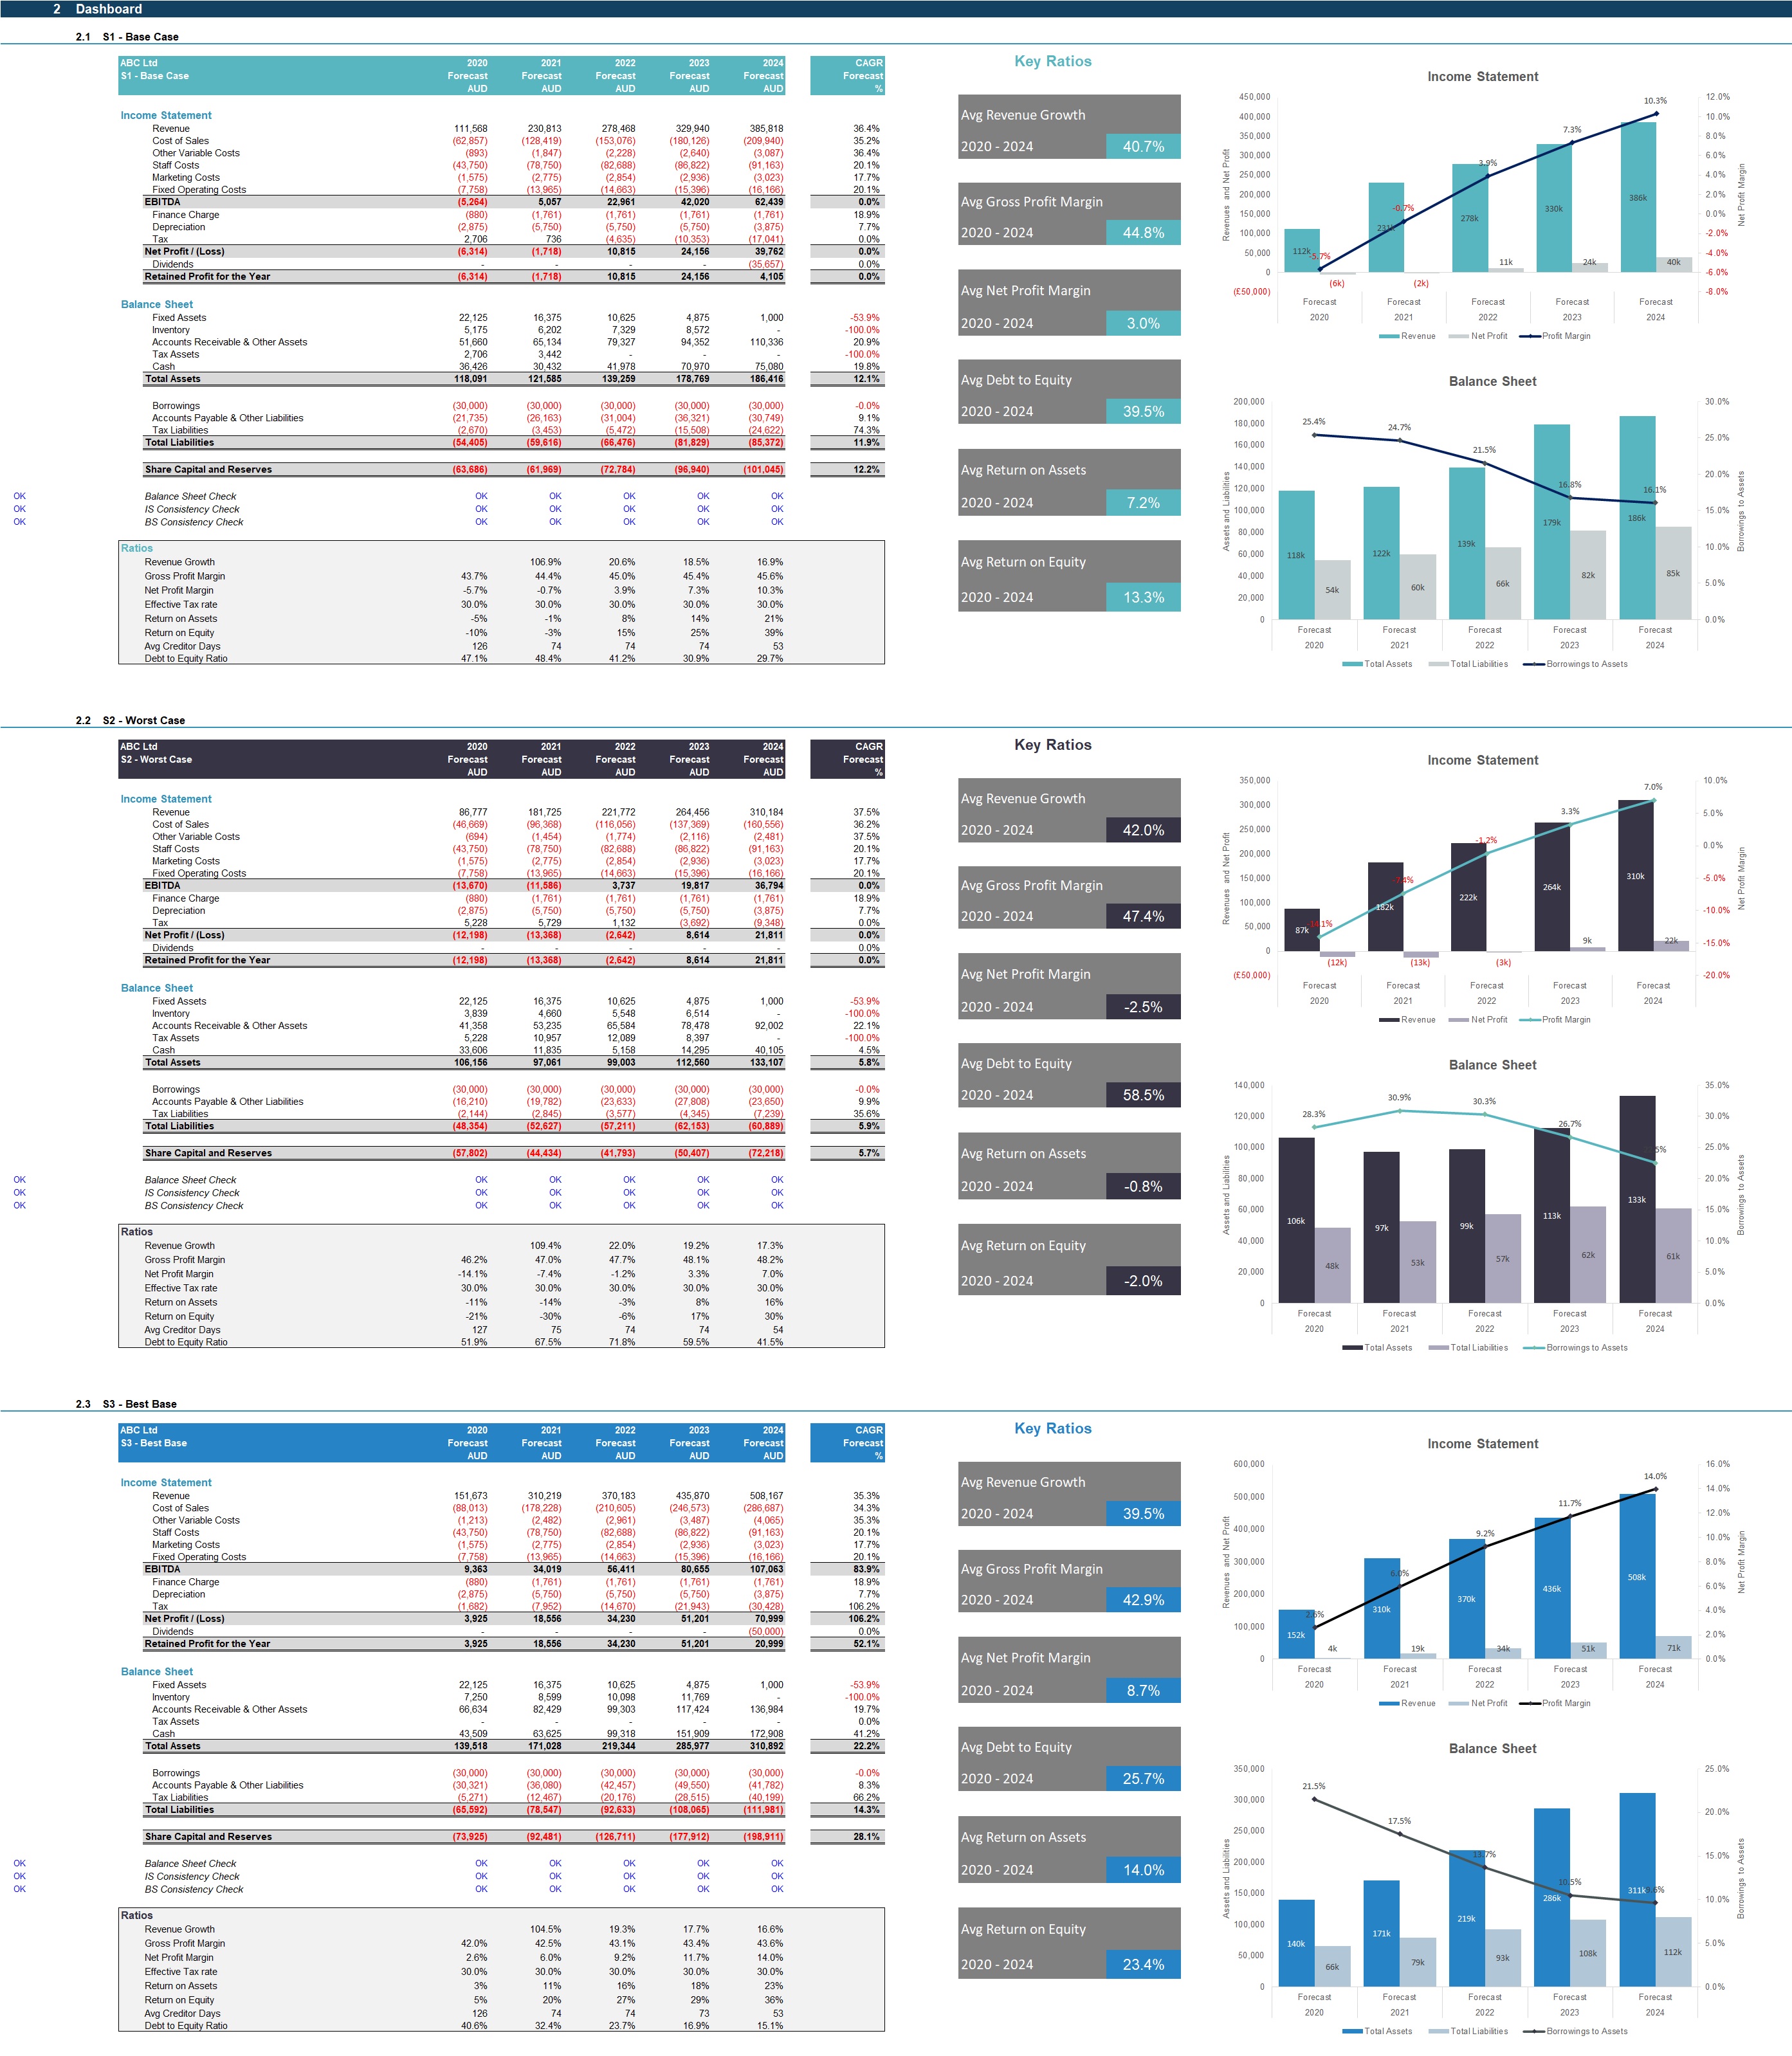
• Dashboard with:
Summarised projected Income Statement and Balance Sheet for each of the scenarios;
Compounded Annual Growth rate (CAGR) for each summarised income statement and Balance Sheet line item for each of the scenarios;
List of key ratios including Average revenue growth, Average profit margins, Average return on assets and equity and Average Debt to Equity ratio for each of the 3 scenarios;
Bar charts summarising income statement and Balance Sheet projections for each of the scenarios;
Gross Profit margin by revenue stream in table and bar-chart format for each of the 3 scenarios.
Variance analysis across the 3 scenarios with bar charts comparing: revenue, net profit, total assets and net assets for the 3 scenarios.
KEY INPUTS
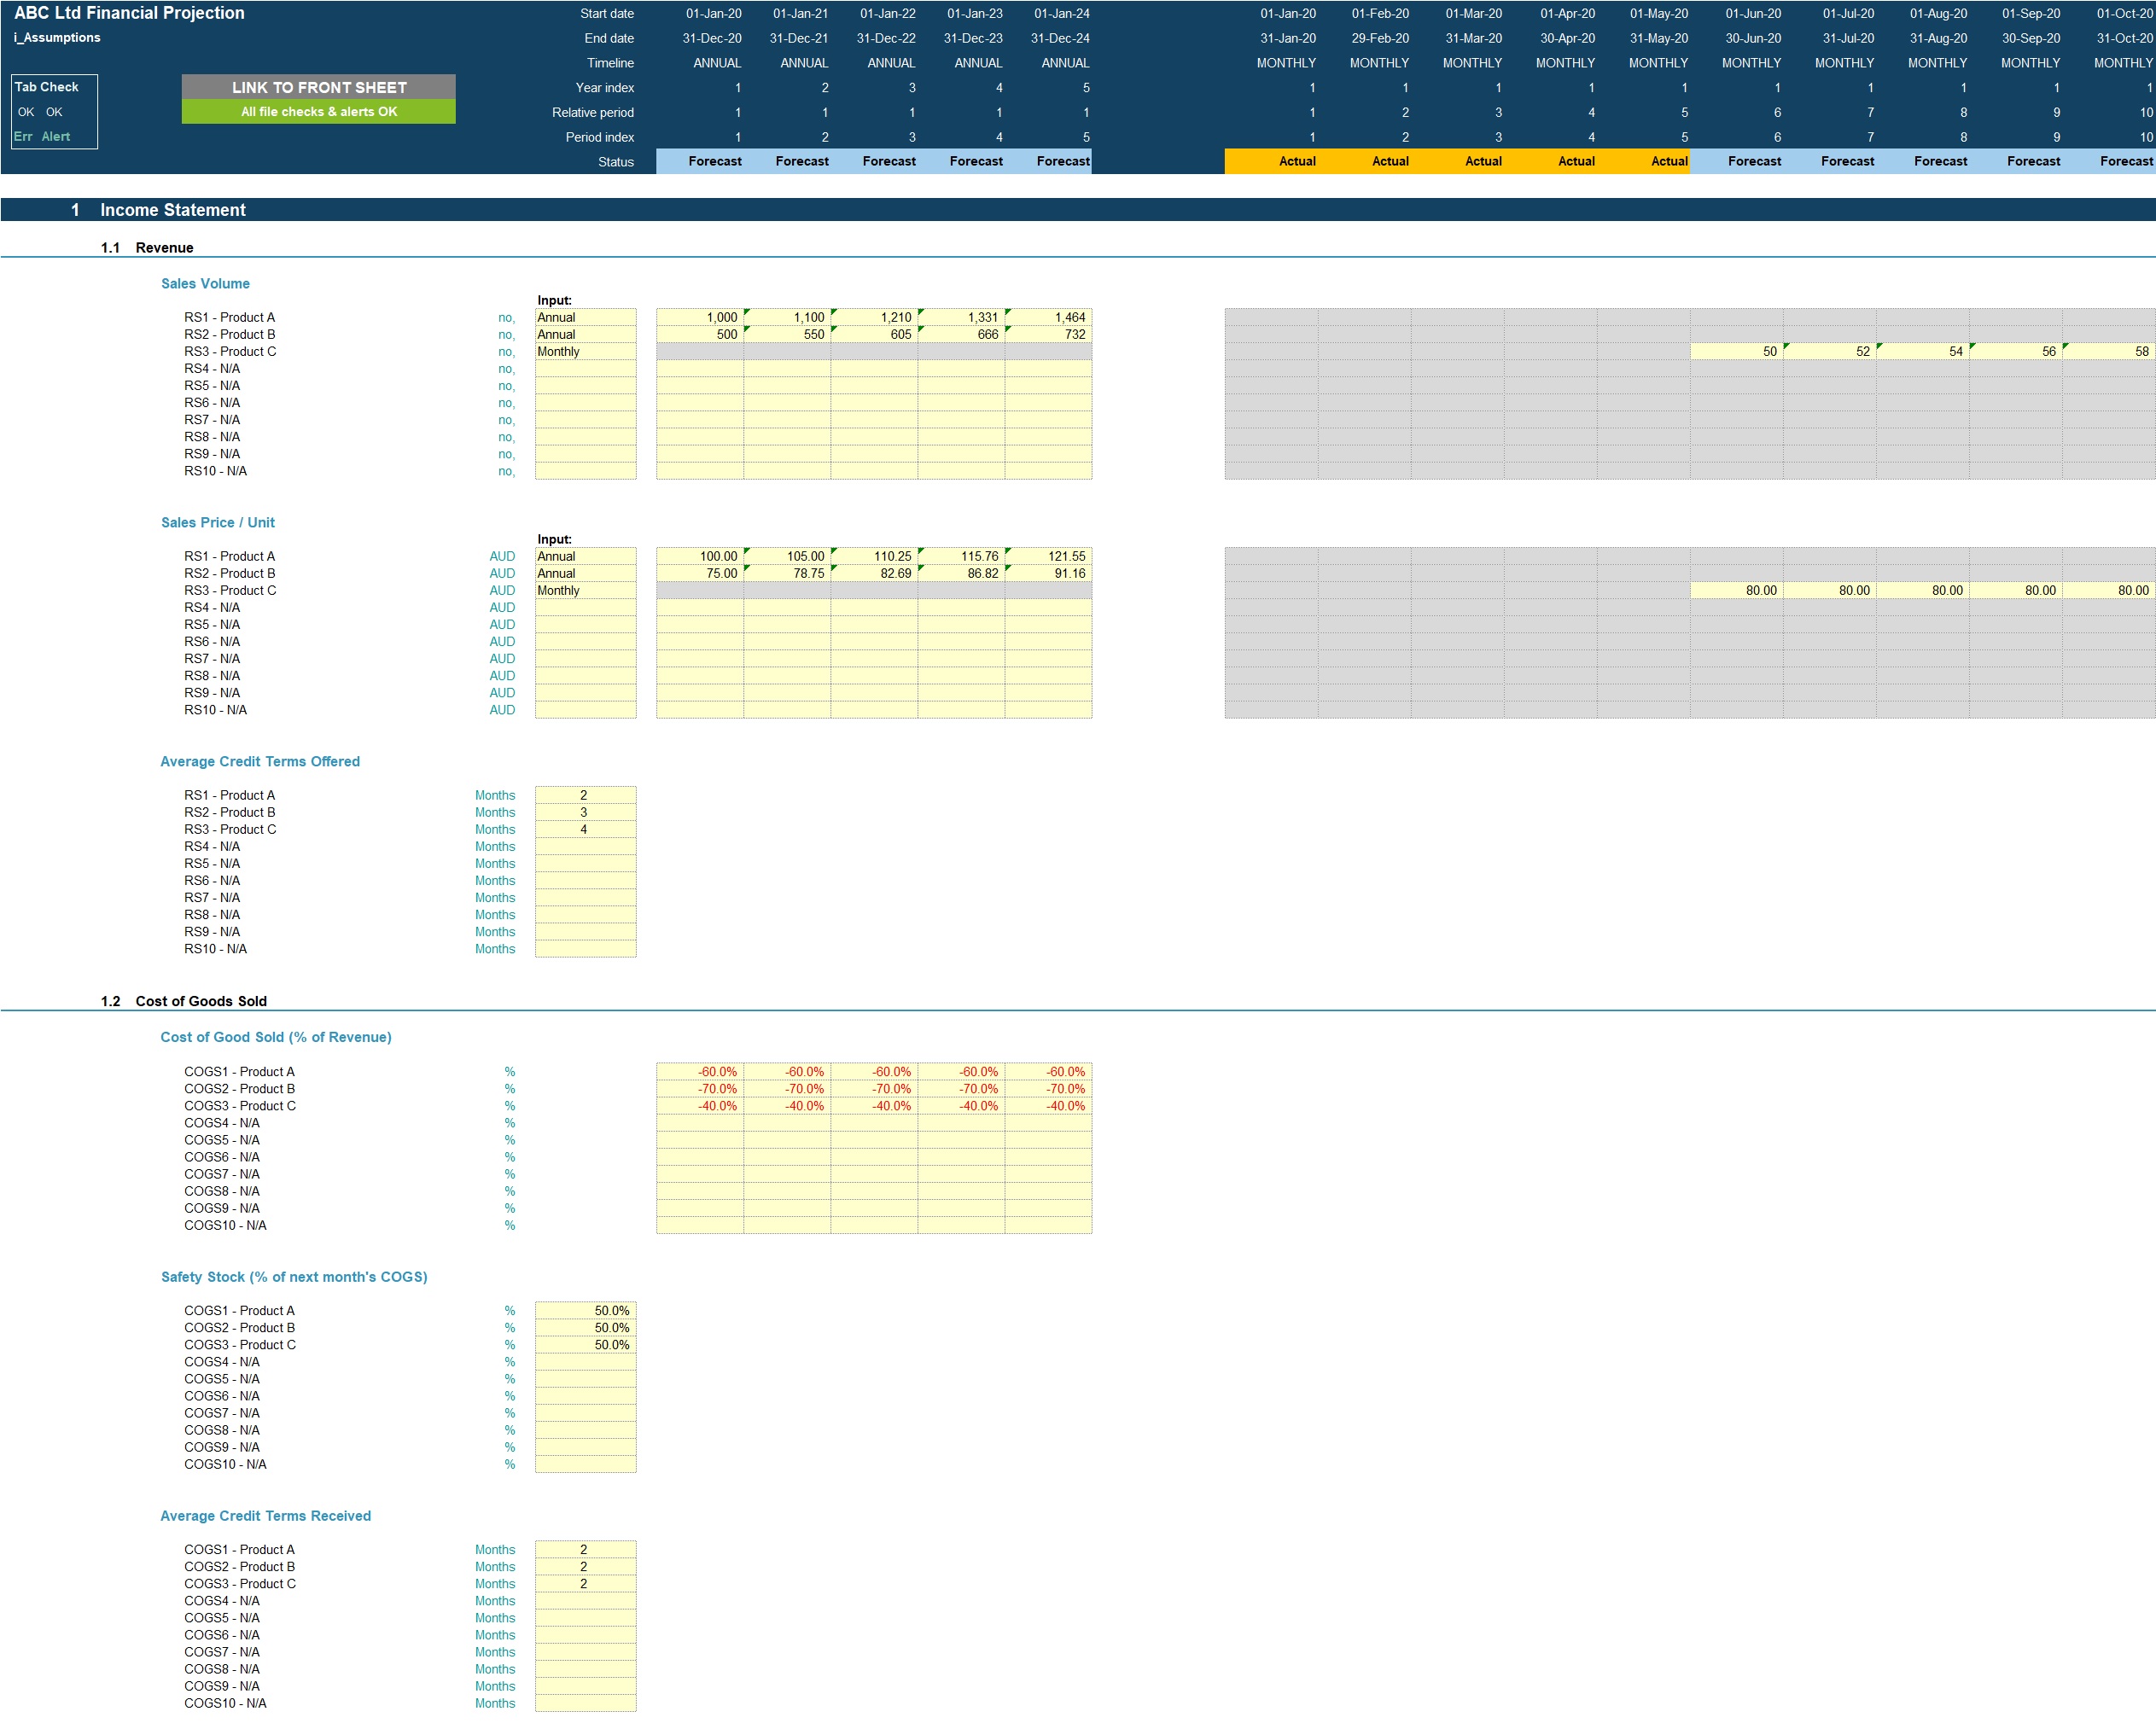
Inputs are split into Income Statement and Balance Sheet Inputs. Most inputs include user-friendly line item explanations and input validations to help users understand what the input is for and populate correctly.
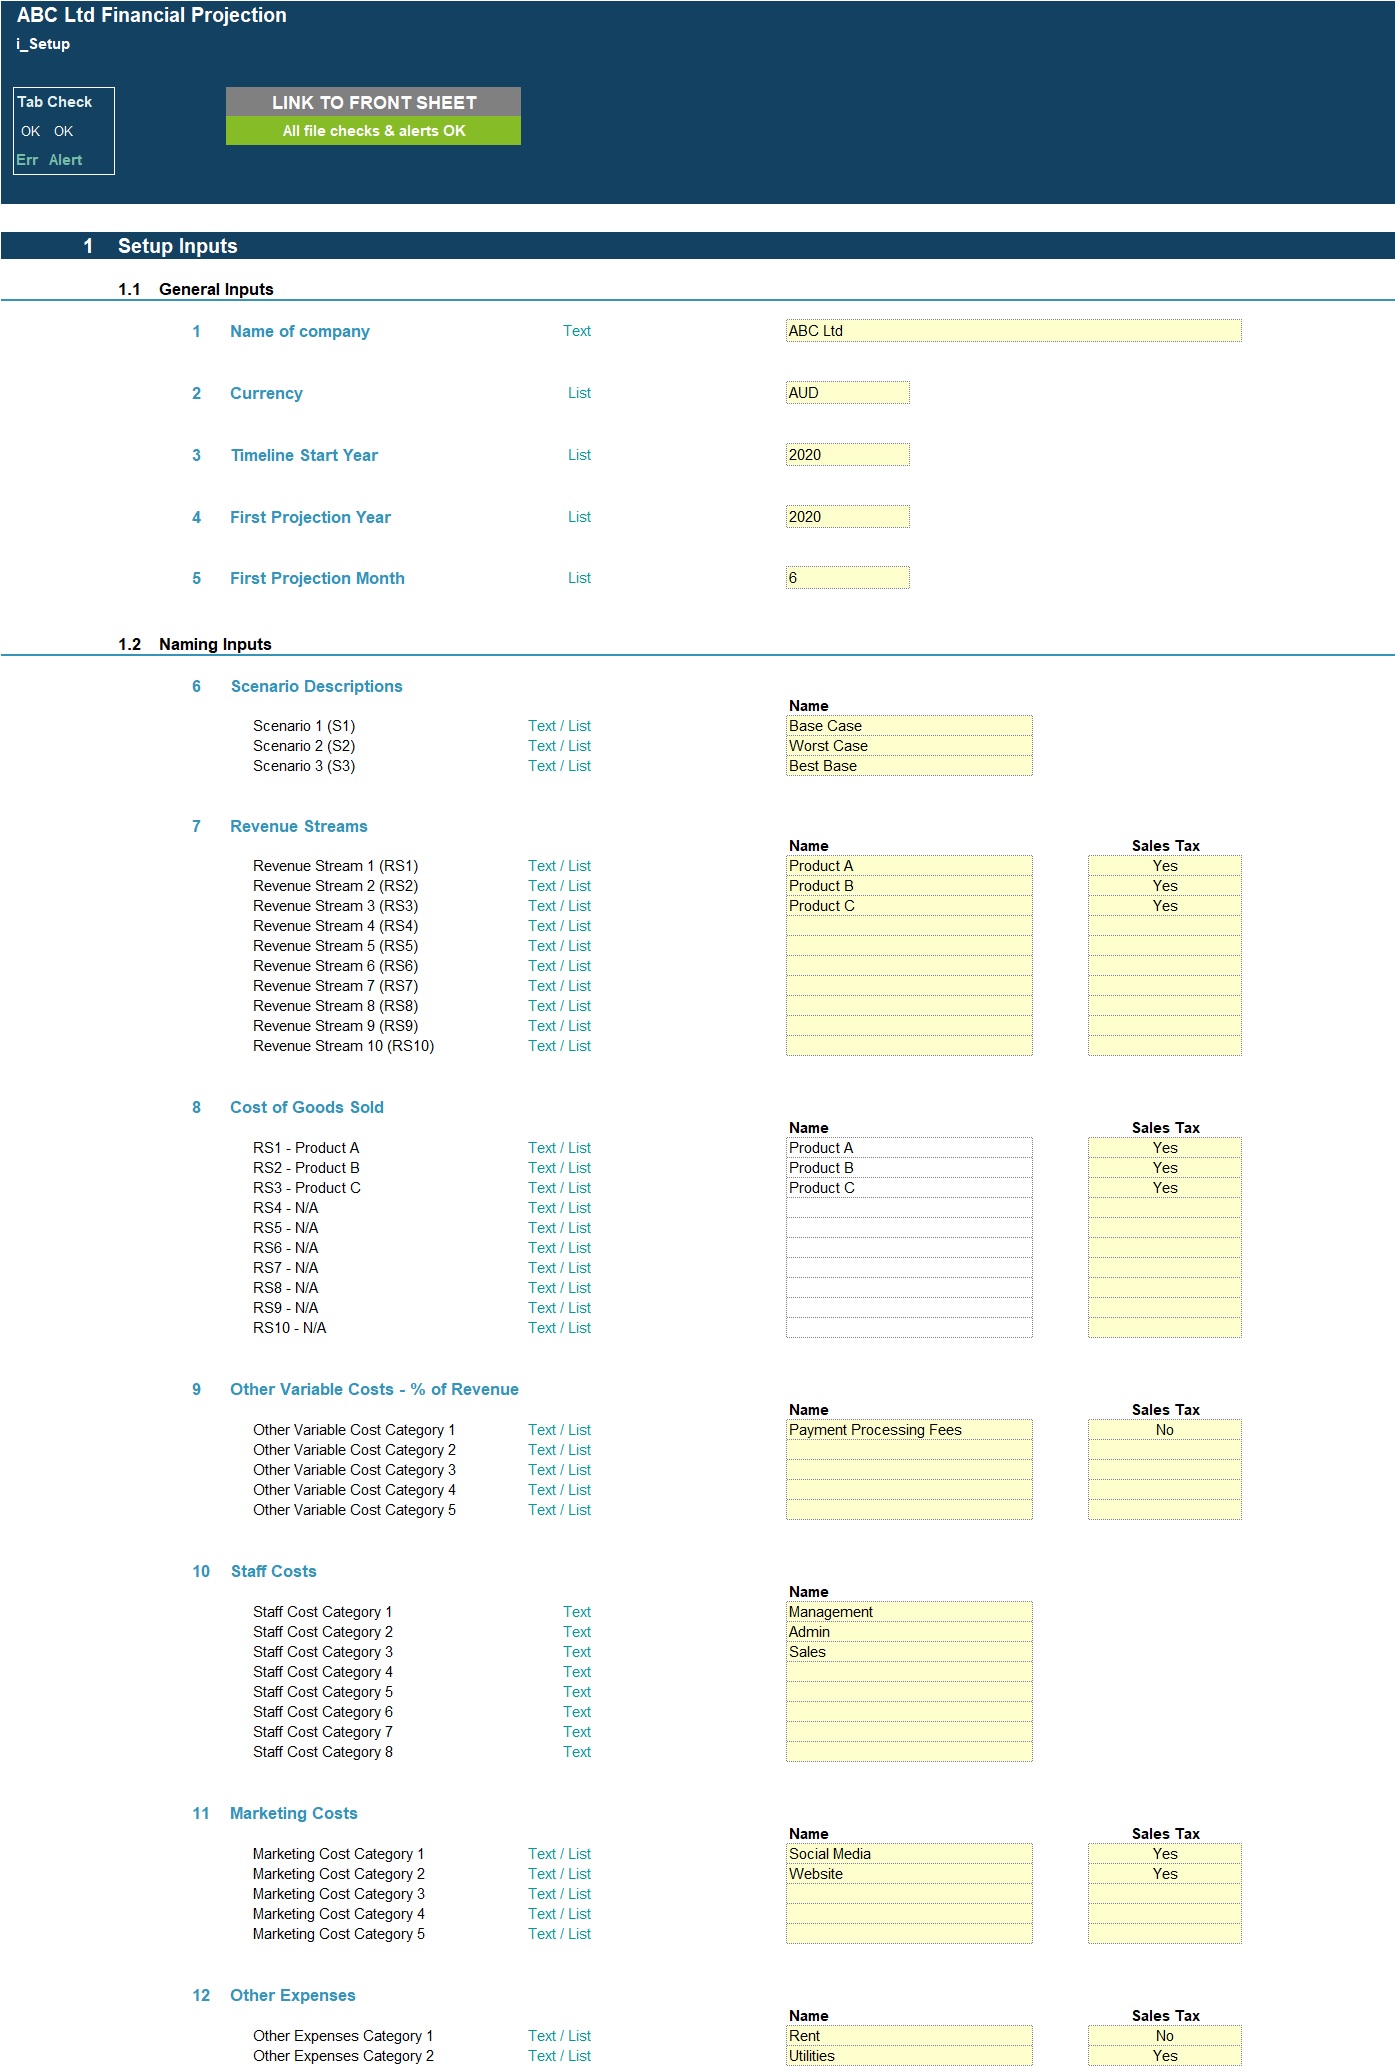
Setup Inputs:
• Name of business;
• Currency;
• First projection year and month;
• Naming of scenarios
• Naming for revenue streams, variable costs, staff costs, other expenses and fixed assets;
• Sales tax applicability for revenue streams, variable costs, other expenses and fixed assets.
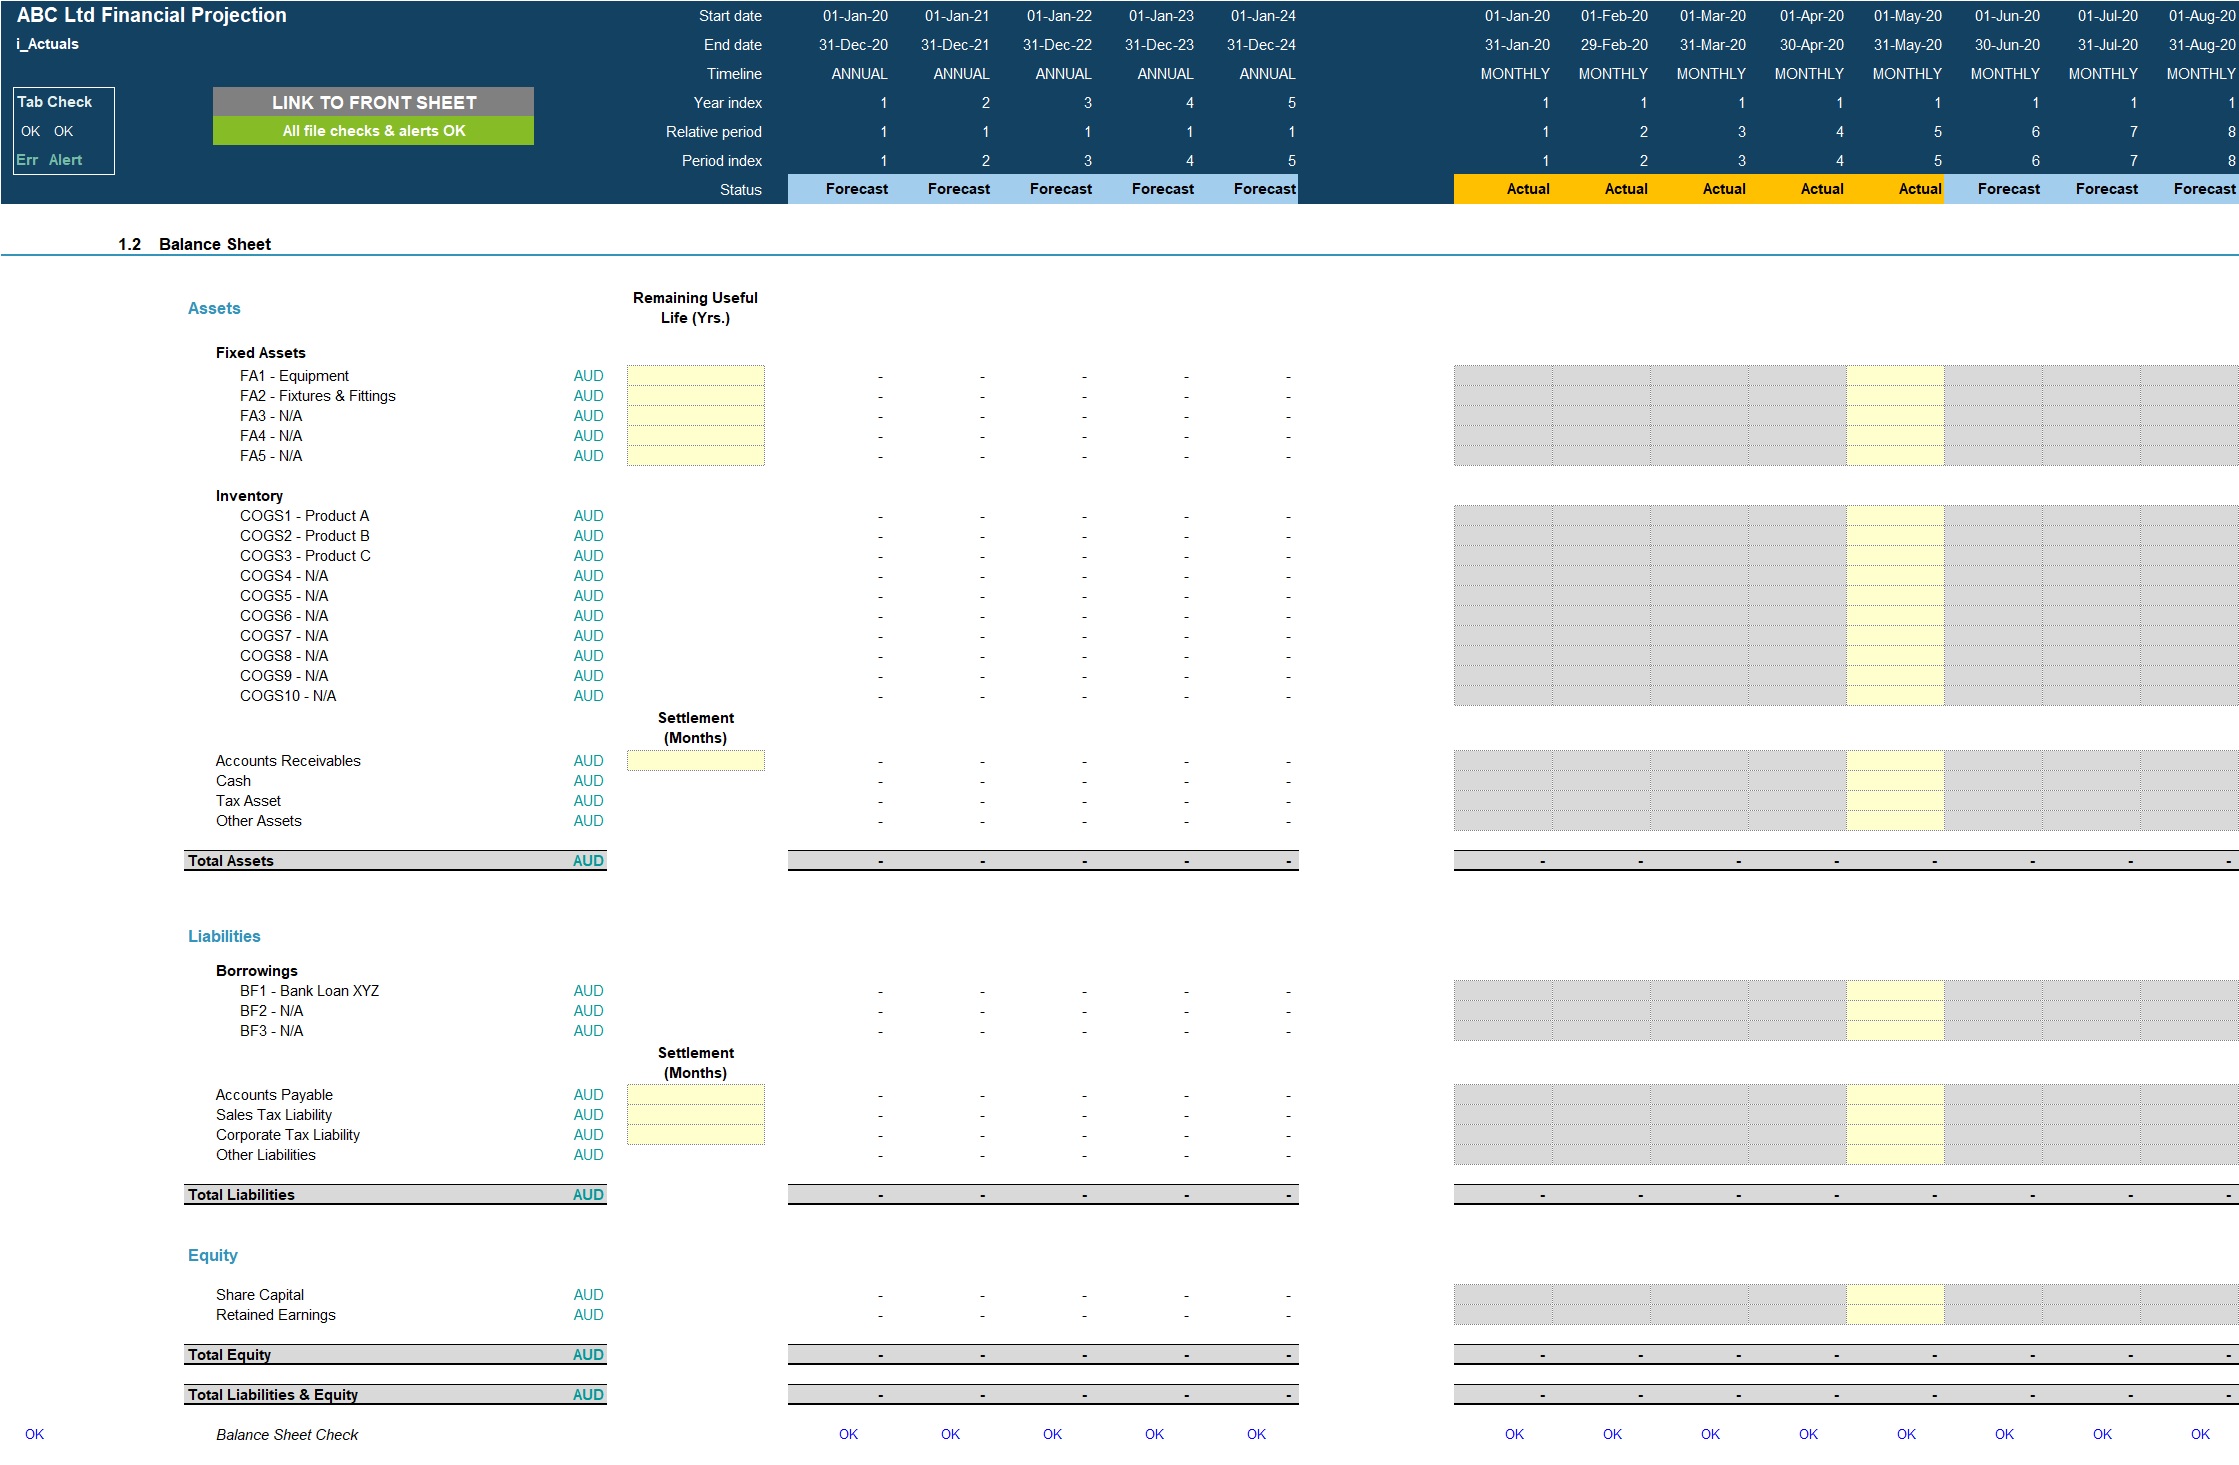
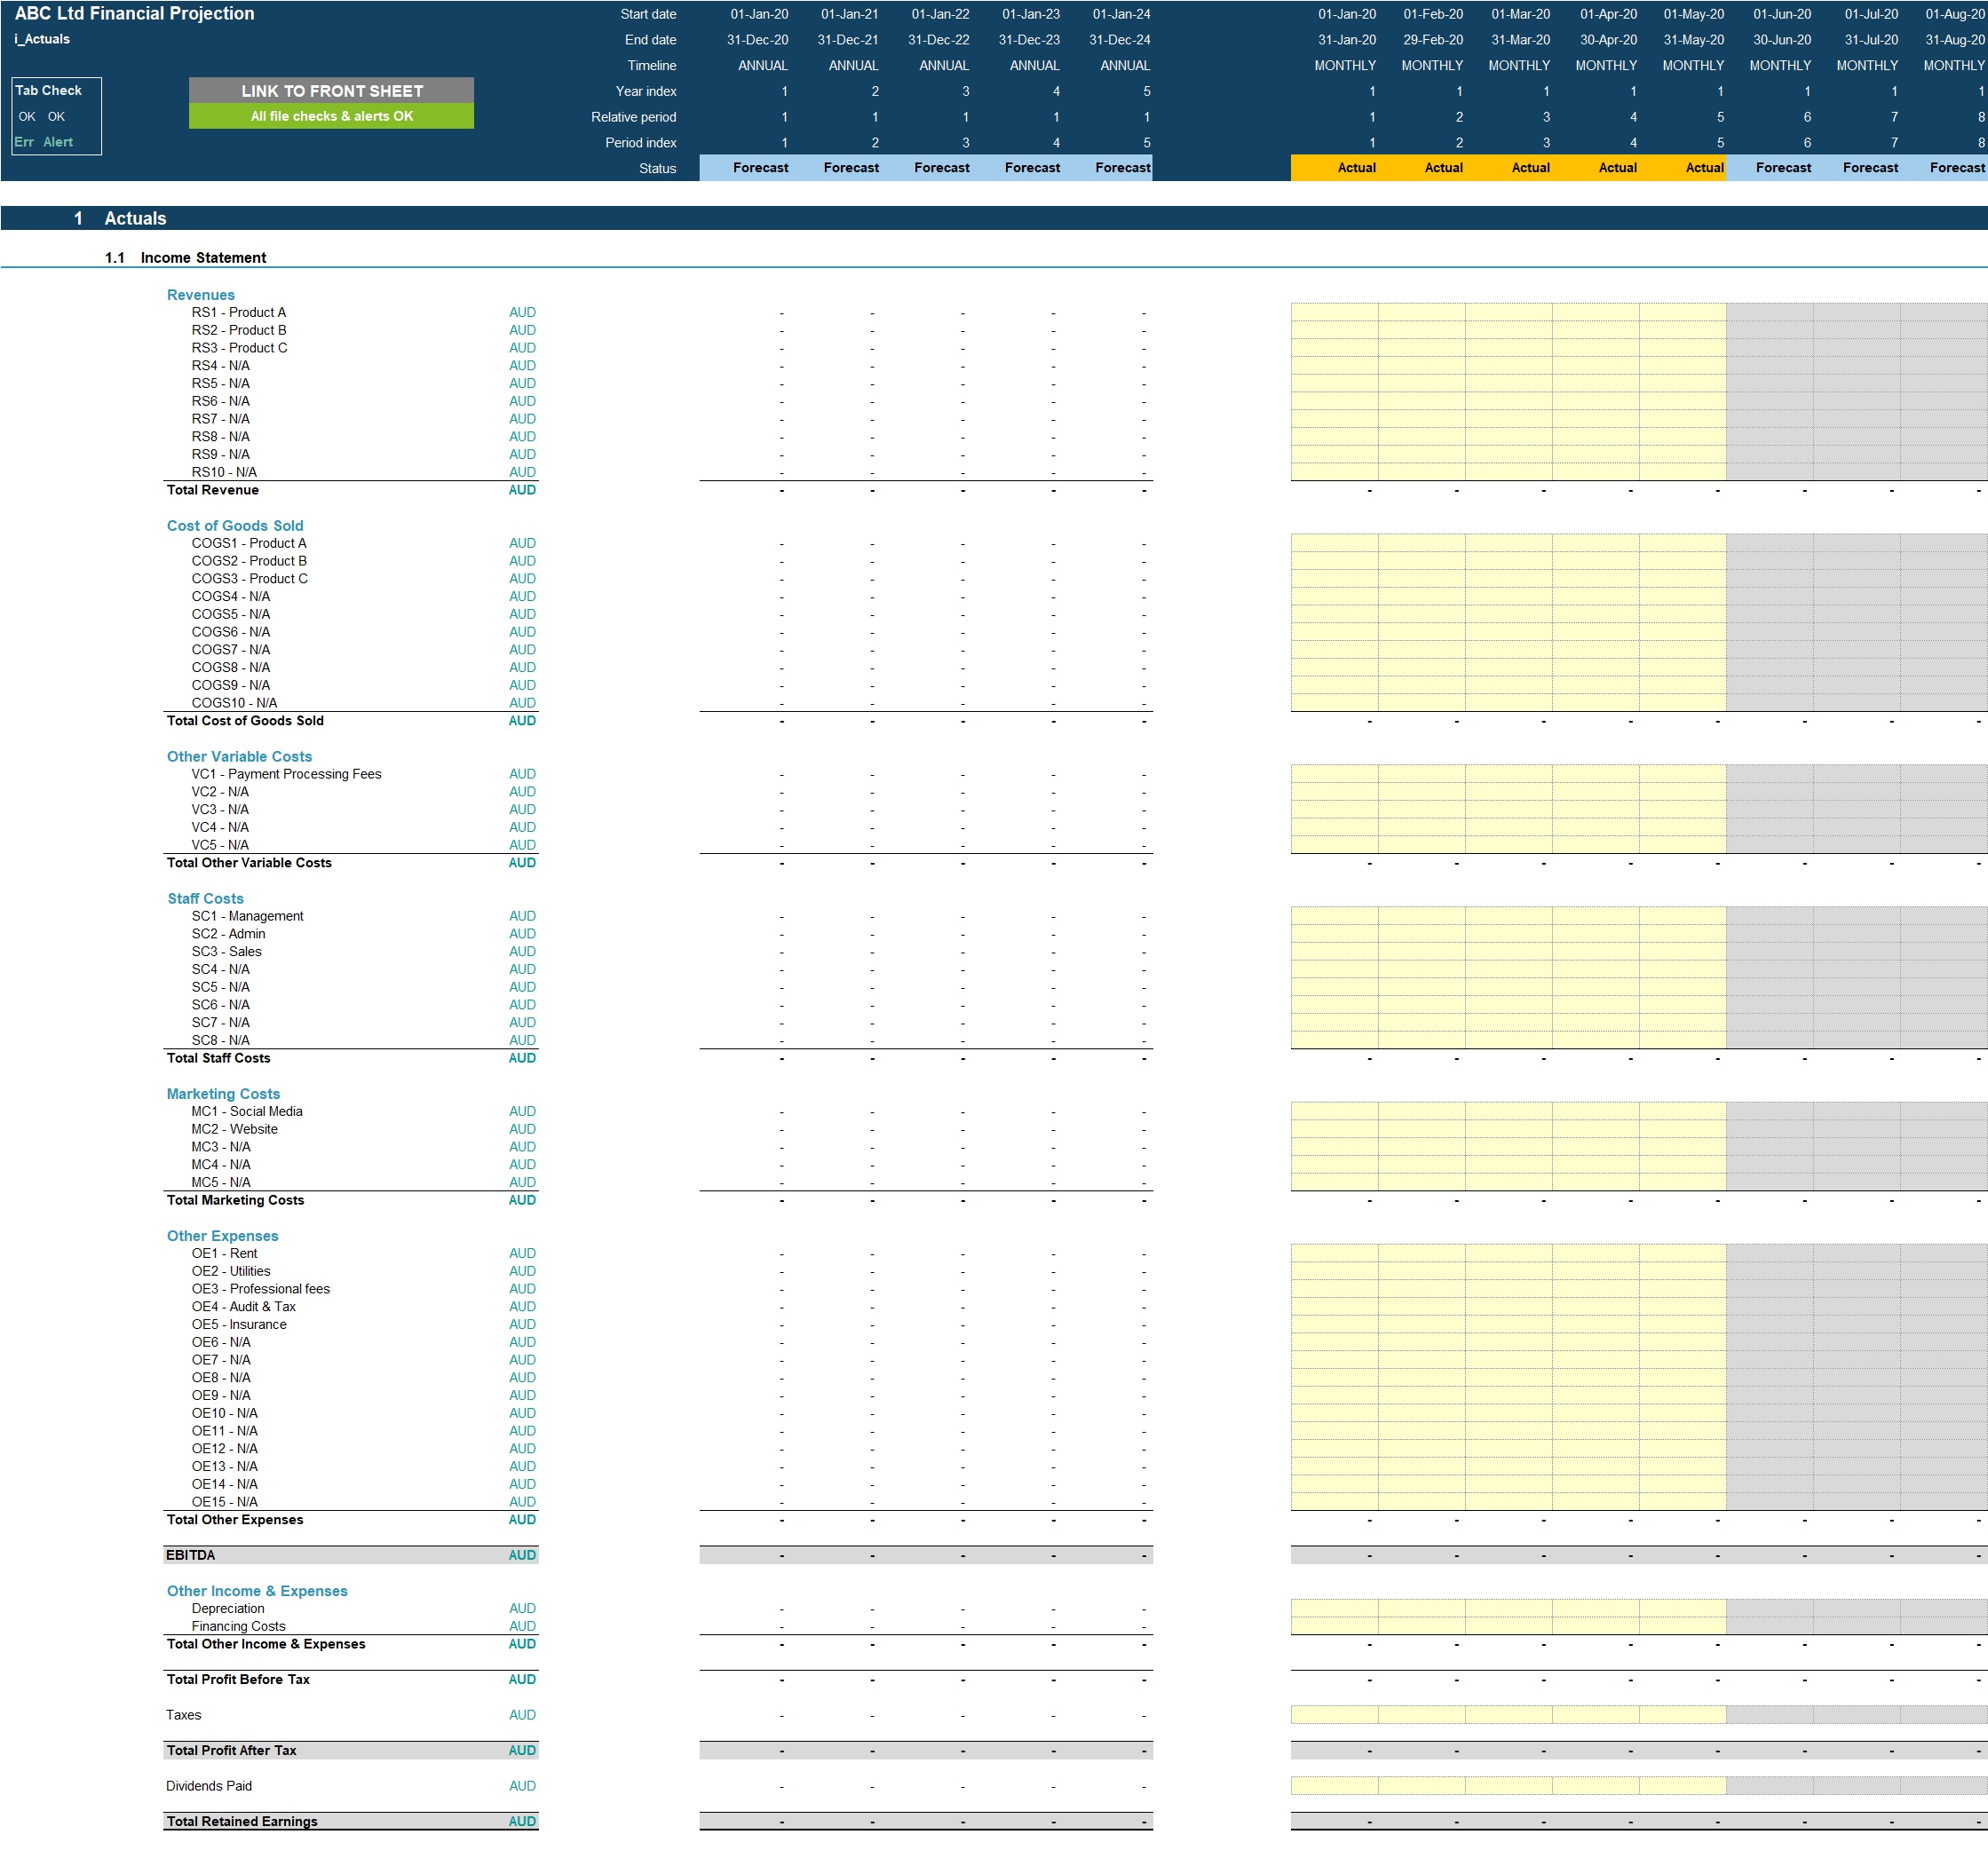
Actuals Inputs:
• Opening balance sheet (for existing businesses);
• Income Statement actuals (for trend analysis);
Projection Inputs for each of the 3 scenarios:
• Revenue inputs including sales volume, sales prices and average credit terms offered;
• Cost of goods sold included percentage of revenue, safety stock percentage and average credit terms received;
• Variable cost inputs including % of revenue applicable to and cost percentage of revenue
• Other costs inputs including staff costs, marketing costs and fixed costs;
• Sales and corporate tax inputs including rate and payment periods;
• Dividend inputs including amount (percentage of retained earnings) and frequency;
• Fixed Assets including addition amounts and useful life;
• Borrowings including addition amounts and interest rate;
• Share Capital additions;
• Discount rate inputs (for valuation calculation).
MODEL STRUCTURE
The model comprises of 12 tabs split into input ('i_'), calculation ('c_'), output ('o_') and system tabs. The tabs to be populated by the user are the input tabs ('i_Setup', ‘i_Actuals', 'i_Assump_S1', 'i_Assump_S2' and , 'i_Assump_S3'). The calculation tab uses the user-defined inputs to calculate and produce the projection outputs which are presented in 'o_Fin Stats' and ‘o_Dashboard'.
System tabs include:
• A 'Front Sheet' containing a disclaimer, instructions and contents;
• A Checks dashboard containing a summary of checks by tab.
KEY FEATURES
Other key features of this model include the following:
• The model follows good practice financial modelling guidelines and includes instructions, line item explanations, checks and input validations;
• The model contains a flexible timeline that allows for a mix of actual and forecast period across a 5-year period. This allows projections to be easily rolled forward;
• Timeline is split on a monthly basis and summarised on an annual basis;
• The model allows the user to model 10 separate revenue streams on a Price x Volume basis;
• The model is not password protected and can be modified as required following download;
• The model is reviewed using specialised model audit software to help ensure formula consistency and significantly reduce risk of errors;
• Costs are split into: variable and other costs for better driver-based forecasting;
• The model allows for the following number of underlying categories for each line item (these can be easily expanded if required):
Scenarios – 3 scenarios
Revenue streams – 10 categories;
Cost of goods sold – 1 category for each revenue stream (10 categories in total);
Variable costs – 5 categories
Staff costs – 8 categories;
Marketing costs – 5 categories;
Other expenses – 15 categories;
Fixed assets – 5 categories;
Borrowings – 3 facilities
• Apart from projecting revenue and costs the tool includes the possibility to model receivables and payables, fixed assets, borrowings, dividends and corporate tax;
• Business Name, currency, starting projection period and scenario names are fully customisable;
• Revenue, Cost and Fixed Asset descriptions are fully customisable;
• The model included an integrated discounted cash flow valuation using the projected cash flow outputs;
• The model includes instructions, line item explanations, checks and input validations to help ensure input fields are populated accurately;
• The model includes a checks dashboard which summarises all the checks included in the various tabs making it easier to identify any errors.
Got a question about the product? Email us at support@flevy.com or ask the author directly by using the "Ask the Author a Question" form. If you cannot view the preview above this document description, go here to view the large preview instead.
Source: Best Practices in Integrated Financial Model Excel: Generic Monthly 5-Year 3 Statement Rolling Financial Projection Model with Scenario Analysis Excel (XLSX) Spreadsheet, Projectify
ABOUT THE AUTHOR
We are financial modelling professionals, accountants and CFA charterholders with experience working within Deloitte supporting clients with their financial planning and decision support needs. Our aim is to provide robust and easy-to-use financial models that follow good practice financial modelling guidelines and assist individuals and businesses with key financial planning and analysis ... [read more]
Ask the Author a Question
You must be logged in to contact the author.
