
 Click main image to view in full screen.
Financial Model Audit Checklist: 61 Tests, Score & Grade – Excel XLSX
Excel (XLSX) + supplemental PDF


BENEFITS OF THIS DOWNLOADABLE EXCEL DOCUMENT
- Sixty-one tests in eight categories, each one written to be run by a person in under a minute, and each one naming the menu, the shortcut or the cell that answers it.
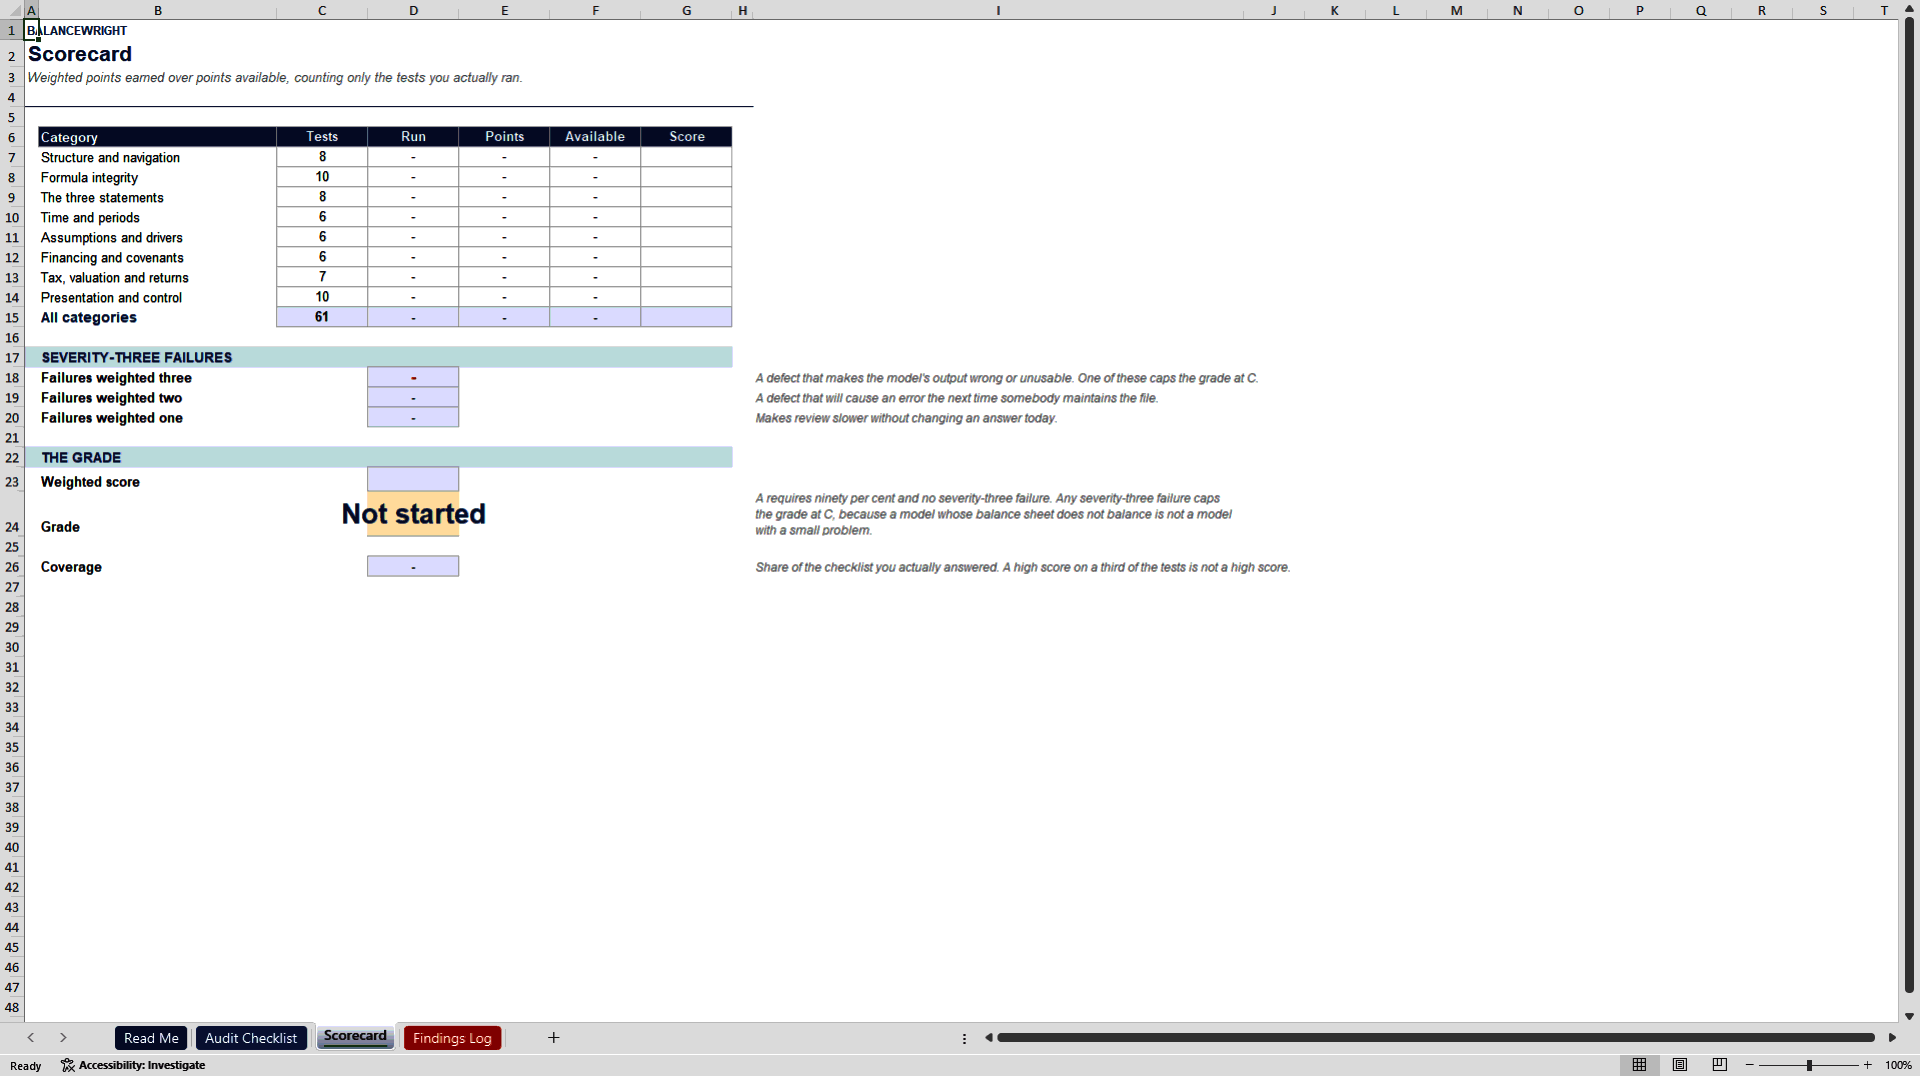
- Severity is built into the arithmetic: one severity-three failure caps the grade at C however clean the rest of the file is.
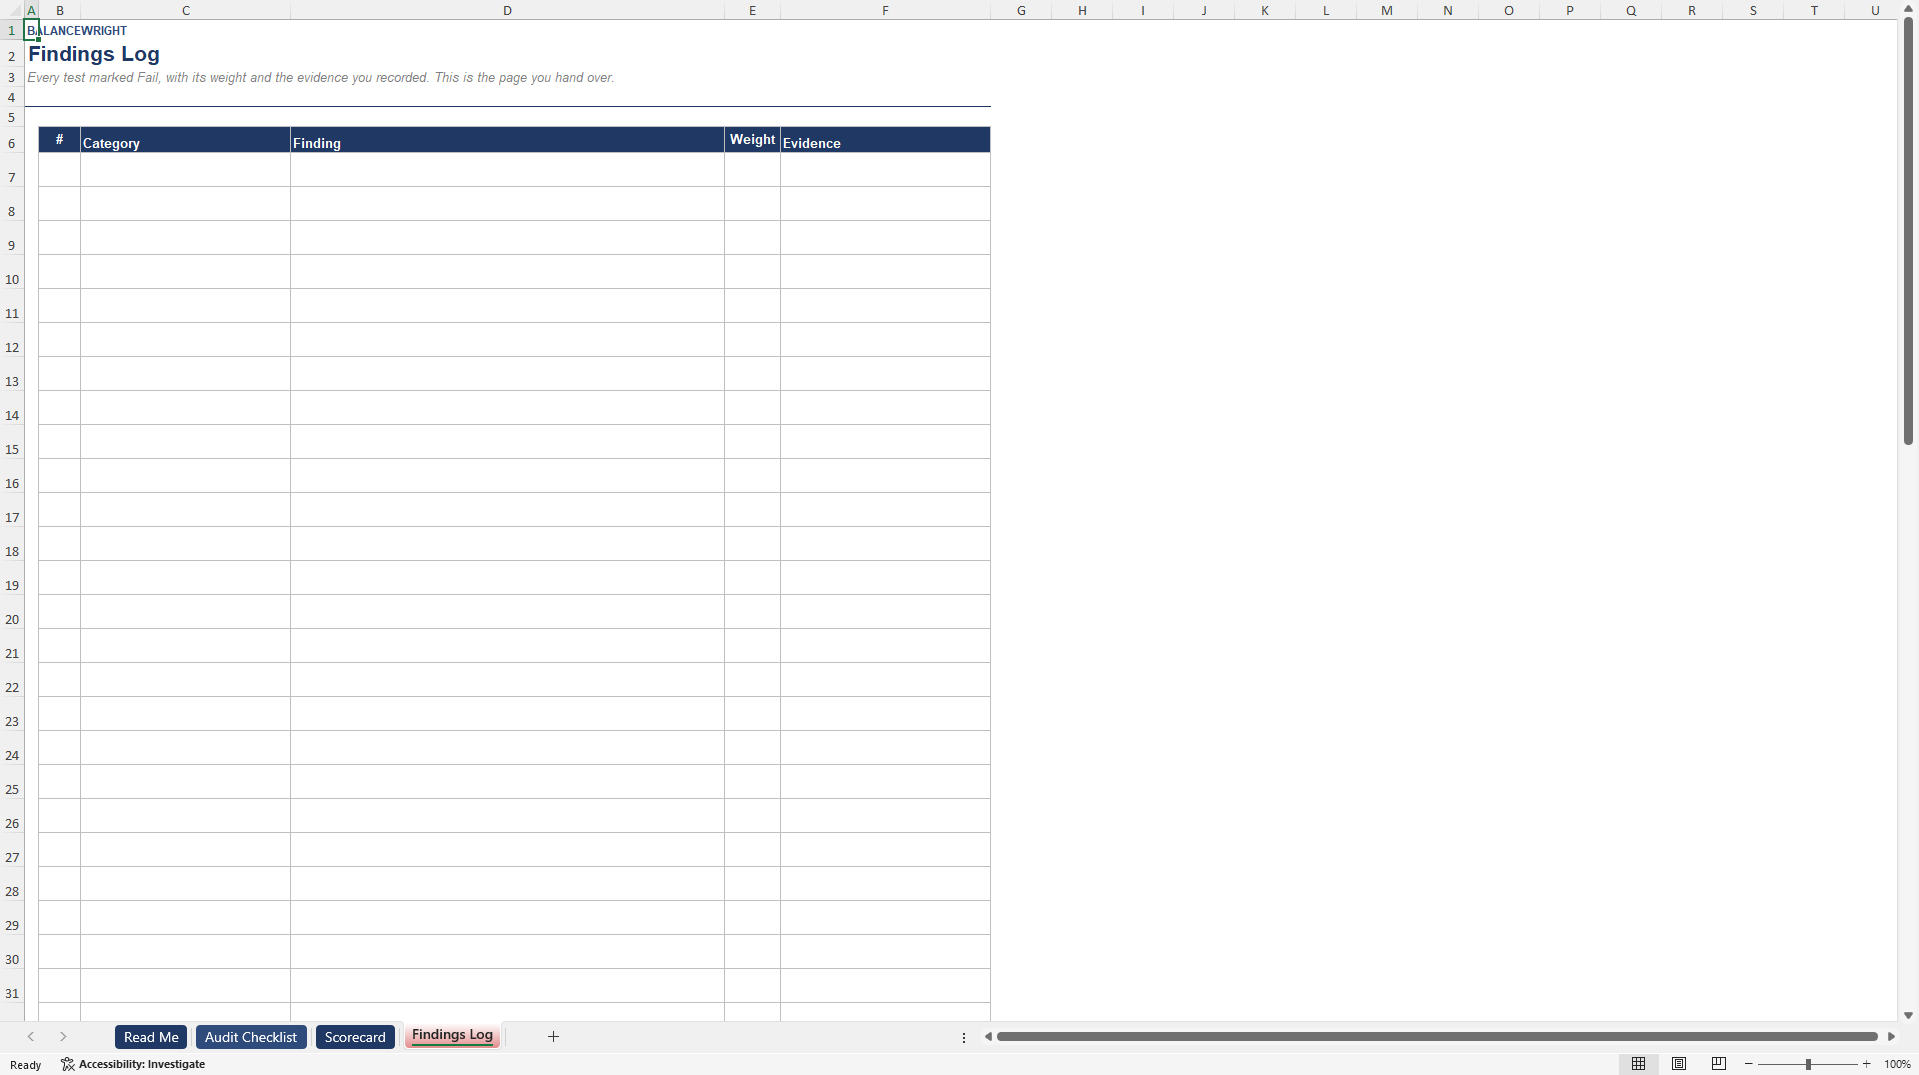
- The findings log builds itself from the failures, sorted by severity, with your evidence - the page you actually hand to the modeller.
FINANCIAL MODELING EXCEL DESCRIPTION
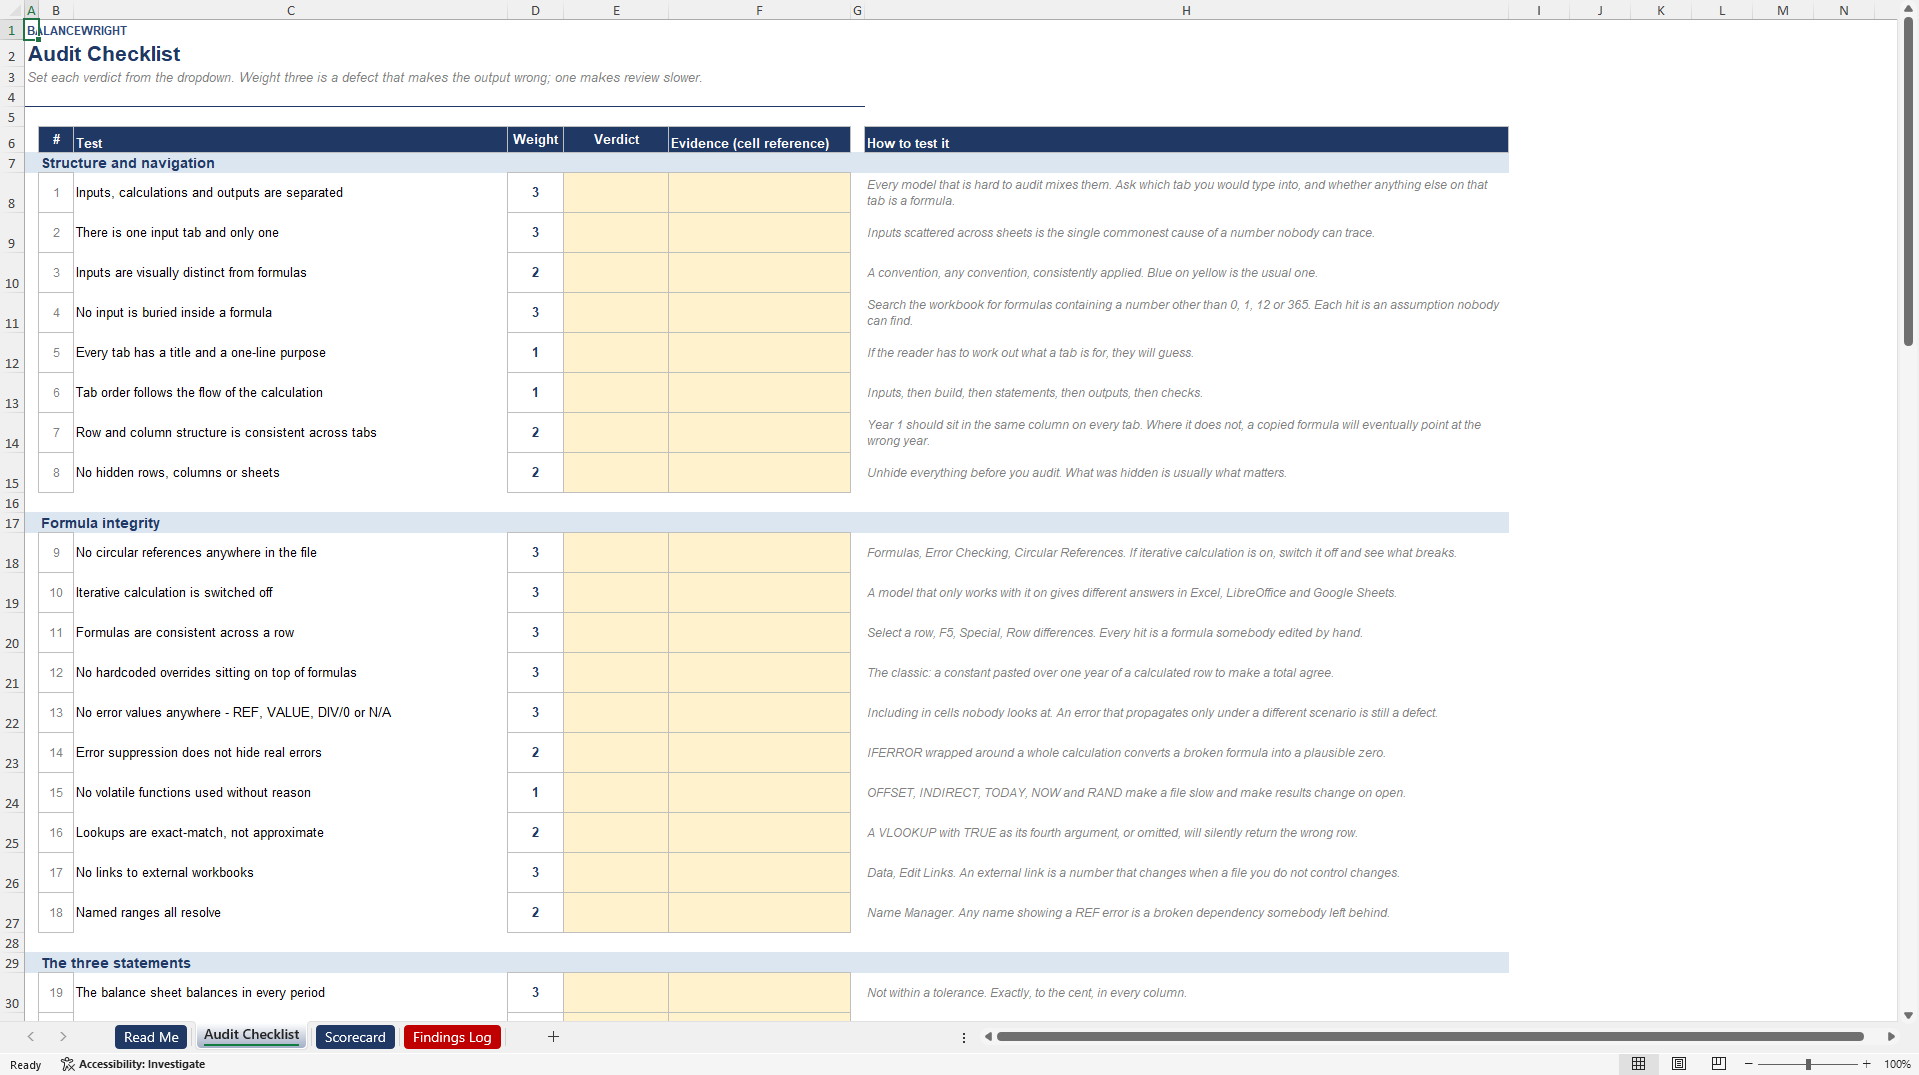
This is not a model. It is the checklist you run AGAINST a model – somebody else's before you rely on it, or your own before you send it. Sixty-one tests in eight categories, each carrying a severity weight from one to three, a verdict you pick from a dropdown and a column for the evidence. Four tabs, 359 live formulas.
WHY A CHECKLIST AND NOT A SCANNER. There are add-ins that scan a workbook and produce a list of anomalies. They are useful and they are not this. A scanner finds inconsistent formulas; it cannot tell you that the growth rate was applied to the wrong base, that the covenant definition in the model is not the definition in the credit agreement, or that the file carries another client's name in its document properties. Those are the findings that end deals, and they are found by a person who knows where to look.
So every test here is written to be run by a human in under a minute, and every one names the thing to click. Not "check for inconsistent formulas" but "select a row, F5, Special, Row differences – every hit is a formula somebody edited by hand". Not "check for external links" but "Data, Edit Links".
SEVERITY IS BUILT INTO THE ARITHMETIC. Three means a defect that makes the output wrong or the file unusable. Two means a defect that will cause an error under maintenance. One means it makes review slower without changing an answer today. The score is weighted points earned over weighted points available, so a failure on "the balance sheet balances" costs three times what a failure on "the print area is set" costs.
NOT APPLICABLE REMOVES A TEST FROM BOTH SIDES. Marking a test Not applicable takes it out of the numerator and the denominator, so skipping tests cannot flatter the score. A separate coverage figure reports what share of the tests you actually ran – the number a reader should look at before they look at the grade.
ONE SEVERITY-THREE FAILURE CAPS THE GRADE AT C. Whatever the percentage says. In the worked example in the guide, a model scores 86.5 per cent across 57 tests run – a respectable number – and still grades C, because four of the failures are severity three and one of them is the balance sheet. A model whose balance sheet does not balance is not a model with a small problem, and an average is the wrong way to say so.
THE EIGHT CATEGORIES
Structure and navigation (8 tests) – inputs, calculations and outputs separated; one input tab; inputs buried inside formulas; hidden rows, columns and sheets.
Formula integrity (10) – circular references and iterative calculation; formulas consistent across a row; hardcoded overrides pasted on top of calculations; error values; error suppression that hides real errors; volatile functions; approximate-match lookups; external links; broken names.
The three statements (8) – whether the balance sheet balances exactly and whether the check is an identity rather than a plug; cash coming from the cash flow statement; retained earnings rolling forward; asset and debt schedules rolling forward and closing where they should.
Time and periods (6) – period headers as formulas; the first forecast period following the last actual; flows and balances not mixed on one row; annualisation stated; day-count conventions; formulas reaching backwards past the start of the model.
Assumptions and drivers (6) – units on every assumption; growth compounding the way the label says; percentages applied to the base the label names; scenario switches that move everything they claim to; the same assumption used twice with two values; sensitivity grids agreeing with the base model.
Financing and covenants (6) – debt drawn beyond its facility; cash going negative with nothing behind it; covenant definitions matching the agreement; headroom reported rather than pass or fail; funding gaps reported rather than plugged.
Tax, valuation and returns (7) – tax losses that cannot go negative; tax on taxable profit rather than EBITDA; discount rates consistent with the cash flows; terminal value cross-checked and not overwhelming the answer; IRR on a signed and complete cash flow; an explicit bridge from enterprise to equity value.
Presentation and control (10) – whether there is a check tab and whether its tests measure numbers rather than opinions; number formats; sign conventions; macros; passwords and locked cells; another client's name in the document properties; stale comments; the print area; the tab the file opens on.
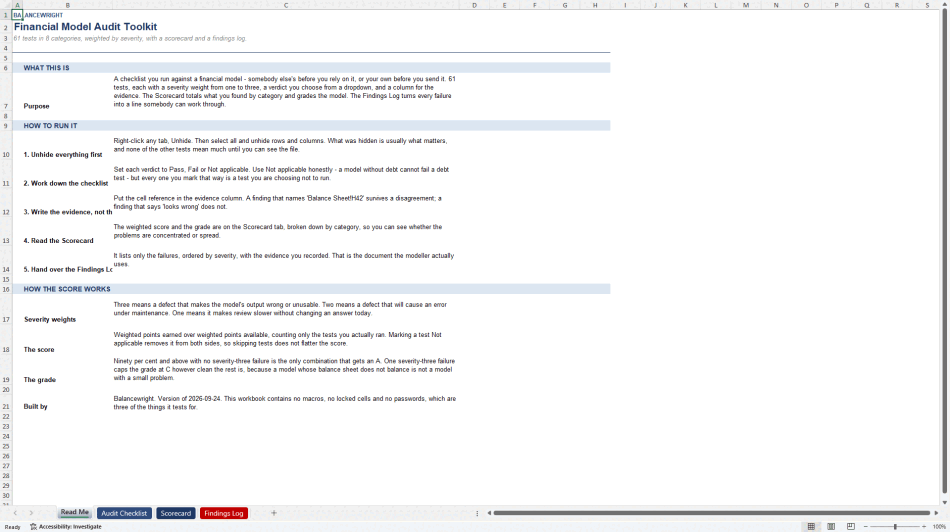
HOW TO RUN IT. Unhide everything first – right-click any tab, Unhide, then select all and unhide rows and columns; what was hidden is usually what matters. Work down the checklist setting each verdict. Write the evidence, not the opinion: a finding that says "Balance Sheet!H42 is out by $1,240 in year six" survives a disagreement with the person who built the model, and one that says "the balance sheet looks wrong" does not. Read the scorecard by category first, then the grade. Hand over the findings log.
TABS: Read Me, Audit Checklist, Scorecard, Findings Log.
WHO IT IS FOR: the analyst handed a model built by somebody who has left, with a day to decide whether to trust it; the investor or lender doing diligence on a sponsor's numbers who needs the review to be repeatable rather than a matter of how much time was available that week; the modeller who would rather find the client's name in the document properties than have the client find it; the team that wants one standard for what "reviewed" means.
HOW IT IS BUILT: Microsoft Excel (.xlsx). No macros, no add-ins, no external links, no password protection and no locked cells – which are four of the things it tests for. It ships blank on purpose; the verdict and evidence columns are yours to fill.
WHAT IT IS NOT: it is not an add-in and it scans nothing. It is not a substitute for understanding the business – a model can pass all sixty-one tests and still be wrong about the market. It is not audit in the statutory sense and nothing in it constitutes an opinion on financial statements. It is not tied to one model type: it runs against a three-statement model, a project finance model or a real estate proforma without changing the tests.
A 7-page guide and preview PDF, including a completed worked example, is included with the download.
Got a question about the product? Email us at support@flevy.com or ask the author directly by using the "Ask the Author a Question" form. If you cannot view the preview above this document description, go here to view the large preview instead.
Source: Best Practices in Financial Modeling, Audit Management Excel: Financial Model Audit Checklist: 61 Tests, Score & Grade Excel (XLSX) Spreadsheet, Balancewright
ABOUT THE AUTHOR

Balancewright builds working financial models for subscription and recurring-revenue businesses -- cohort retention, revenue movement, unit economics, cash flow and scenario forecasting.
Every model is formula-driven end to end. No locked cells, no passwords, no macros and no external links, so any calculation can be inspected, adapted and audited. Each file ships with a visible
... [read more]
Ask the Author a Question
You must be logged in to contact the author.




























