
E-Commerce Business 10-Year 3 Statement Financial Model – Excel XLSX
Excel (XLSX)
BENEFITS OF THIS DOWNLOADABLE EXCEL DOCUMENT
- Provides a framework for building a bottoms-up eCommerce revenue model driven by traffic, conversion rates, and average order value -- not guesswork.
- Provides a complete system for underwriting DTC brand acquisitions, fundraising rounds, and operating plans with institutional-grade financial rigor.
- Provides a plug-and-play 3-statement financial model purpose-built for eCommerce unit economics, customer cohort modeling, and investor-ready forecasting.
ECOMMERCE EXCEL DESCRIPTION
Curated by McKinsey-trained Executives
🛒 eCommerce Business Financial Model – 10-Year Forecast
The Ultimate Excel Financial Model for eCommerce Founders, Operators & Investors
Stop guessing your unit economics. Stop paying $20,000 for a consultant to build what you can own forever.
If you're launching, scaling, or financing an eCommerce business, your financial model is NOT a spreadsheet.
It's your #1 fundraising weapon. Your investor due diligence armor. Your capital-raising proof of concept.
And this model gives you – fully built and formula-verified – exactly what VCs, PE firms, and lenders demand to see.
💼 What You Get
✅ 10 Fully Linked Excel Worksheets
✅ 1,417+ Active, Verified Excel Formulas
✅ 10-Year Annual Forecast (Year 1 – Year 10)
✅ Complete 3-Statement Model: Income Statement, Balance Sheet & Cash Flow
✅ 6 Separate Revenue Streams Built from Operational Drivers
✅ Full Traffic & Customer Cohort Acquisition Model
✅ CAC, LTV & LTV/CAC Ratio Built into Every Year
✅ Sensitivity Analysis & 5-Scenario Comparison Table
✅ Executive Dashboard with KPI Cards & Full 10-Year Trend Table
✅ 66 Blue-Coded Assumption Inputs – Change One Cell, Everything Updates
✅ Works in Microsoft Excel & Google Sheets
This is not a generic financial model template.
This is a complete, eCommerce-specific financial modeling system.
🎯 Who This Is For
• DTC brand founders raising Seed, Series A, or Series B capital
• Private equity firms and growth equity investors underwriting eCommerce acquisitions
• Amazon, Shopify, and marketplace sellers planning institutional-grade expansion
• eCommerce operators building board-ready annual operating plans
• Consumer goods investors evaluating DTC brand unit economics
• Real estate and retail operators launching omnichannel eCommerce divisions
• FP&A analysts and fractional CFOs serving eCommerce clients
• Venture capital analysts building bottoms-up revenue models
• MBA and CFA candidates learning eCommerce financial modeling
• Boutique M&A advisors representing DTC brand sell-side mandates
If you analyze, develop, finance, or operate an eCommerce business – this was built for you.
🔥 Why Most eCommerce Financial Models Fail
Generic templates focus on:
• Simple revenue = last year × growth percentage
• No concept of website traffic, conversion rates, or average order value
• No customer cohort modeling or repeat purchase dynamics
• No CAC tracking or LTV/CAC ratio analysis
• No inventory roll-forward or days inventory outstanding
• No fulfillment cost modeling: pick, pack, ship, and returns
• No marketing efficiency: ROAS, CAC decay, or channel-level spend
• No eCommerce-specific KPIs or working capital mechanics
This model fixes all of that – from the ground up.
📚 What's Inside – Every Tab, Every Formula
Tab 1: Dashboard
• 16 auto-updating KPI cards: Total Revenue, Gross Profit, EBITDA, Net Income, Cash Balance, Gross Margin %, EBITDA Margin %, Net Margin %, CAC, LTV, LTV/CAC Ratio, Average Order Value, Conversion Rate, Active Customers, Total Orders, and Revenue per Customer
• Full 10-year trend table spanning all critical P&L, cash flow, and customer metrics
• Fully formula-driven – no manual data entry required on the Dashboard
• Designed for investor presentations, board reporting, and lender packages
Tab 2: Assumptions
• 66 blue-coded input cells – the single source of truth for the entire model
• Section A – Traffic & Customer Metrics: starting traffic, blended traffic growth, conversion rate, annual conversion rate improvement, AOV, AOV growth, new customer percentage, repeat purchase rate, CAC, CAC efficiency trajectory, LTV gross margin input
• Section B – Revenue Channel Mix: DTC website %, marketplace %, wholesale % – fully adjustable channel architecture
• Section C – Cost of Goods Sold: product/merchandise cost %, supplier cost inflation, packaging cost %, payment processing %, returns rate, return processing cost %, inventory shrinkage rate
• Section D – Fulfillment & Logistics: outbound shipping cost per order, pick and pack cost per order, warehouse/3PL rent, returns processing cost per return, annual fulfillment cost inflation
• Section E – Marketing: marketing spend as % of revenue, annual marketing efficiency improvement, affiliate/influencer allocation %, email platform cost
• Section F – Personnel & Overhead: Year 1 personnel cost, annual headcount growth, technology platform cost, technology growth rate, G&A cost, G&A growth rate
• Section G – Working Capital & Financing: DIO, DSO, DPO, prepaid %, accrued expenses %, tax rate, CapEx %, D&A rate, starting cash, equity raise years 1 and 3, debt structure, interest rate, minimum cash threshold
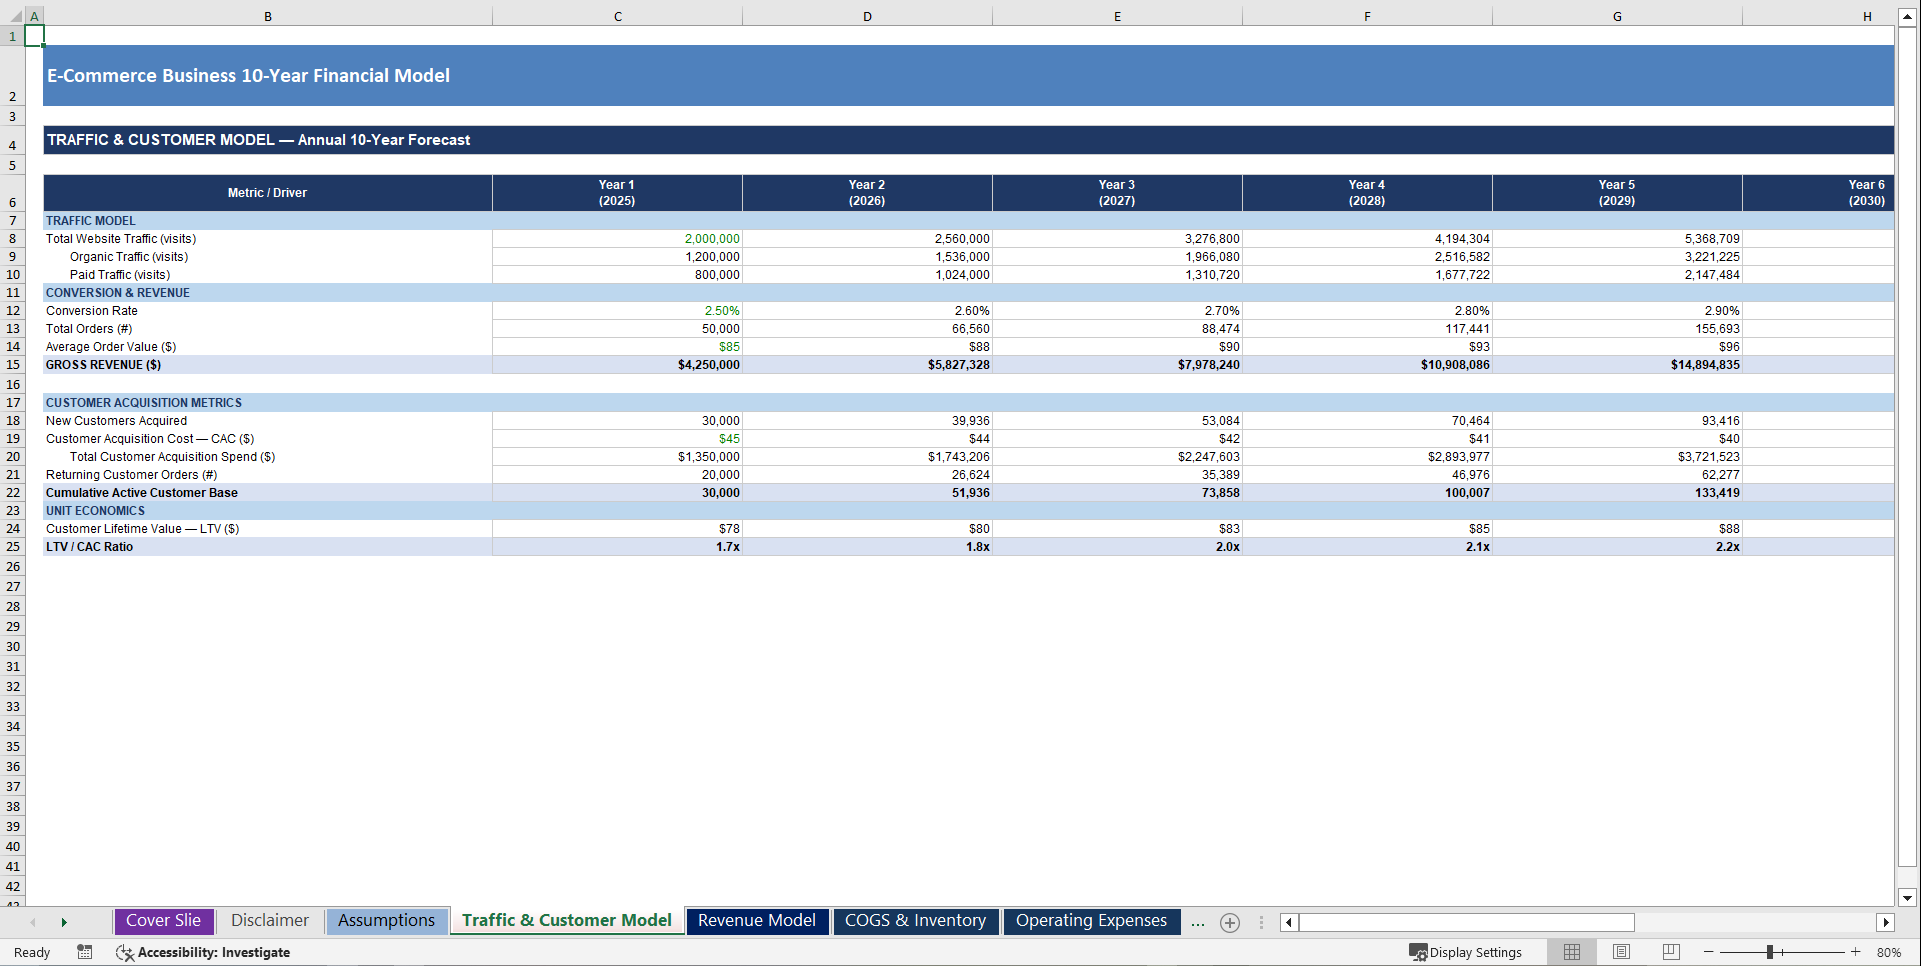
Tab 3: Traffic & Customer Model
• Annual website traffic built from a compound growth driver – not a percentage guess
• Organic vs. paid traffic split modeled separately for 10 years
• Conversion rate with annual improvement trajectory baked in
• Total orders calculated as Traffic × Conversion Rate for every year
• Average Order Value with annual pricing and upsell escalation
• Gross Revenue = Traffic × Conversion × AOV – pure operational build
• New customers acquired and CAC with a configurable annual efficiency improvement curve
• Total customer acquisition spend linked directly to marketing and cash flow
• Returning customer orders separated from new customer orders
• Cumulative active customer base roll-forward – retention and churn baked in
• LTV calculated as AOV ÷ (1 − Repeat Rate) × Gross Margin
• LTV/CAC ratio auto-calculated for every year – the metric every investor will ask for first
Tab 4: Revenue Model
• Revenue Stream 1 – Gross Revenue: built entirely from traffic, conversion, and AOV drivers
• Revenue Stream 2 – Returns & Refunds Waterfall: gross-to-net deduction at configurable return rate
• Revenue Stream 3 – Net Revenue by Channel: DTC website, marketplace, and wholesale revenue split automatically from net revenue percentage assumptions
• Year-over-year revenue growth percentage calculated automatically
• Revenue per active customer benchmarking for every year
• Channel revenue check formula confirms channel totals equal net revenue – zero reconciliation errors
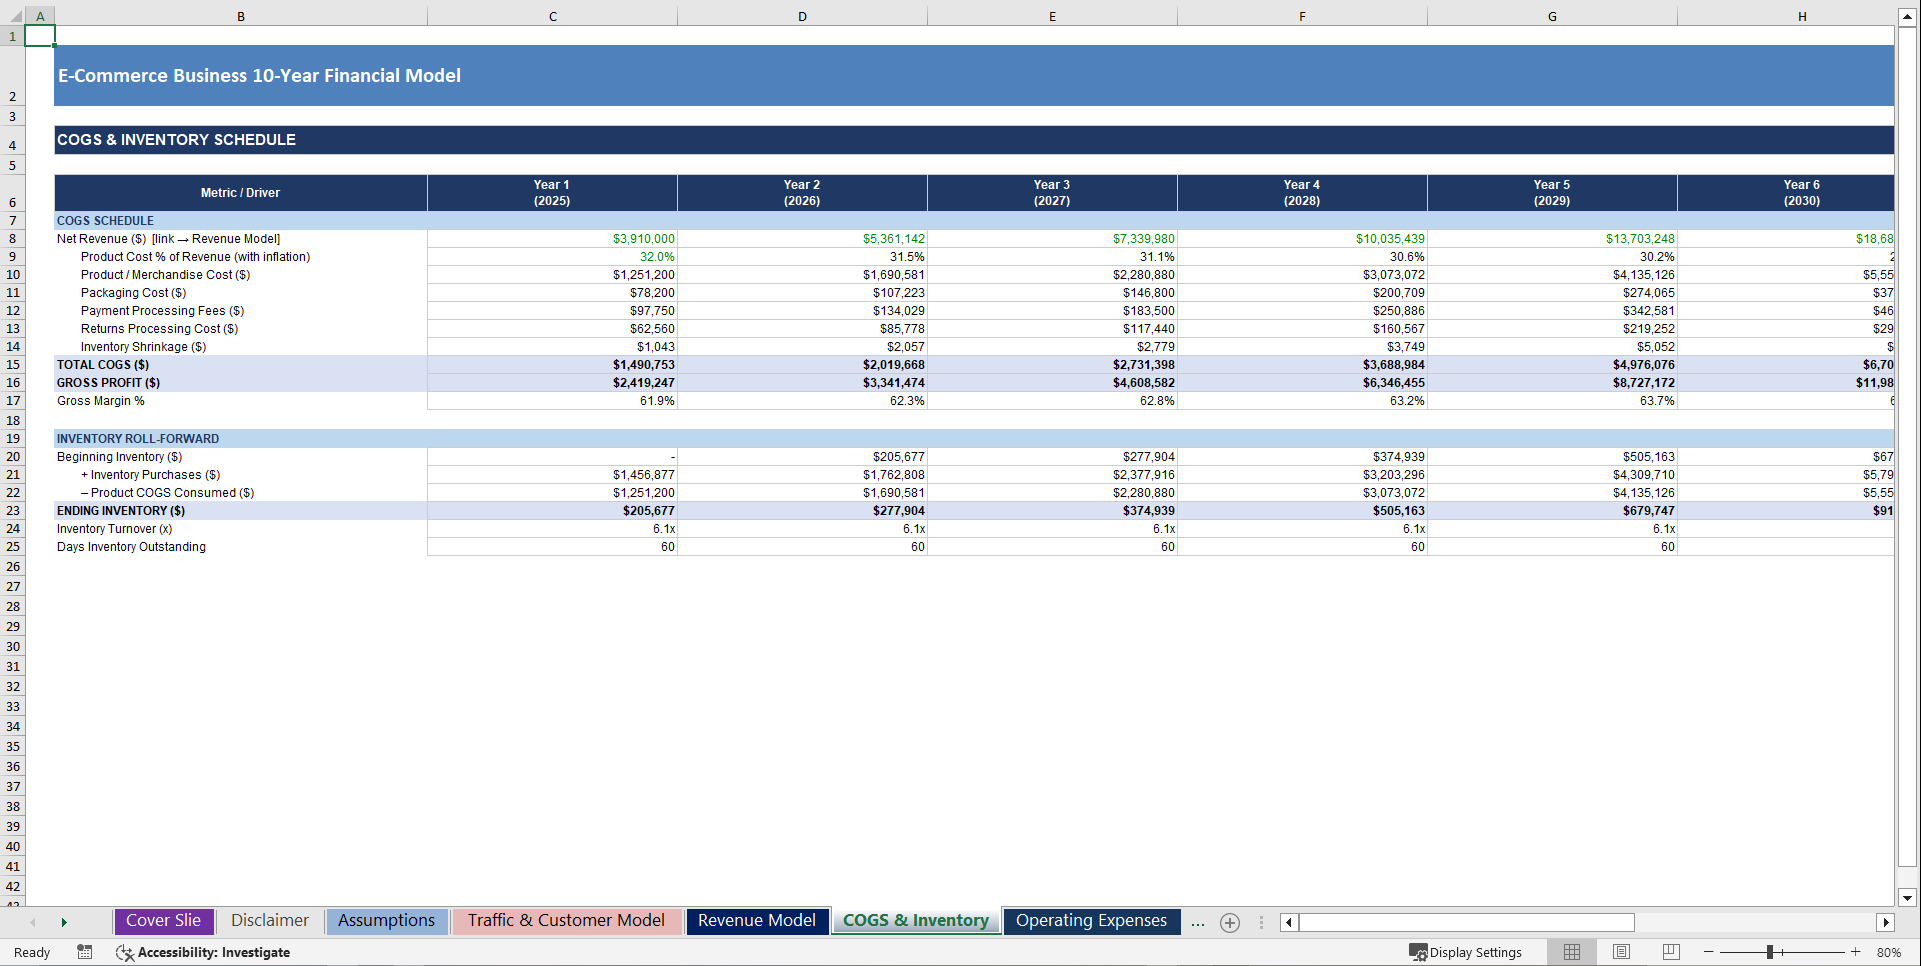
Tab 5: COGS & Inventory Schedule
• 6 line-item COGS schedule fully driven by operational metrics – not hardcoded guesses
• Product/merchandise cost escalated annually with configurable supplier inflation, offset by AOV growth efficiency
• Packaging cost as percentage of net revenue
• Payment processing fees as percentage of net revenue
• Returns processing cost driven by return rate and per-return cost assumption
• Inventory shrinkage driven by ending inventory balance
• Full inventory roll-forward: Beginning Inventory + Purchases − COGS Consumed = Ending Inventory
• Ending inventory dynamically sized by Days Inventory Outstanding assumption
• Inventory turnover ratio and DIO calculated for every year
• Gross profit and gross margin percentage output for every year
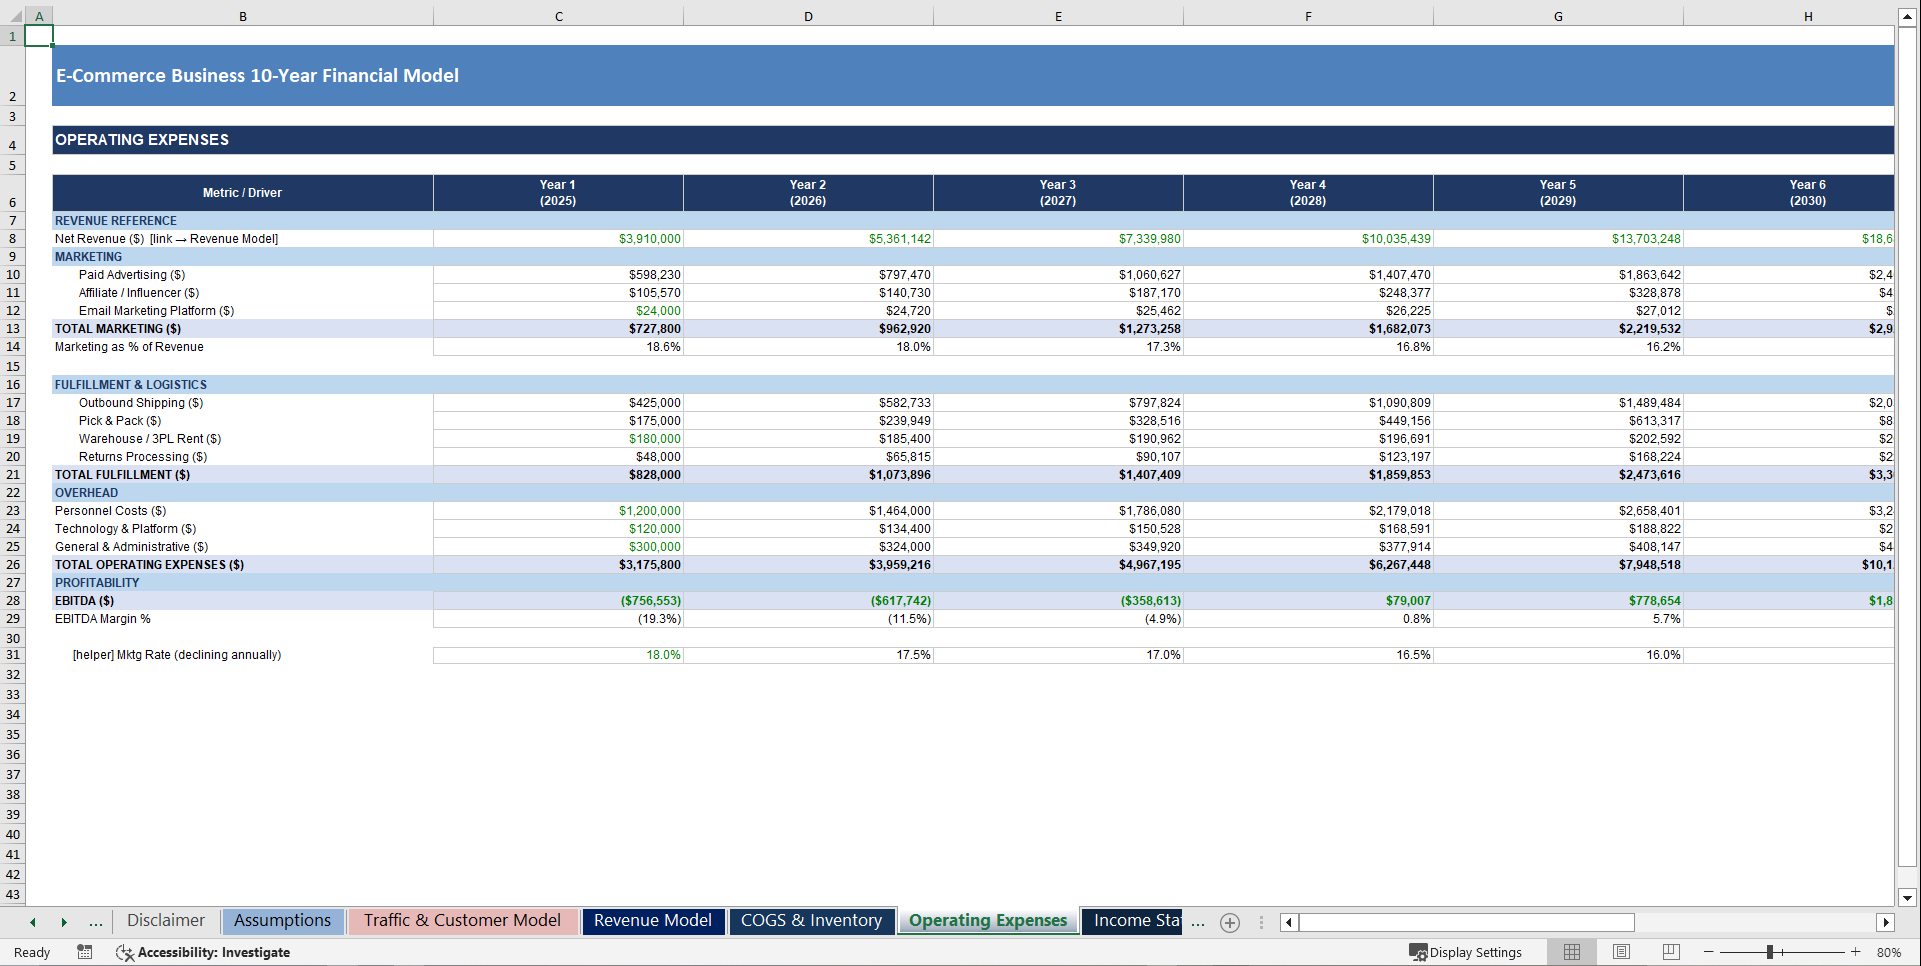
Tab 6: Operating Expenses
• Marketing broken into paid advertising, affiliate/influencer, and email platform – not a single lump sum
• Marketing spend rate with configurable annual efficiency improvement – models scale leverage
• Fulfillment schedule: outbound shipping, pick and pack, warehouse/3PL rent, and returns processing all modeled per-order
• Personnel costs with annual headcount growth assumption driving compounding cost trajectory
• Technology and platform costs with annual growth rate
• G&A costs with annual growth rate
• EBITDA and EBITDA margin percentage output for every year
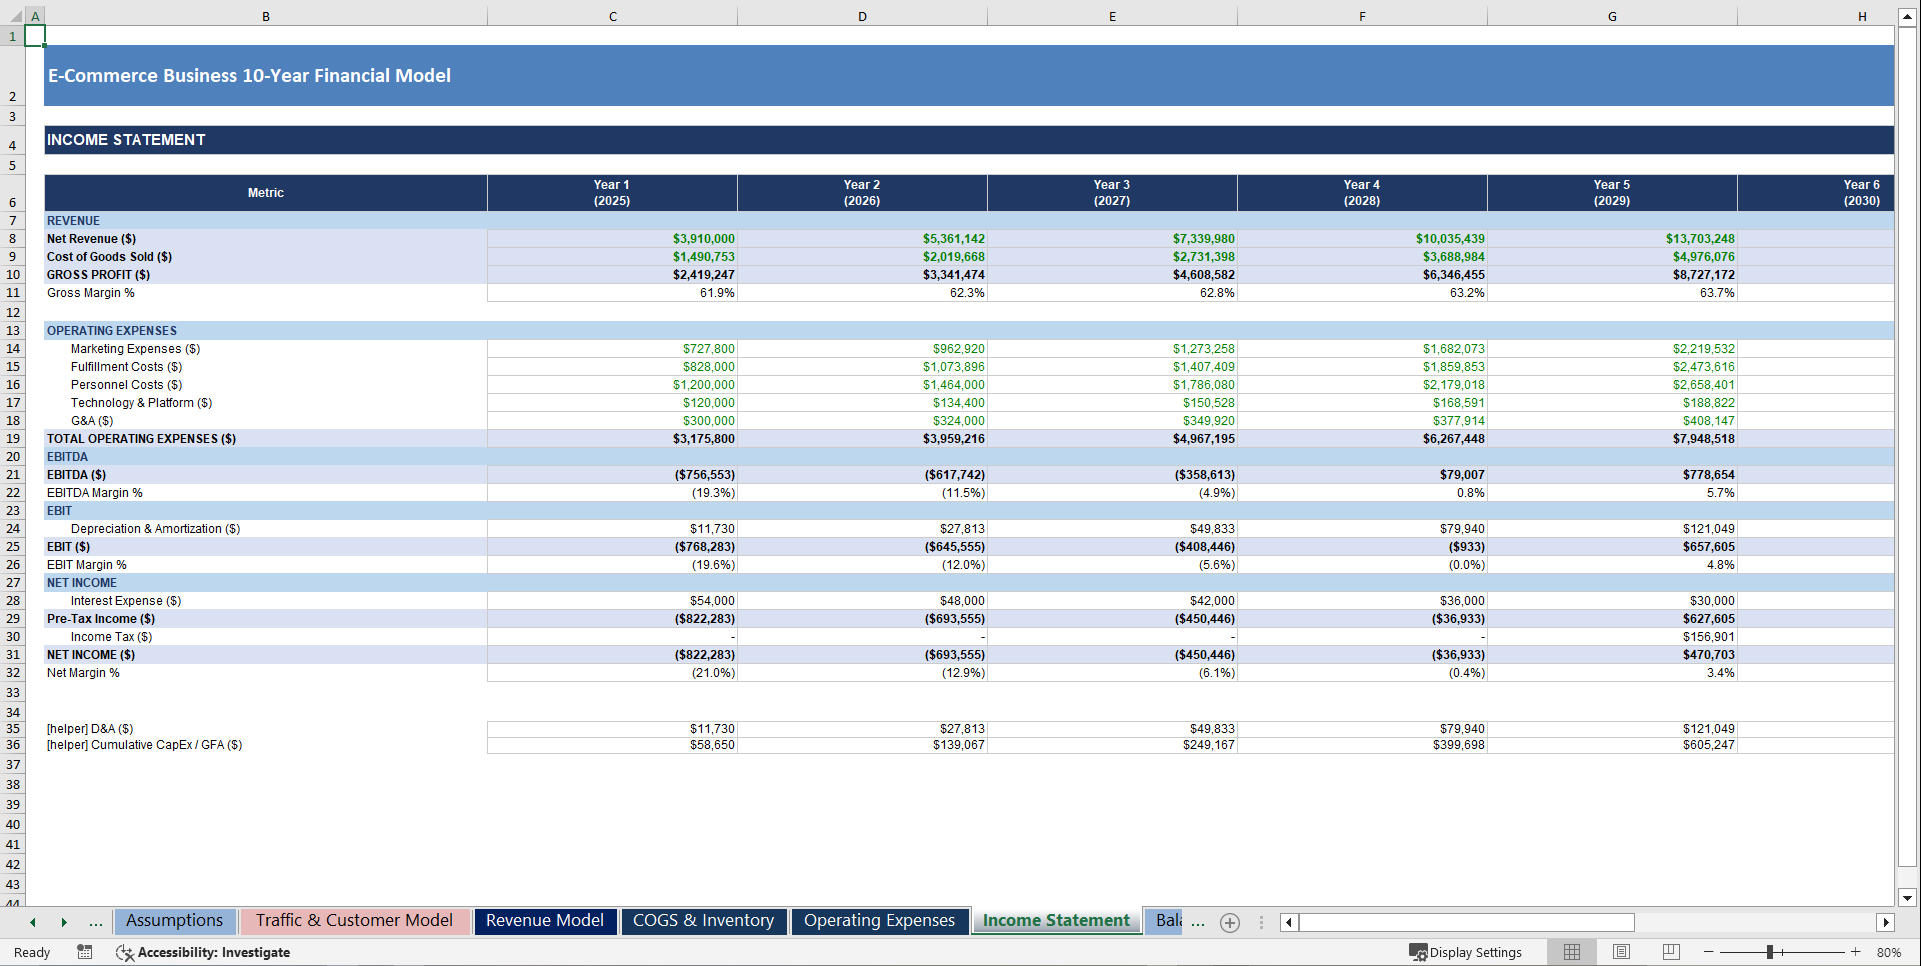
Tab 7: Income Statement
• Full GAAP-format P&L for Years 1–10
• Net Revenue from Revenue Model
• Total COGS from COGS Schedule
• Gross Profit and Gross Margin %
• Total Operating Expenses broken into Marketing, Fulfillment, Personnel, Technology, and G&A
• EBITDA and EBITDA Margin %
• Depreciation and Amortization driven by cumulative CapEx schedule
• EBIT and EBIT Margin %
• Interest expense on debt balance with annual amortization
• Pre-Tax Income
• Income Tax Expense at configurable rate with loss carry-forward logic
• Net Income and Net Margin % for every year
Tab 8: Balance Sheet
• Current Assets: Cash (hard-linked from Cash Flow Statement), Accounts Receivable, Inventory, Prepaid and Other Current Assets
• Non-Current Assets: Gross PP&E (cumulative CapEx), Accumulated Depreciation roll-forward, Net PP&E
• Current Liabilities: Accounts Payable (DPO-driven), Accrued Expenses (% of OpEx), Long-Term Debt
• Equity: Paid-in Capital (equity raises in Year 1 and Year 3), Retained Earnings (cumulative net income roll-forward)
• Balance check formula confirms Total Assets = Total Liabilities + Equity for all 10 years – zero reconciliation risk
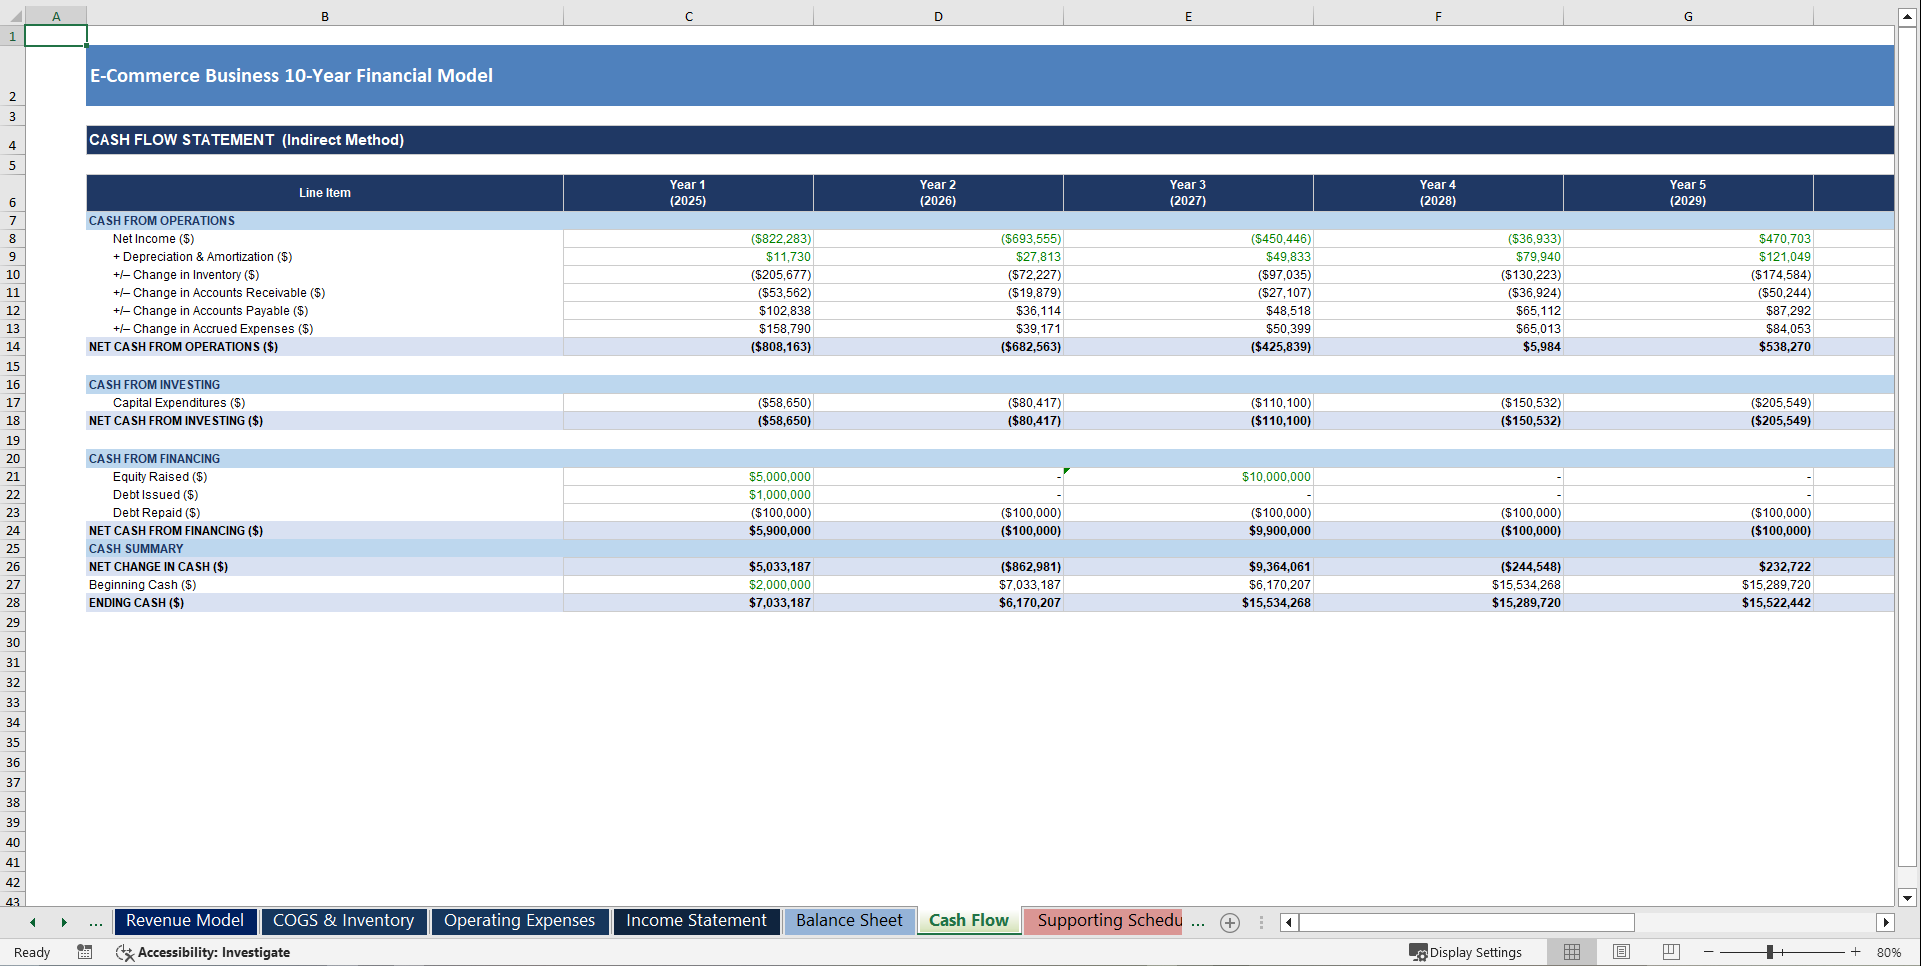
Tab 9: Cash Flow Statement (Indirect Method)
• Operating Activities: Net Income + D&A + changes in Inventory, AR, AP, and Accrued Expenses
• Investing Activities: Annual CapEx outflows
• Financing Activities: Equity raised, debt issued, and annual debt repayment schedule
• Net change in cash per year
• Beginning cash balance roll-forward linked from prior year ending balance
• Ending cash balance hard-linked to Balance Sheet cash line – the integration test every lender runs
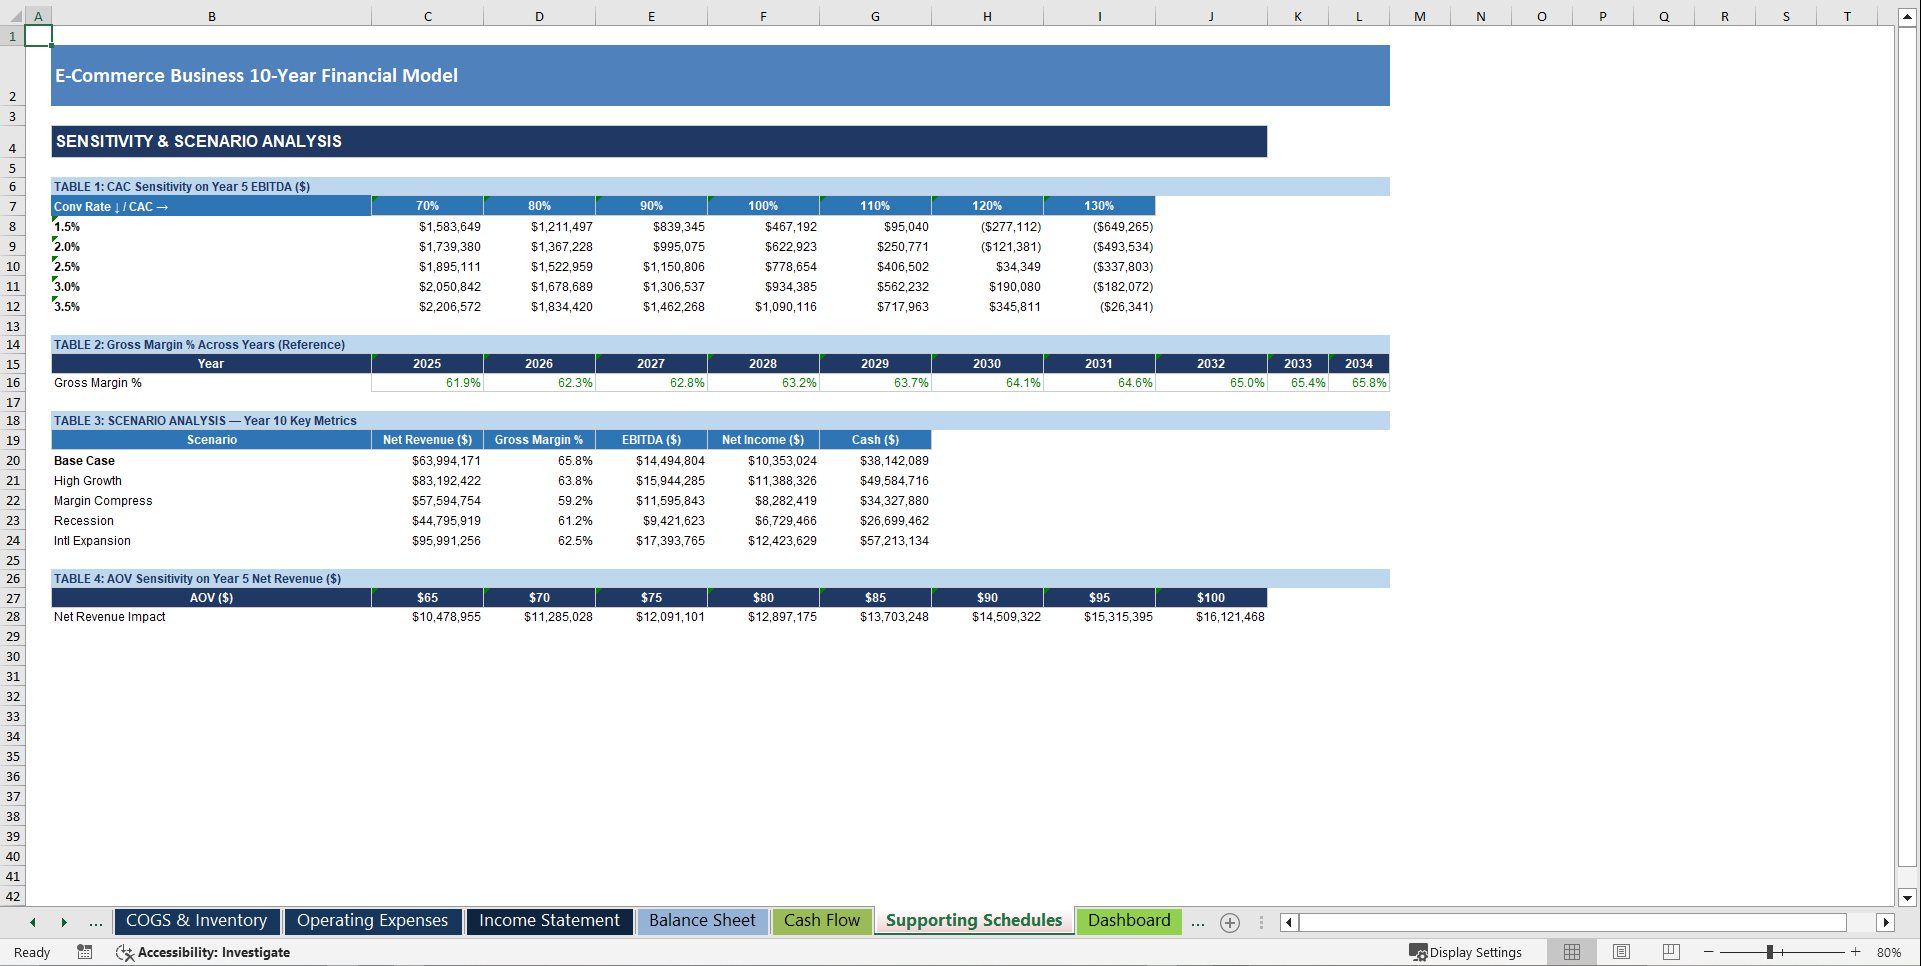
Tab 10: Supporting Schedules & Sensitivity Analysis
• Table 1 – CAC × Conversion Rate EBITDA Sensitivity: 35-cell matrix showing Year 5 EBITDA across 5 conversion rate scenarios and 7 CAC multiplier scenarios – instantly reveals your breakeven customer acquisition economics
• Table 2 – Gross Margin Trend Table: gross margin percentage pulled directly from Income Statement for all 10 years – spot margin compression before investors do
• Table 3 – Six-Scenario Comparison: Base Case, High Growth, Margin Compression, Recession, and International Expansion – each showing Year 10 Revenue, Gross Margin, EBITDA, Net Income, and Cash Balance
• Table 4 – AOV Sensitivity: 8-point AOV sensitivity table showing Year 5 Net Revenue impact across $65–$100 AOV range – quantifies the revenue upside from upsell and pricing strategy
🔢 Excel Functions & Formula Mechanics Used
• SUM / SUMIF – revenue aggregation, COGS rollups, OpEx totals
• IF / nested IF – year-1 ramp logic, zero-guard formulas eliminating all #DIV/0! errors, balance check pass/fail
• Power operator (^) – compound rate escalation: (1 + rate)^(Year − 1) for pricing, costs, salaries, and traffic growth
• MAX / MIN – debt repayment floor, tax loss carry-forward logic, cash floor calculations
• Cross-sheet formula links – every forecast tab references Assumptions!, Traffic & Customer Model!, Revenue!, COGS!, and Operating Expenses!
• Inventory roll-forward – Beginning + Purchases − COGS Consumed = Ending, chained across all 10 years
• Retained earnings roll-forward – prior year balance + current year net income, auto-chained
• Working capital delta calculations – change in Inventory, AR, AP, and Accruals for indirect Cash Flow Statement
• Balance check formula – Total Assets minus Total Liabilities & Equity verified to zero for all 10 years
• LTV/CAC formula – built from AOV, repeat purchase rate, and gross margin – the unit economics engine investors dissect first
💎 PLUS: Sensitivity & Scenario Analysis Built In
This is NOT a static model with one set of outputs.
It includes:
1️⃣ CAC × Conversion Rate EBITDA Sensitivity Matrix
35-cell matrix showing Year 5 EBITDA across every combination of customer acquisition cost and conversion rate. Instantly reveals your breakeven CAC and the exact conversion rate improvement needed to reach profitability targets.
2️⃣ Five Full Business Scenarios
Base Case – conservative scaling with realistic paid acquisition costs
High Growth – aggressive traffic spend and strong conversion improvement
Margin Compression – rising COGS and supplier cost pressure stress test
Recession – demand softness and CAC spike downside scenario
International Expansion – revenue upside from channel and geography expansion
💰 Why This Model Is Different
This model delivers:
✔ Revenue built from website traffic, conversion rates, and AOV – not a growth percentage multiplied against last year
✔ Customer economics fully modeled: CAC, LTV, LTV/CAC, repeat purchase rate, cumulative customer base
✔ eCommerce-specific cost structure: fulfillment per order, DTC returns, 3PL logistics, inventory working capital
✔ Institutional-grade 3-statement integration – every number ties, every balance sheet balances
✔ Fully transparent assumption architecture – one tab controls 1,417 formulas
✔ Sensitivity analysis built for investor Q&A and lender stress testing
✔ Zero formula errors – verified by automated scan across every formula in the model
It's built for venture-backed DTC brands, eCommerce private equity, consumer growth investors, and acquisition entrepreneurs – not generic business plan templates.
🧠 Built for Real Capital Decisions
This model helps you:
• Underwrite eCommerce acquisitions with institutional rigor
• Build a lender-ready financial package for growth debt and revenue-based financing
• Present to venture capital and private equity with a clean, fully linked 3-statement model
• Stress-test your CAC and gross margin assumptions before committing capital
• Understand your unit economics: LTV/CAC, revenue per customer, EBITDA per order
• Compress months of financial modeling work into hours
🚨 The Cost of NOT Having This
Every fundraise you run without a proper model risks:
• Losing a Series A because your revenue model is a straight-line growth guess
• Failing lender due diligence because your cash flow statement doesn't tie to your balance sheet
• Overpaying for an eCommerce acquisition due to weak COGS and working capital underwriting
• Spending $15,000–$25,000 on a consultant to build what you can own and reuse forever
One funding round modeled correctly could return this investment thousands of times over.
⚡ Stop Building From Scratch. Start Closing Rounds.
If you're serious about:
• Fundraising from institutional investors with a credible, bottoms-up revenue model
• Underwriting eCommerce acquisitions with proper unit economics
• Building a board-ready financial plan your CFO would be proud of
• Saving weeks of financial modeling time on your next deal
This model is your shortcut.
👉 Get the eCommerce Financial Model the Right Way
No hardcoded revenue projections.
No broken formula links.
No wasted weekends rebuilding from scratch.
Just a complete, verified, eCommerce-specific 3-statement financial model – ready to use on your next raise, acquisition, or operating plan.
Download the eCommerce Business Financial Model today – and underwrite your next deal with institutional confidence.
Keywords:
eCommerce financial model Excel, eCommerce 3-statement financial model, DTC brand financial model, Shopify financial model template, eCommerce business plan Excel, eCommerce revenue model, DTC financial model, eCommerce investor model, eCommerce EBITDA model, eCommerce cash flow model, eCommerce CAC LTV model, customer acquisition cost model Excel, LTV CAC ratio financial model, eCommerce unit economics model, eCommerce working capital model, eCommerce inventory model, DTC brand acquisition model, eCommerce underwriting model, eCommerce sensitivity analysis, eCommerce scenario analysis, eCommerce private equity model, eCommerce venture capital model, eCommerce fundraising model, eCommerce Series A model, eCommerce Series B model, DTC brand valuation model, Shopify store financial model, Amazon seller financial model, eCommerce CapEx model, eCommerce PP&E depreciation model, eCommerce gross margin model, eCommerce fulfillment cost model, eCommerce returns model, eCommerce marketing spend model, ROAS financial model, paid acquisition financial model, customer cohort model Excel, repeat purchase rate model, eCommerce traffic conversion model, AOV financial model, average order value model, eCommerce channel model, DTC wholesale marketplace model, eCommerce subscription model, eCommerce working capital schedule, accounts receivable days sales outstanding model, inventory days outstanding eCommerce, eCommerce accounts payable model, eCommerce balance sheet model, eCommerce income statement, eCommerce cash flow statement indirect method, advanced Excel financial model, 3-statement financial model Excel, financial model with sensitivity analysis, financial model with scenario analysis, financial model with debt schedule, financial model with working capital, financial model with PP&E roll-forward, financial model with dashboard, institutional financial model Excel, real estate financial model, consumer brand financial model, growth equity financial model, FP&A Excel template, financial model template download, eCommerce pro forma Excel, DTC pro forma financial model, eCommerce operating model, eCommerce headcount model, eCommerce SaaS cost model, Strategy & Transformation, Growth Strategy, Strategic Planning, Strategy Frameworks, Innovation Management, Pricing Strategy, Core Competencies, Strategy Development, Business Transformation, Marketing Plan Development, Product Strategy, Breakout Strategy, Competitive Advantage, Mission, Vision, Values, Strategy Deployment & Execution, Innovation, Vision Statement, Core Competencies Analysis, Corporate Strategy, Product Launch Strategy, BMI, Blue Ocean Strategy, Breakthrough Strategy, Business Model Innovation, Business Strategy Example, Corporate Transformation, Critical Success Factors, Customer Segmentation, Customer Value Proposition, Distinctive Capabilities, Enterprise Performance Management, KPI, Key Performance Indicators, Market Analysis, Market Entry Example, Market Entry Plan, Market Intelligence, Market Research, Market Segmentation, Market Sizing, Marketing, Michael Porter's Value Chain, Organizational Transformation, Performance Management, Performance Measurement, Platform Strategy, Product Go-to-Market Strategy, Reorganization, Restructuring, SWOT, SWOT Analysis, Service 4.0, Service Strategy, Service Transformation, Strategic Analysis, Strategic Plan Example, Strategy Deployment, Strategy Execution, Strategy Frameworks Compilation, Strategy Methodologies, Strategy Report Example, Value Chain, Value Chain Analysis, Value Innovation, Value Proposition, Vision Statement, Corporate Strategy, Business Development, Business plan pdf, business plan, PDF, Business Plan DOC, Business Plan Template, PPT, Market strategy playbook, strategic market planning, competitive analysis tools, market segmentation frameworks, growth strategy templates, product positioning strategy, market execution toolkit, strategic alignment playbook, KPI and OKR frameworks, business growth strategy guide, cross-functional strategy templates, market risk management, market strategy PowerPoint doc, guide, ebook, e-book ,McKinsey Change Playbook, Organizational change management toolkit, Change management frameworks 2025, Influence model for change, Change leadership strategies, Behavioral change in organizations, Change management PowerPoint templates, Transformational leadership in change, supply chain KPIs, supply chain KPI toolkit, supply chain PowerPoint template, logistics KPIs, procurement KPIs, inventory management KPIs, supply chain performance metrics, manufacturing KPIs, supply chain dashboard, supply chain strategy KPIs, reverse logistics KPIs, sustainability KPIs in supply chain, financial supply chain KPIs, warehouse KPIs, digital supply chain KPIs, 1200 KPIs, supply chain scorecard, KPI examples, supply chain templates, Corporate Finance SOPs, Finance SOP Excel Template, CFO Toolkit, Finance Department Procedures, Financial Planning SOPs, Treasury SOPs, Accounts Payable SOPs, Accounts Receivable SOPs, General Ledger SOPs, Accounting Policies Template, Internal Controls SOPs, Finance Process Standardization, Finance Operating Procedures, Finance Department Excel Template, FP&A Process Documentation, Corporate Finance Template, Finance SOP Toolkit, CFO Process Templates, Accounting SOP Package, Tax Compliance SOPs, Financial Risk Management Procedures.
NOTE: Our digital products are sold on an "as is" basis, making returns and refunds unavailable post-download. Please preview and inquire before purchasing. Please contact us before purchasing if you have any questions! This policy aligns with the standard Flevy Terms of Usage.
Got a question about the product? Email us at support@flevy.com or ask the author directly by using the "Ask the Author a Question" form. If you cannot view the preview above this document description, go here to view the large preview instead.
Source: Best Practices in Ecommerce, Integrated Financial Model Excel: E-Commerce Business 10-Year 3 Statement Financial Model Excel (XLSX) Spreadsheet, SB Consulting
ABOUT THE AUTHOR
SB Consulting is dedicated to empowering businesses to communicate their ideas with impact. This consulting firm specializes in teaching organizations how to create effective corporate and management presentations. With training from top-tier global consulting firms, including McKinsey, BCG, and Porsche Consulting, extensive expertise in presentation design and ... [read more]
Ask the Author a Question
You must be logged in to contact the author.
