
Dynamic Arrays Financial Model – Excel XLSX
Excel (XLSX)
BENEFITS OF THIS DOWNLOADABLE EXCEL DOCUMENT
- The particularity of this model is that it is built entirely with dynamic arrays.
- This allows the user to use less formulas and can be checked fairly easily compared to a multi cell approach to modeling
- Additionally the model uses the "matrix" logic of the dynamic arrays for calculations.
INTEGRATED FINANCIAL MODEL EXCEL DESCRIPTION
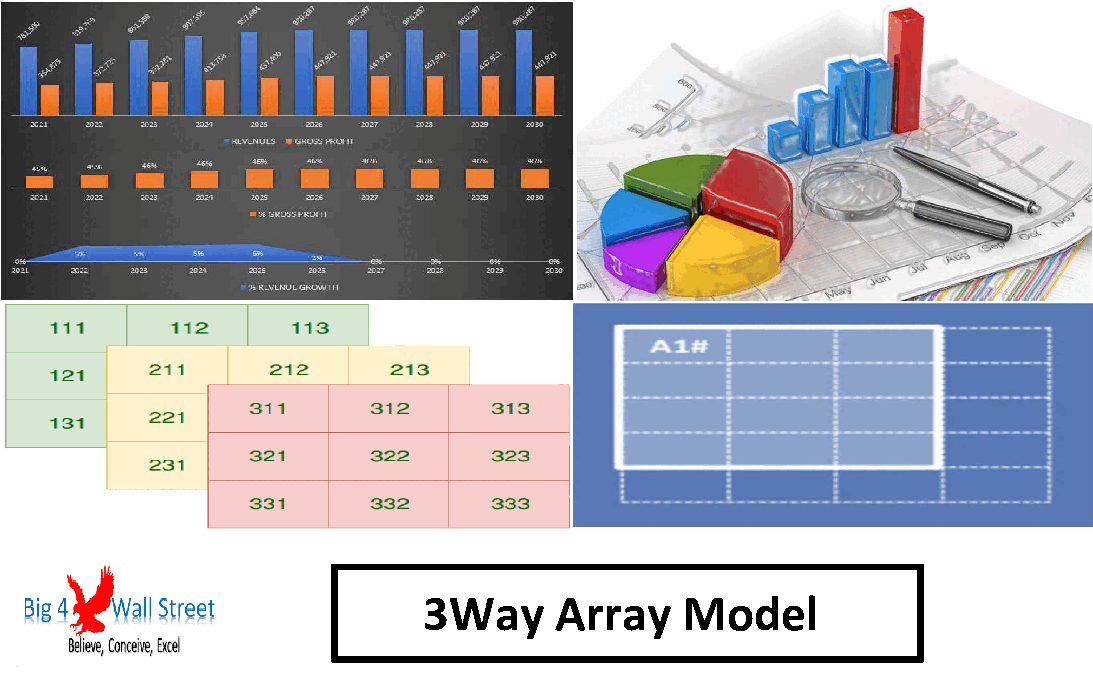
Dynamic Arrays Financial Model generates the three financial statements (profit & loss, balance sheet and cash flow), as well as a valuation based on the free cash flows to the firm and a series of graphs.
The particularity of this model is that it is built entirely with dynamic arrays. This allows the user to use less formulas and can be checked fairly easily compared to a multi cell approach to modeling, as dynamic arrays do not allow hardcoded numbers in subsequent cells.
Additionally the model uses the "matrix" logic of the dynamic arrays for calculations. Therefore the model is flexible in terms of the forecast years (the user can choose the number of forecast years) as well as the number of products the company has, which means that the calculations do not need updating as long as the relevant assumptions have been filled within the model.
The above save a lot of time to the user in case more products or more forecast years are needed.
So, a quick overview of the model, in the Contents tab you can see the structure of the model and by clicking on any of the headlines to be redirected to the relevant worksheet.
On the General Assumptions tab, there is a description of the color coding of the model. Inputs are always depicted with a yellow fill and blue letters, while calculations are depicted with white fill and black characters.
A color coding is also applied to the various tabs of the model. Yellow tabs are mostly assumptions tabs, blue tabs are outputs tabs (that is effectively results or graphs) and finally light blue tabs are admin tabs (for example: the cover page, contents and checks).
Moving on to the Inputs tab (yellow cells in the yellow tabs): the user needs to fill the various assumptions as follows:
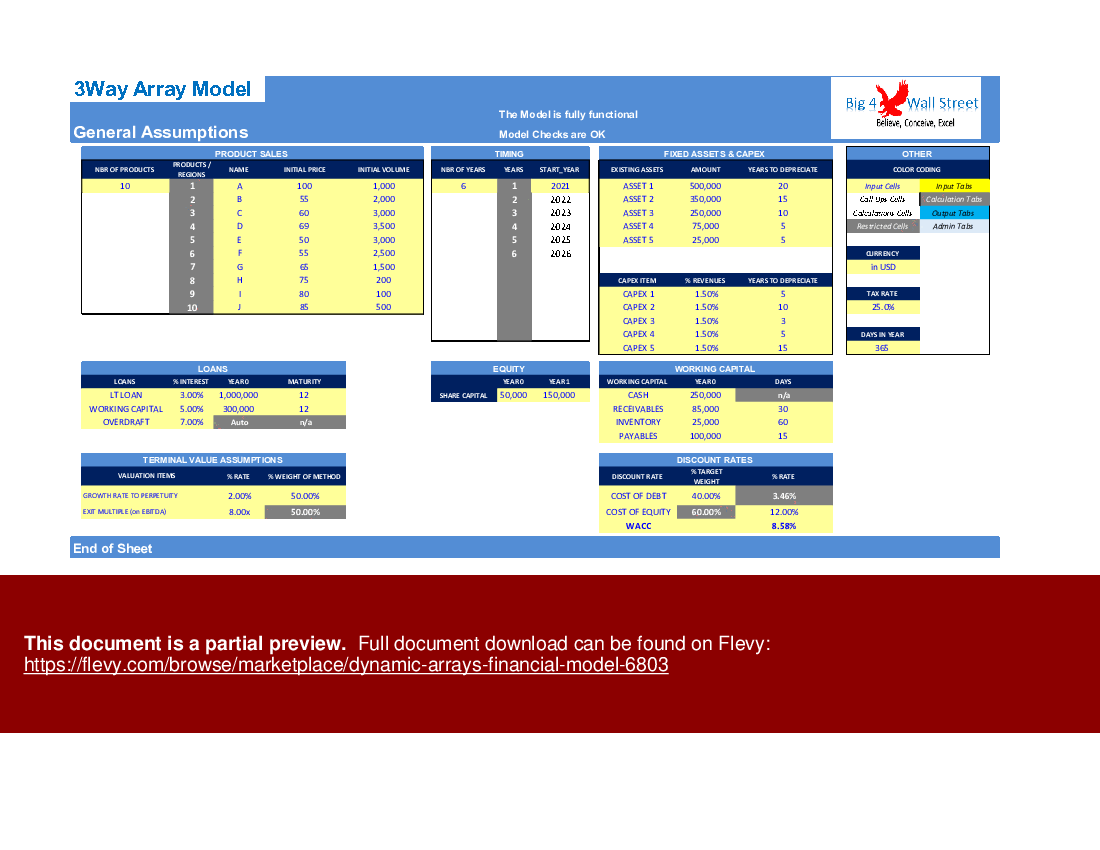
– In the General Assumptions tab, the user can amend the number of products, the forecast years, the fixed assets and capex, loans, equity, working capital, discount rates, as well as terminal value assumptions.
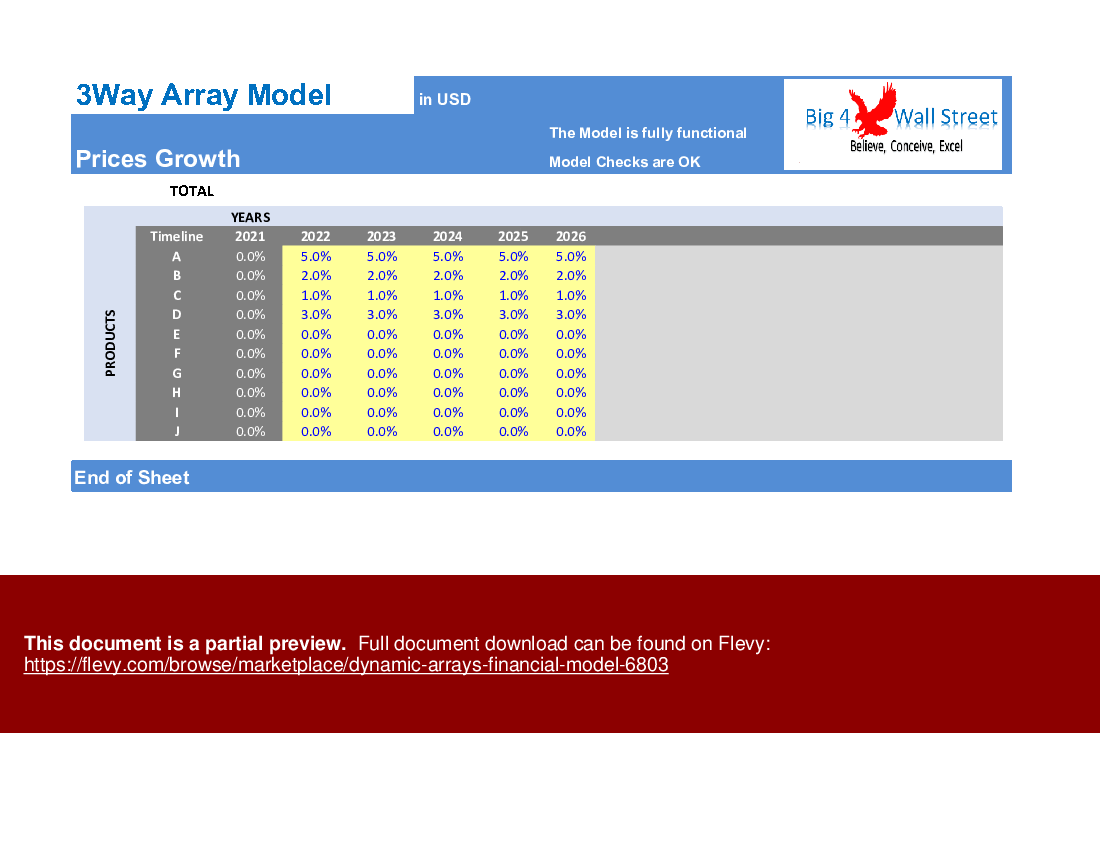
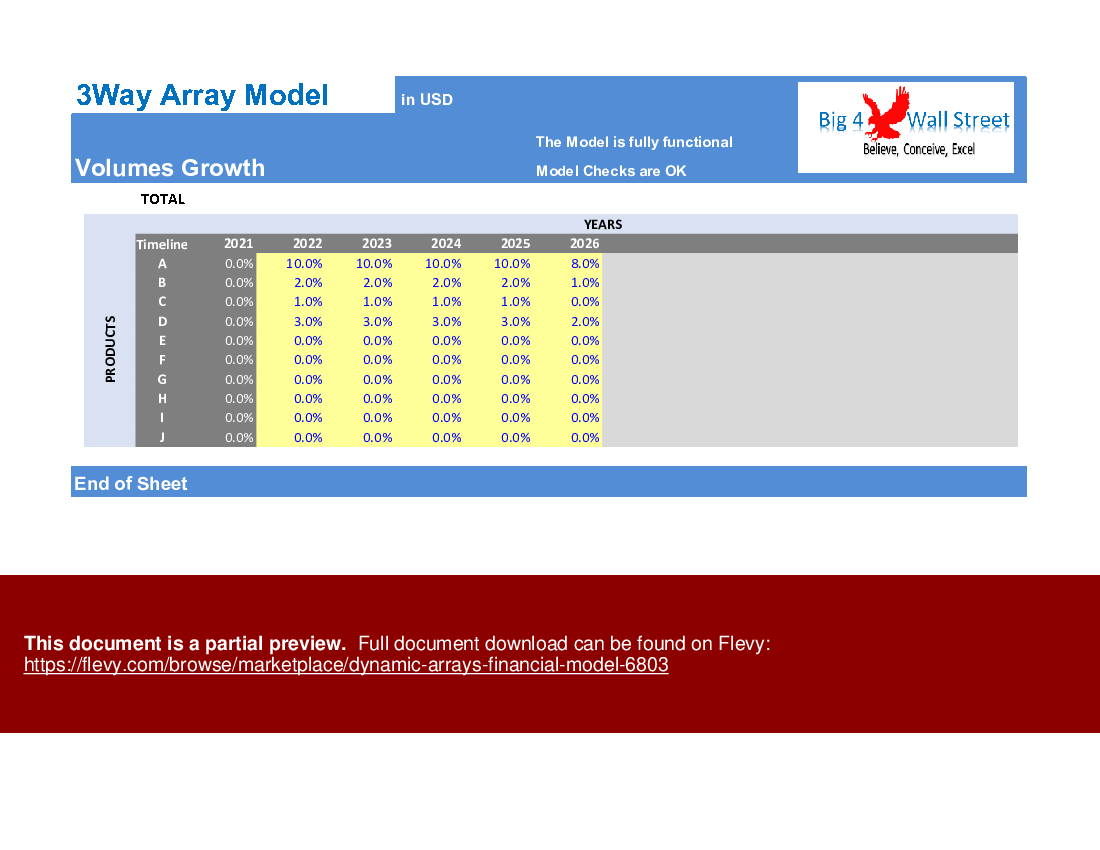
– Growth rates of price and volumes can be amended on the Price Growth and Volume Growth tabs respectively.
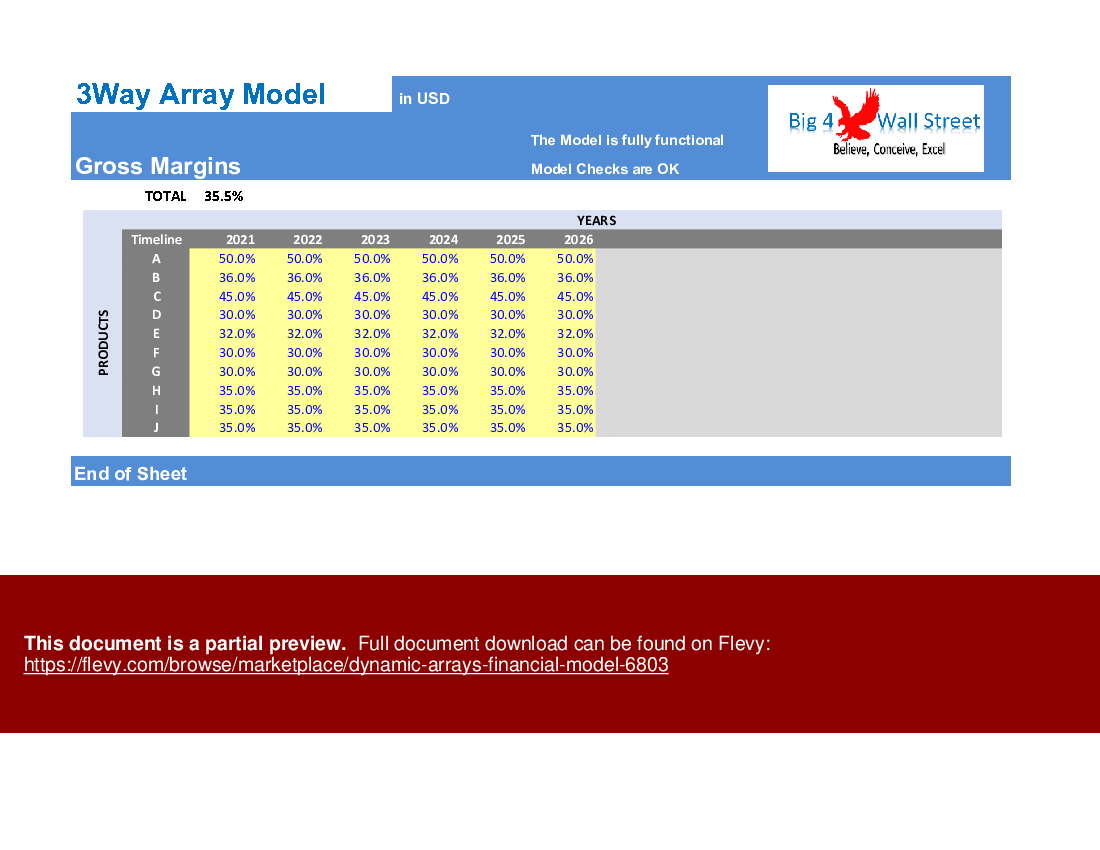
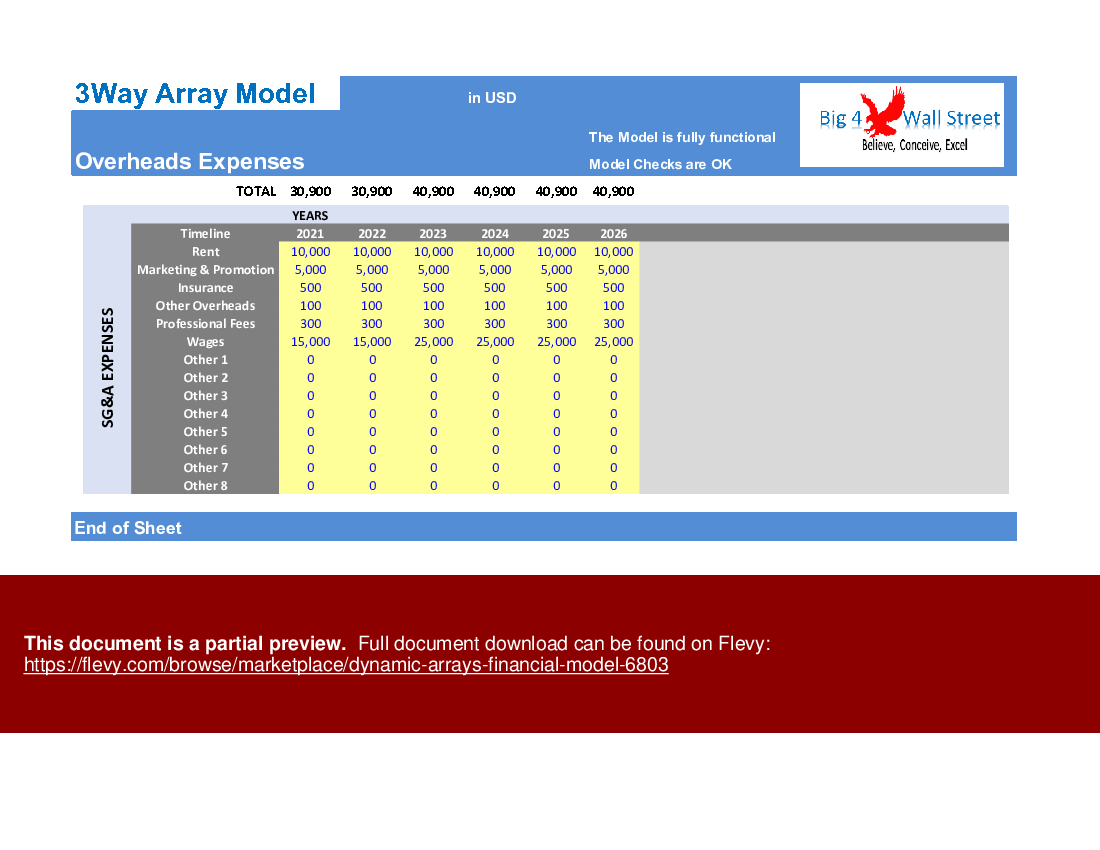
– Finally, Gross Margins and Operating Expenses Overheads can be amended on the Gross Margin and SG&A tabs respectively.
Conditional formatting has been applied to indicate to you the range you need to fill (in yellow).
The following tabs calculate the corresponding figures prices, volumes, revenues, gross profits, capex / depreciation, debt financing, and working capital. No inputs from the user are needed here.
Afterwards, we get to the outputs which consist of the financial statements (profit and loss, balance sheet and cash flow), these are populated automatically based on your assumptions. The valuation which is based on the discount rates and exit assumptions you have set in the general assumptions. The time horizon of the forecast is also the exit year of the company where the terminal value is calculated.
The charts are all dynamic and are automatically adjusted to the forecast period selected.
Finally, the checks tab where the most critical checks are aggregated. Whenever you see an error message in any page, you should consult this page to see where the error is coming from.
Got a question about the product? Email us at support@flevy.com or ask the author directly by using the "Ask the Author a Question" form. If you cannot view the preview above this document description, go here to view the large preview instead.
Source: Best Practices in Integrated Financial Model Excel: Dynamic Arrays Financial Model Excel (XLSX) Spreadsheet, Big4WallStreet
ABOUT THE AUTHOR
We help small and midsize businesses' leaders with their strategic problems by creating or improving financial models, implementing tools to drive efficiency, performance, and better decision making.
With over 15 years of experience in Financial & Business Modeling / Planning, Performance & Analysis (Ernst & Young, Toyota, Viohalco and Upstream), we have developed strong business
... [read more]
Ask the Author a Question
You must be logged in to contact the author.
