
Data Center Operator 10-Year 3 Statement Financial Model – Excel XLSX
Excel (XLSX)
BENEFITS OF THIS DOWNLOADABLE EXCEL DOCUMENT
- Provides a structured financial framework for planning, funding, and scaling a data center infrastructure business.
- Enables founders and investors to model MW capacity growth, revenue streams, and capital requirements with institutional-grade financial projections.
- Supports strategic decision-making for colocation, hyperscale, and AI compute infrastructure through a fully integrated financial planning model.
DATA CENTER EXCEL DESCRIPTION
Curated by McKinsey-trained Executives
🏗️ Data Center Financial Model – Investor-Ready Excel Pro Forma for Hyperscale Operators, Colocation Developers & AI Compute Hosts
The Ultimate Financial Model for Data Center Founders, Infrastructure Project Finance Teams & Digital Infrastructure Investors
Stop leasing rack space based on gut feeling.
Stop pitching infrastructure investors with back-of-napkin MW utilization math.
Stop underestimating PUE inefficiency, colocation pricing compression, and hyperscale contract renewal lag.
Stop losing money because your projections ignored power cost escalation, equipment depreciation compounding, and construction phase capital drag.
If you are launching a colocation facility, scaling a hyperscale campus, entering an AI compute hosting market, building a multi-site interconnection ecosystem, or raising a Series A – your financial model is not "just a spreadsheet."
It is your:
• #1 Infrastructure Investor Pitch Weapon
• Banking & Project Finance Approval Tool
• Power Cost & PUE Optimization Command Center
• Hyperscale Contract Structuring Engine
• Multi-Site Expansion & Capacity Buildout Roadmap
This model gives you – fully built, fully formula-driven – exactly what infrastructure PE firms, hyperscale anchor tenants, green bond lenders, equipment finance banks, and serious data center operators expect to see in a professional digital infrastructure business plan and 10-year financial projection package.
💼 What You Get
✅ 10-Year Fully Integrated 3-Statement Financial Model (2025–2034)
✅ Annual Revenue & Cash Flow Forecasts Driven by MW Capacity, Rack Utilization & Customer Contracts – Not Simple Growth Percentages
✅ Capacity Buildout Engine Built from MW Additions × Construction Timeline × 5-Phase Expansion Schedule (20 MW → 145 MW)
✅ Revenue Segmented by Contract Type (Colocation, Power Resale, Hyperscale Wholesale, AI/GPU Compute, Interconnection, Cross-Connect, Managed Services, Network Transit)
✅ Revenue Segmented by Customer Segment (Hyperscalers, Enterprise Clients, AI/HPC Operators, Telecom & Network Providers)
✅ Power Cost & PUE Modeling (Electricity Cost per kWh × Total IT Load × PUE Ratio → Gross Power Margin from $2.3M Year 1 to $35.7M Year 10)
✅ Hyperscale Contract Revenue Driven by MW Leased × $/MW/Month × Annual Escalation Clauses ($2.5M Year 1 → $47.3M Year 10)
✅ AI & GPU Compute Premium Pricing with Demand Growth Curve and 2.2× Density Multiplier vs. Standard Colocation ($3.2M Year 1 → $66.0M Year 10)
✅ Interconnection Ecosystem Revenue (IX Fees + Cross-Connect Ports + Network Transit per MW)
✅ Project Cohort Utilization Ramp Curves from 42% Year 1 to 92% Year 10
✅ Corporate Headcount & Salary Build by Role (CEO $350K, CFO $285K, CTO $310K, VP Infrastructure $255K, Network Engineers, DC Technicians, Hardware Engineers, Security Staff, Sales, Account Management, Finance, Support)
✅ CapEx Schedule – Land $480K/MW, Civil Construction $8.5M/MW, Cooling $800K/MW, Electrical Equipment $1.2M/MW, Network & Fiber $280K/MW
✅ PP&E Rollforward with Straight-Line Depreciation by Asset Class (Building 40yr / Equipment 10yr / Network 7yr) – Gross PP&E reaching $1.668B by Year 10
✅ Working Capital Schedule (AR $22.9M, Deferred Revenue $22.9M, AP $11.5M, Accrued Expenses $6.2M by Year 10)
✅ Debt & Equity Schedule (5 Equity Rounds totaling $630M + Project Finance Debt peaking at $810M)
✅ Loan Amortization & Interest Expense Schedule ($3.4M Year 3 → $50.5M Year 10)
✅ Investor-Ready Income Statement (Revenue → Gross Profit → EBITDA → EBIT → EBT → Net Income)
✅ Cash Flow Statement – Indirect Method, Fully Linked, Ending Cash Ties to Balance Sheet
✅ Balance Sheet – Dynamically Balances to Zero Every Single Year (Auditable Check Formula Confirms $0 Variance on All 10 Years)
✅ Scenario & Sensitivity Analysis (3 Scenario Multipliers + 6-Variable Sensitivity Matrix on Year 5 EBITDA)
✅ Executive Dashboard with KPI Cards, 10-Year Summary Table & 4 Embedded Charts
✅ Blue-Coded Assumptions – Change One of 101 Input Cells, All 2,316 Formulas Recalculate Instantly
This is not a generic tech startup spreadsheet.
This is a complete data center financial planning system built for real-world digital infrastructure unit economics and institutional capital raising.
🎯 Who This Is For
• First-time colocation facility founders and hyperscale campus developers
• Multi-site infrastructure operators scaling from 20 MW to 150+ MW
• AI compute hosting entrepreneurs launching GPU cluster leasing platforms
• Edge computing operators and carrier-neutral interconnection hub builders
• Data center project finance teams and public-private partnership developers
• Franchise expansion teams entering new regional data center markets
• SBA, equipment finance, and green infrastructure bond applicants
• Series A & Series B fundraising teams in the digital infrastructure vertical
• Private equity firms evaluating data center roll-ups and platform acquisitions
• Infrastructure funds modeling hyperscale sale-leaseback and build-to-suit transactions
• Consultants building investor decks for capital-intensive digital infrastructure clients
• Accelerators & incubators supporting next-generation AI compute infrastructure startups
If you manage megawatt capacity, deliver rack space, or run contract-driven recurring infrastructure revenue – this was built for you.
🔥 Why Most Data Center Financial Models Fail
Most templates rely on:
• Simple "Revenue = MW × Average Rate" with zero operational logic
• No utilization ramp curve for new capacity expansions or lease-up timelines
• No channel split between hyperscale wholesale, enterprise retail, and AI compute hosting
• No PUE modeling or power resale margin analysis built into gross profit
• No cross-connect fee stack, IX ecosystem revenue, or managed services layering
• No customer cohort ramp-up curve for anchor tenant onboarding
• No backlog conversion rate or percentage-of-completion revenue recognition
• No PP&E rollforward or multi-class equipment depreciation schedule
• No working capital modeling for deferred revenue float and retention receivables
• No equity round or project finance debt integration
• No NOL carryforward tax protection in early high-CapEx loss years
• No multi-site or multi-jurisdiction expansion logic
This model fixes all of that – from the ground up.
📊 What's Inside – Every Major Component
### 1️⃣ Executive Dashboard
Instant investor snapshot including:
• Total Revenue scaling from $15.5M Year 1 to $279.2M Year 10
• Gross Profit & Gross Margin % by Year (63.8%–76.5% range across the decade)
• EBITDA & EBITDA Margin % by Year (50.8%–58.7% at full utilization)
• Net Income & Net Margin % by Year ($6.9M Year 1 → $14.7M Year 10)
• Ending Cash Balance across all 10 years ($138.7M Year 1 → $142.5M Year 10)
• Total MW Capacity, MW Utilization % & Racks Leased by Year (326 racks leased Year 1 → 5,176 Year 10)
• Revenue per Employee scaling from $330K Year 1 to $1.44M Year 10
• Total Customers by Year (22 Year 1 → 100 Year 10)
• 4 Embedded Charts: Revenue & EBITDA Trend / MW Capacity vs. Utilization / Gross & EBITDA Margin Curves / CapEx vs. Revenue
Built for pitch decks, bank meetings, infrastructure fund due diligence, bonding approvals, and board presentations.
2️⃣ Assumptions Engine (Single Source of Truth)
Centralized input section with 101 blue-coded input cells controlling the entire model.
Includes:
• Total MW capacity plan with year-by-year expansion additions (20 MW Year 1, +15 MW Year 3, +30 MW Year 5, +40 MW Year 7, +40 MW Year 9 = 145 MW total)
• Utilization ramp targets by year (42% Year 1 → 92% Year 10)
• Racks per MW (40 racks/MW) and average power density per rack (10 kW/rack)
• PUE ratio of 1.38 driving total power draw from IT load
• Colocation MRR per rack at $1,850/month with 3% annual CPI-linked price escalation
• Power resale price of $0.115/kWh and electricity cost of $0.058/kWh – 98% gross power margin in Year 1
• Hyperscale price of $85,000/MW/month with 2% annual step-up escalation
• Capacity allocation: 30% hyperscale, 20% AI/HPC, 50% enterprise colocation
• AI/GPU compute premium multiplier of 2.2× over standard colocation pricing
• Interconnection fee of $650/customer/month, cross-connect port fee of $350/port/month, 4 ports per customer average
• Managed services at 9% of colocation plus AI compute revenue
• Network transit revenue of $2,200/MW/month
• Customer growth rate of 26%, churn rate of 8%, average contract length of 3.5 years, renewal rate of 83%
• Full personnel build by role with salary, headcount, 4% annual raises, 25% benefits, 8% payroll taxes, 12% SBC
• CapEx per asset class with 3% construction cost inflation applied annually
• Depreciation useful life by asset class (building 40yr, equipment 10yr, network 7yr)
• Equity raise schedule by year across 5 funding rounds
• Debt at 58% of total CapEx, 6.5% interest rate, 12-year tenor
• AR days 30, AP days 45, deferred revenue days 30
• Tax rate, WACC, inflation rate and 3 scenario multiplier inputs (Revenue, CapEx Cost, Churn)
Change one input – all 2,316 formulas recalculate instantly.
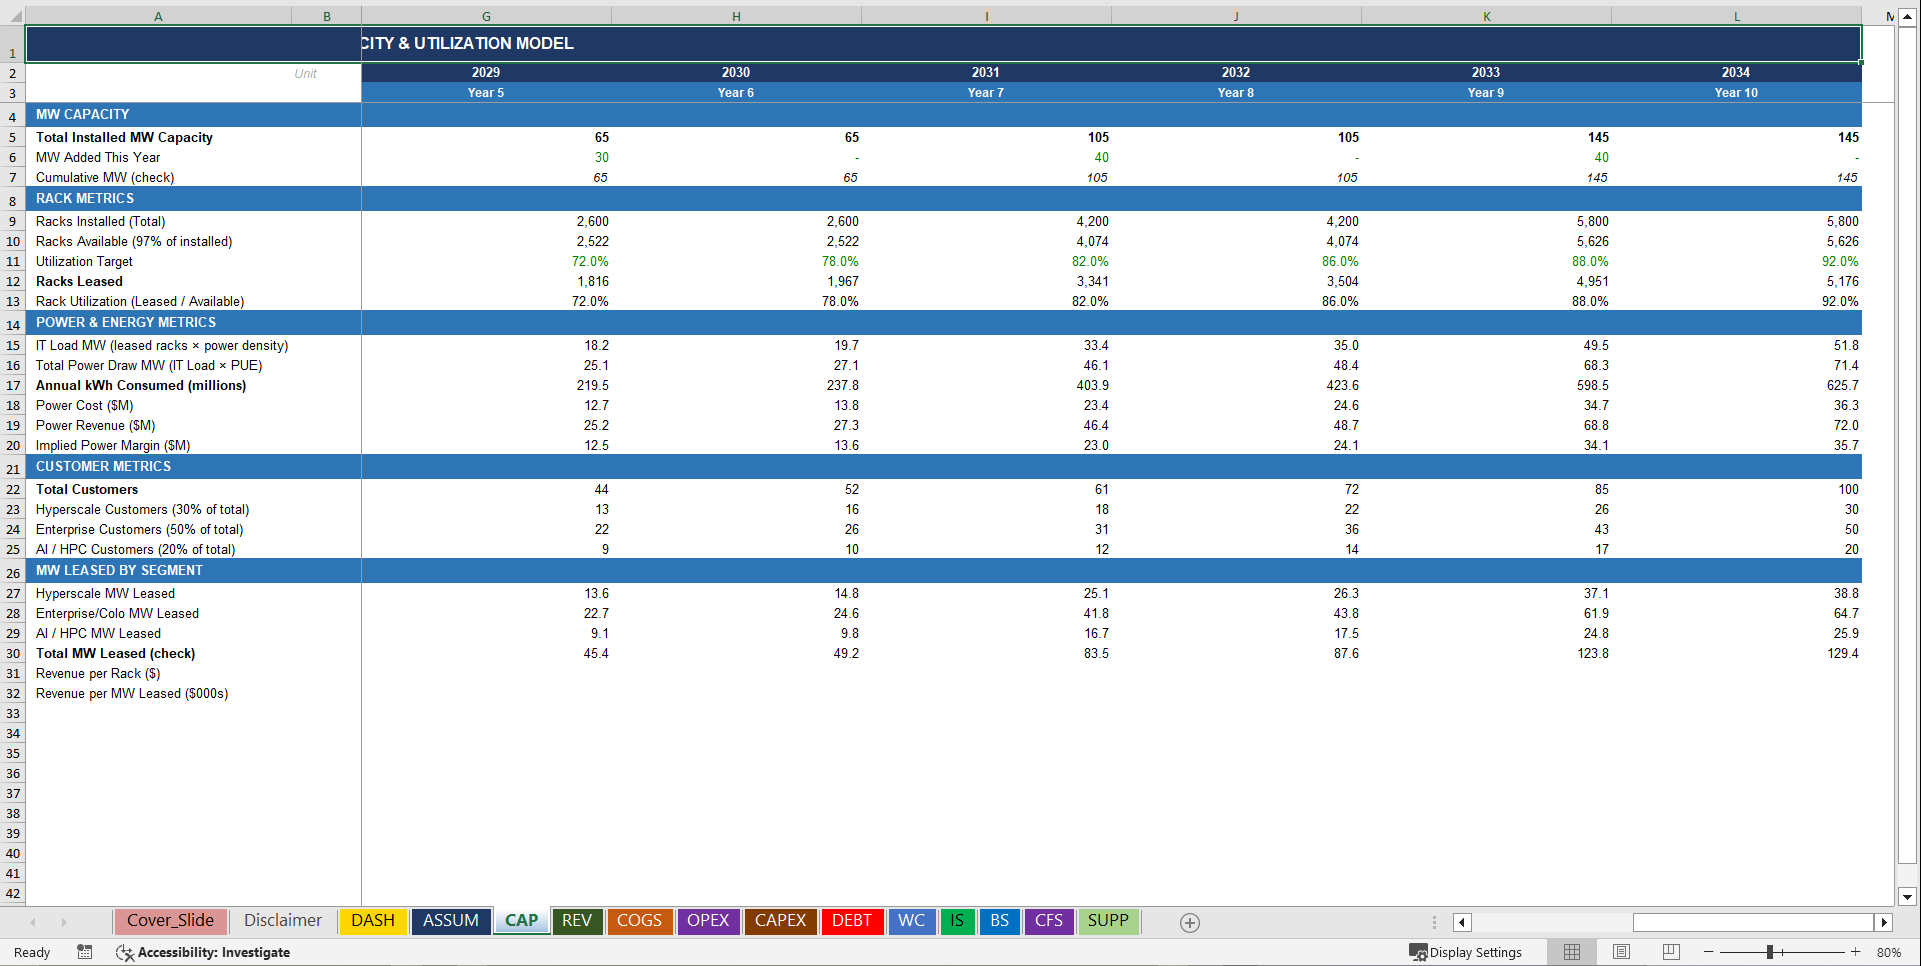
3️⃣ Capacity & Utilization Model
Structured for real data center scaling:
• Total installed MW by year with phase-by-phase expansion: 20 → 20 → 35 → 35 → 65 → 65 → 105 → 105 → 145 → 145 MW
• Racks installed (800 Year 1 → 5,800 Year 10), racks available at 97% of installed
• Racks leased driven by utilization targets: 326 Year 1 → 5,176 Year 10
• Rack utilization rate (leased ÷ available): 42% → 54% → 60% → 68% → 72% → 78% → 82% → 86% → 88% → 92%
• IT Load MW from racks leased × power density: 3.3 MW Year 1 → 51.8 MW Year 10
• Total power draw MW including PUE overhead: 4.5 MW Year 1 → 71.4 MW Year 10
• Annual kWh consumed: 39.4M kWh Year 1 → 625.7M kWh Year 10
• Power cost and power revenue tracked as separate $M line items – power margin of $2.25M Year 1 growing to $35.7M Year 10
• Customer count segmented: Hyperscale (30%), Enterprise (50%), AI/HPC (20%) of total customers each year
Know exactly how much capacity is generating revenue – and how much is sitting idle costing you money.
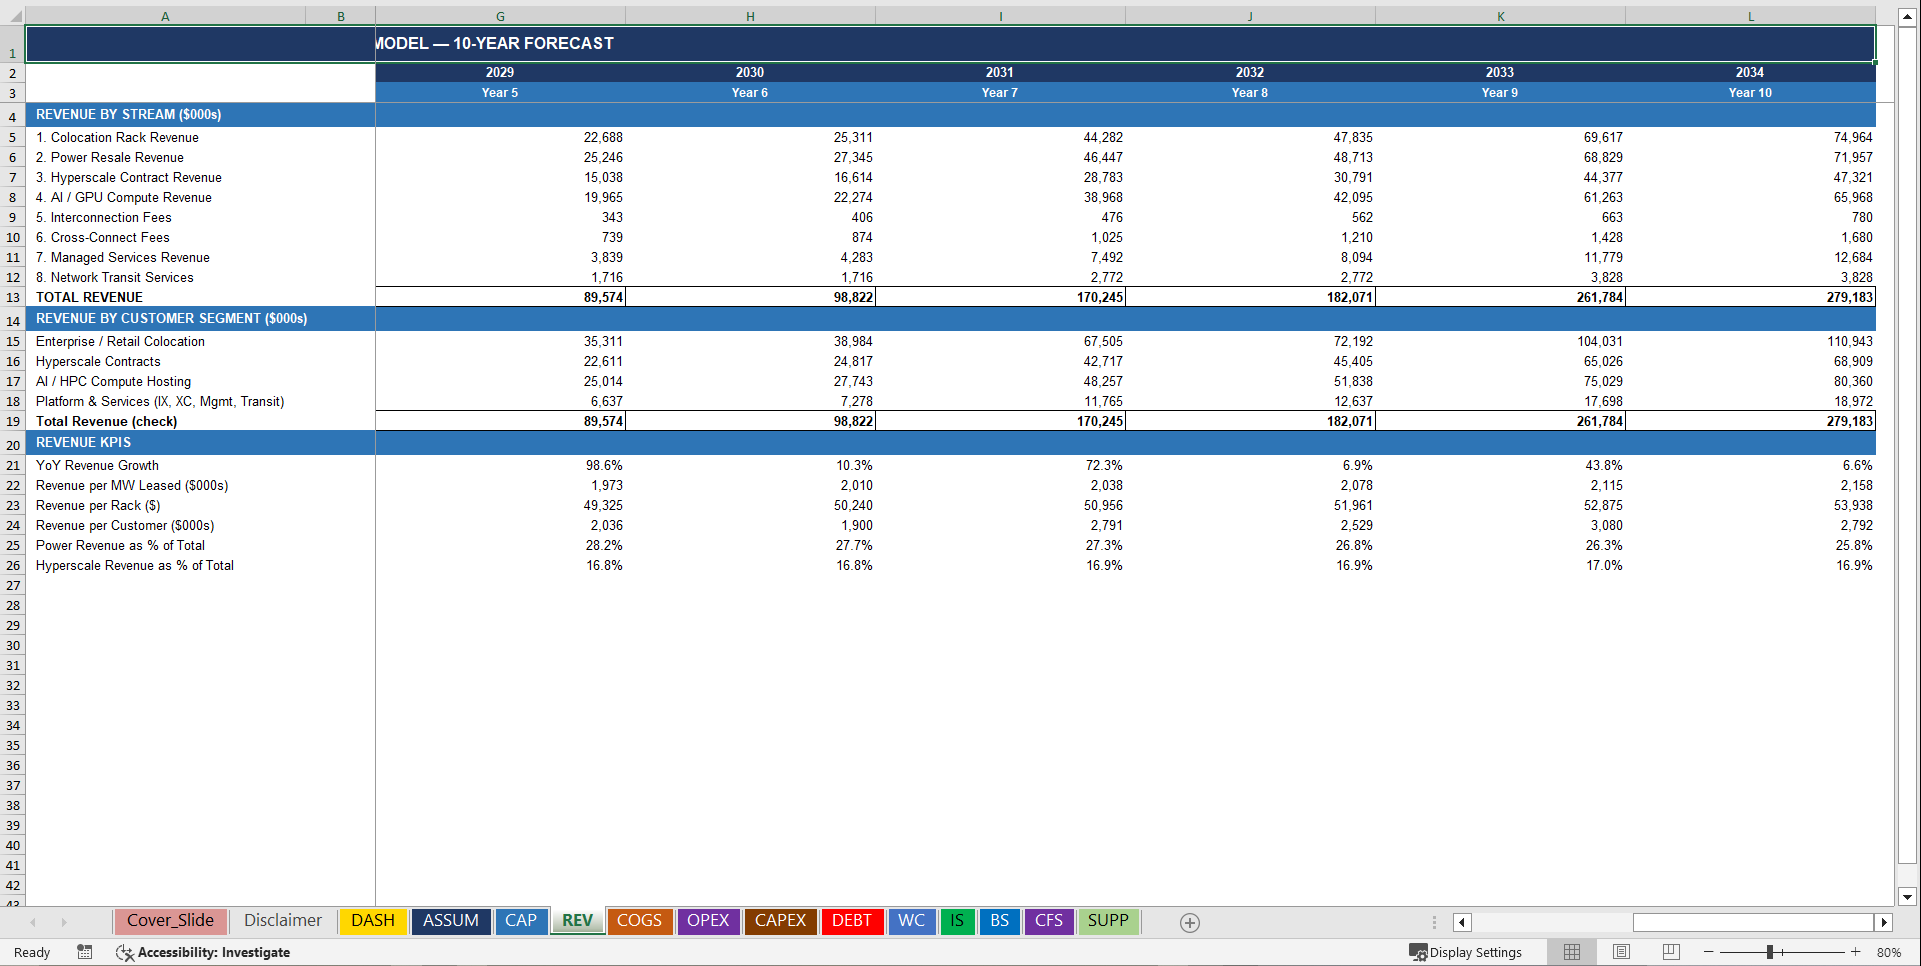
4️⃣ Revenue Engine (Built Like a Real Data Center Company)
8 distinct revenue streams, each 100% operationally driven:
• Colocation Rack Revenue – Enterprise racks leased × $1,850 MRR × 12 × 3% annual escalation | $3.6M Year 1 → $75.0M Year 10
• Power Resale Revenue – kWh consumed × $0.115/kWh resale price | $4.5M Year 1 → $72.0M Year 10
• Hyperscale Contract Revenue – MW leased × $85K/MW/month × 12 × 2% annual step-up | $2.5M Year 1 → $47.3M Year 10
• AI / GPU Compute Revenue – AI rack allocation × 2.2× density premium × colo rate × 12 | $3.2M Year 1 → $66.0M Year 10
• Interconnection Fees – Customer count × $650/month × 12 | $172K Year 1 → $780K Year 10
• Cross-Connect Fees – Customers × 4 ports × $350/port/month × 12 | $370K Year 1 → $1.7M Year 10
• Managed Services Revenue – 9% of colocation + AI compute revenue | $612K Year 1 → $12.7M Year 10
• Network Transit Services – Total MW × $2,200/MW/month × 12 | $528K Year 1 → $3.8M Year 10
Revenue segmented by customer type: hyperscaler / enterprise / AI-HPC / platform services.
Revenue mix shifts tracked over time as AI demand grows from 21% of Year 1 revenue to 24% by Year 10.
5️⃣ Cost of Goods Sold & Power Margin Tracking
Track real profitability at the MW, rack, and customer level:
• Electricity costs – total kWh × $0.058/kWh | $2.3M Year 1 → $36.3M Year 10 (largest COGS line item at scale)
• Cooling infrastructure – 15% of electricity cost | $343K Year 1 → $5.4M Year 10
• Network bandwidth costs – blended Gbps per MW with 3% annual inflation | $900K Year 1 → $8.5M Year 10
• Equipment maintenance – 2% of gross PP&E | $0 Year 1 (no PP&E yet) → $33.4M Year 10
• Data center operations staff – 40% of total personnel costs allocated to COGS | $62K Year 1 → $1.5M Year 10
• Security operations – 8% of total personnel costs allocated to COGS | $12K Year 1 → $291K Year 10
• Facility maintenance – $15K per MW per year with inflation | $300K Year 1 → $2.8M Year 10
• Insurance – 0.3% of gross asset value | $0 Year 1 → $5.0M Year 10
Total COGS: $3.9M Year 1 → $93.2M Year 10
See gross margin by cost component, power margin as a standalone line item, and COGS per MW by year.
Gross margin: 74.8% Year 1 | 76.5% Year 2 | 63.8%–68.7% through expansion years | 66.6% Year 10
Stop guessing your power economics. Know them cold.
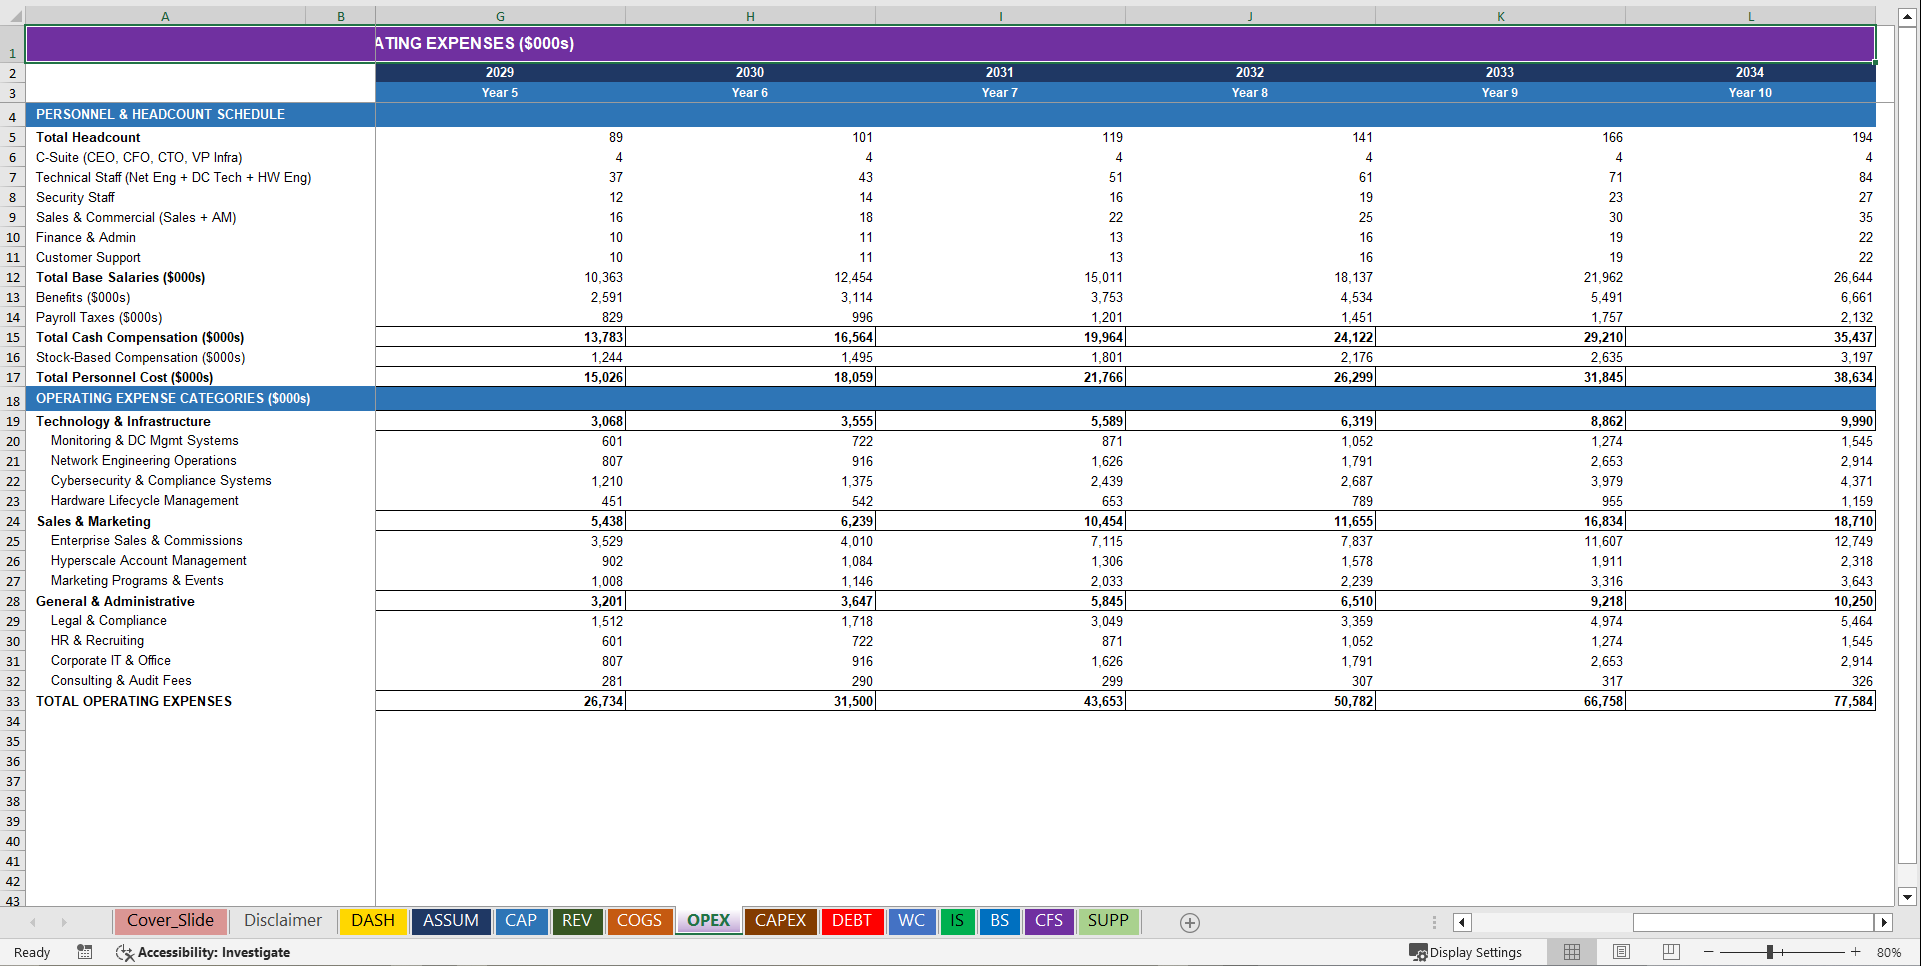
6️⃣ Personnel & Headcount Model
Engineering, operations, and site management headcount is your largest controllable non-power cost.
This model includes:
• Full salary build by role – CEO ($350K), CFO ($285K), CTO ($310K), VP Infrastructure ($255K), Network Engineers ($138K), DC Technicians ($74K), Hardware Engineers ($148K), Security Staff ($72K), Sales ($115K), Account Managers ($98K), Finance/Admin ($85K), Customer Support ($68K)
• Headcount scaling from 47 FTEs Year 1 → 194 FTEs Year 10 at 18% annual growth
• Annual salary increase of 4% applied across all roles
• Benefits load of 25% of base salary + payroll taxes at 8% + SBC at 12%
• Total personnel cost: $7.5M Year 1 → $38.6M Year 10
• SBC reserve: $618K Year 1 → $3.2M Year 10 tracked on balance sheet
• Revenue per employee: $330K Year 1 → $622K Year 3 → $1.44M Year 10 – demonstrating infrastructure operating leverage
Built for operational reality – not theoretical org chart planning.
7️⃣ Operating Expense Structure
Full overhead visibility – split exactly the way infrastructure investors want to see it:
Technology & Infrastructure OpEx ($833K Year 1 → $10.0M Year 10):
• DC monitoring and management systems – 4% of personnel cost
• Network engineering operations – 0.8% of revenue
• Cybersecurity and compliance systems – 1.2% of revenue
• Hardware lifecycle management – 3% of personnel cost
Sales & Marketing ($1.1M Year 1 → $18.7M Year 10):
• Enterprise sales team and commissions – 3.5% of revenue
• Hyperscale account management – 6% of personnel cost
• Marketing programs and industry events – 1% of revenue
General & Administrative ($905K Year 1 → $10.3M Year 10):
• Legal, compliance and regulatory – 1.5% of revenue
• HR and recruiting – 4% of personnel cost
• Corporate IT and office costs – 0.8% of revenue
• Consulting and audit fees – inflation-escalated base
Total OPEX: $10.4M Year 1 → $77.6M Year 10
Structured for real data center P&L presentation to institutional infrastructure investors.
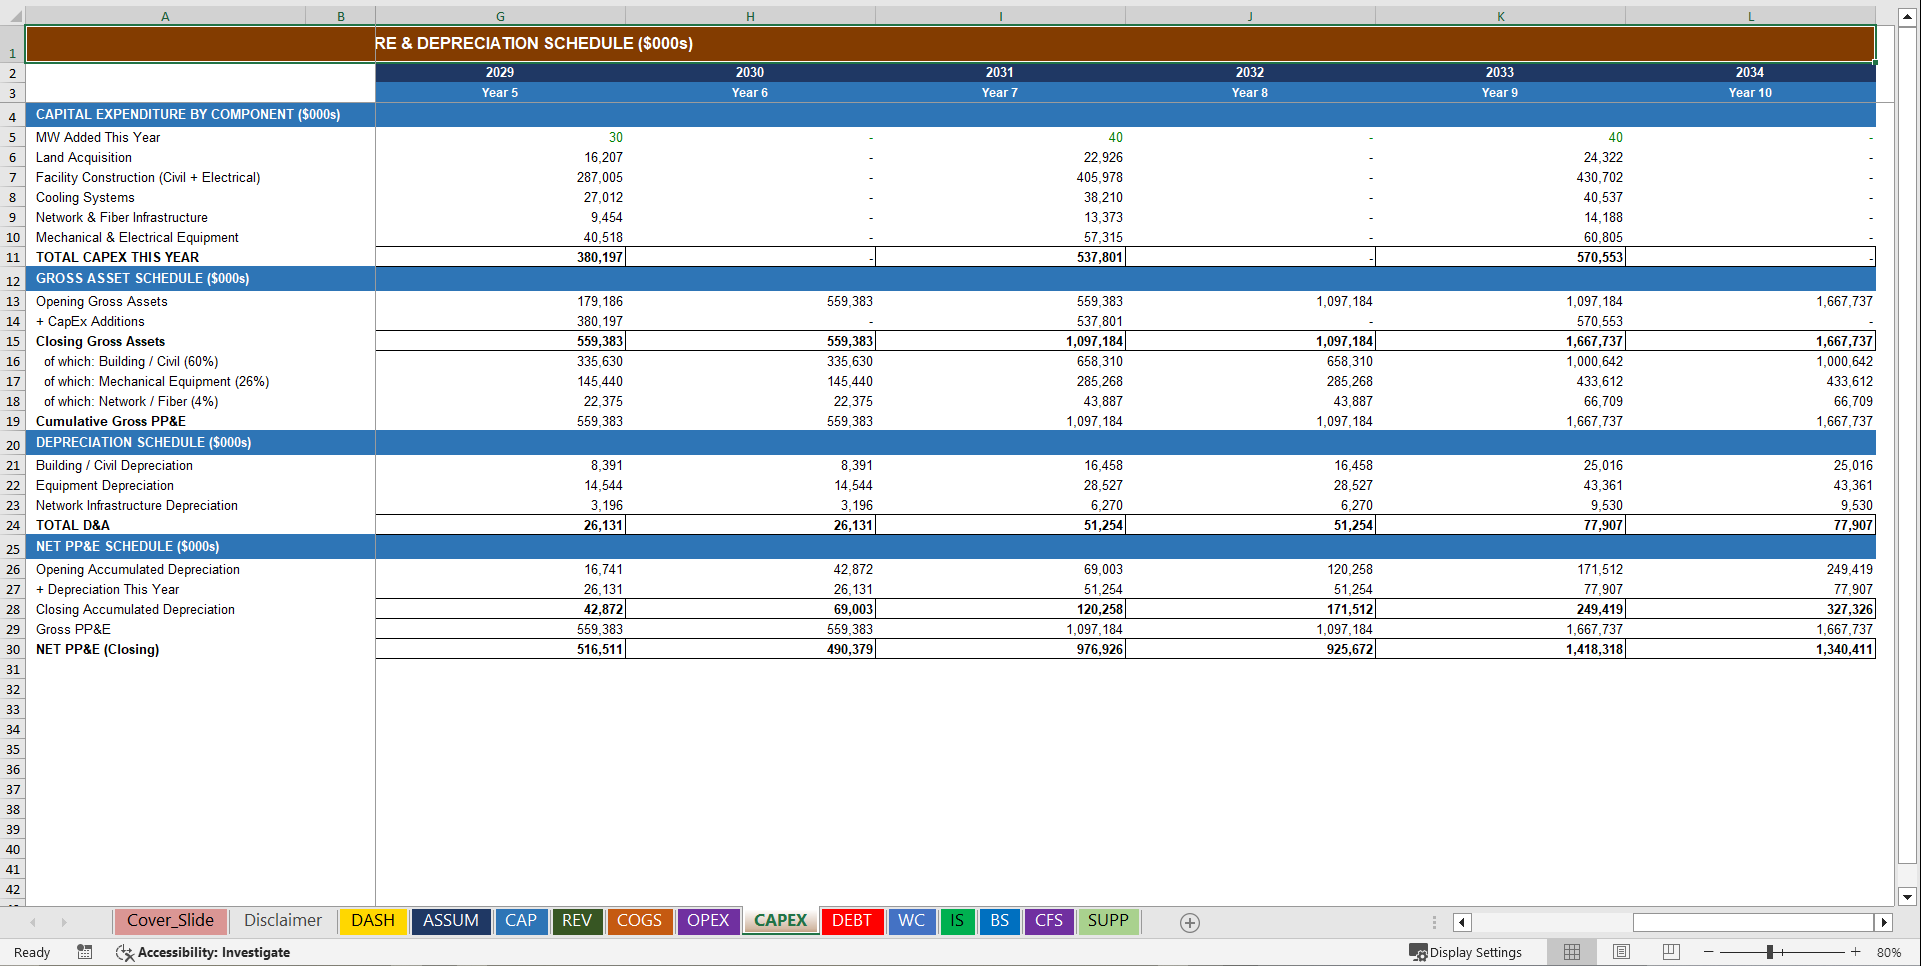
8️⃣ CapEx & Depreciation Schedule
Data centers are among the most capital-intensive businesses on earth. This model treats them that way.
CapEx per MW added – base case costs per expansion phase:
• Land acquisition – $480K per MW
• Facility construction (civil + electrical) – $8.5M per MW (industry range $7M–$12M, 3% annual inflation applied)
• Cooling systems – $800K per MW
• Network and fiber infrastructure – $280K per MW
• Mechanical and electrical equipment – $1.2M per MW
• Construction cost inflation compounded annually at 3%
• CapEx cost multiplier input for instant scenario stress-testing
CapEx deployment across 4 construction years:
• Year 3 (+15 MW): $179.2M – Land $7.6M | Civil $135M | Cooling $12.7M | Network $4.5M | Equipment $19.1M
• Year 5 (+30 MW): $380.2M – Land $16.2M | Civil $287M | Cooling $27.0M | Network $9.5M | Equipment $40.5M
• Year 7 (+40 MW): $537.8M – Land $22.9M | Civil $406M | Cooling $38.2M | Network $13.4M | Equipment $57.3M
• Year 9 (+40 MW): $570.6M – Land $24.3M | Civil $431M | Cooling $40.5M | Network $14.2M | Equipment $60.8M
PP&E Rollforward:
• Gross PP&E: $0 Year 1 → $179M Year 3 → $559M Year 5 → $1,097M Year 7 → $1,668M Year 10
• Split by: building/civil (60%), mechanical equipment (26%), network/fiber (4%)
• Net PP&E: $171M Year 3 → $517M Year 5 → $977M Year 7 → $1,340M Year 10
• D&A: $8.4M Year 3 → $26.1M Year 5 → $51.3M Year 7 → $77.9M Year 10
Know exactly how much capital you need before signing your next hyperscale anchor tenant or construction contract.
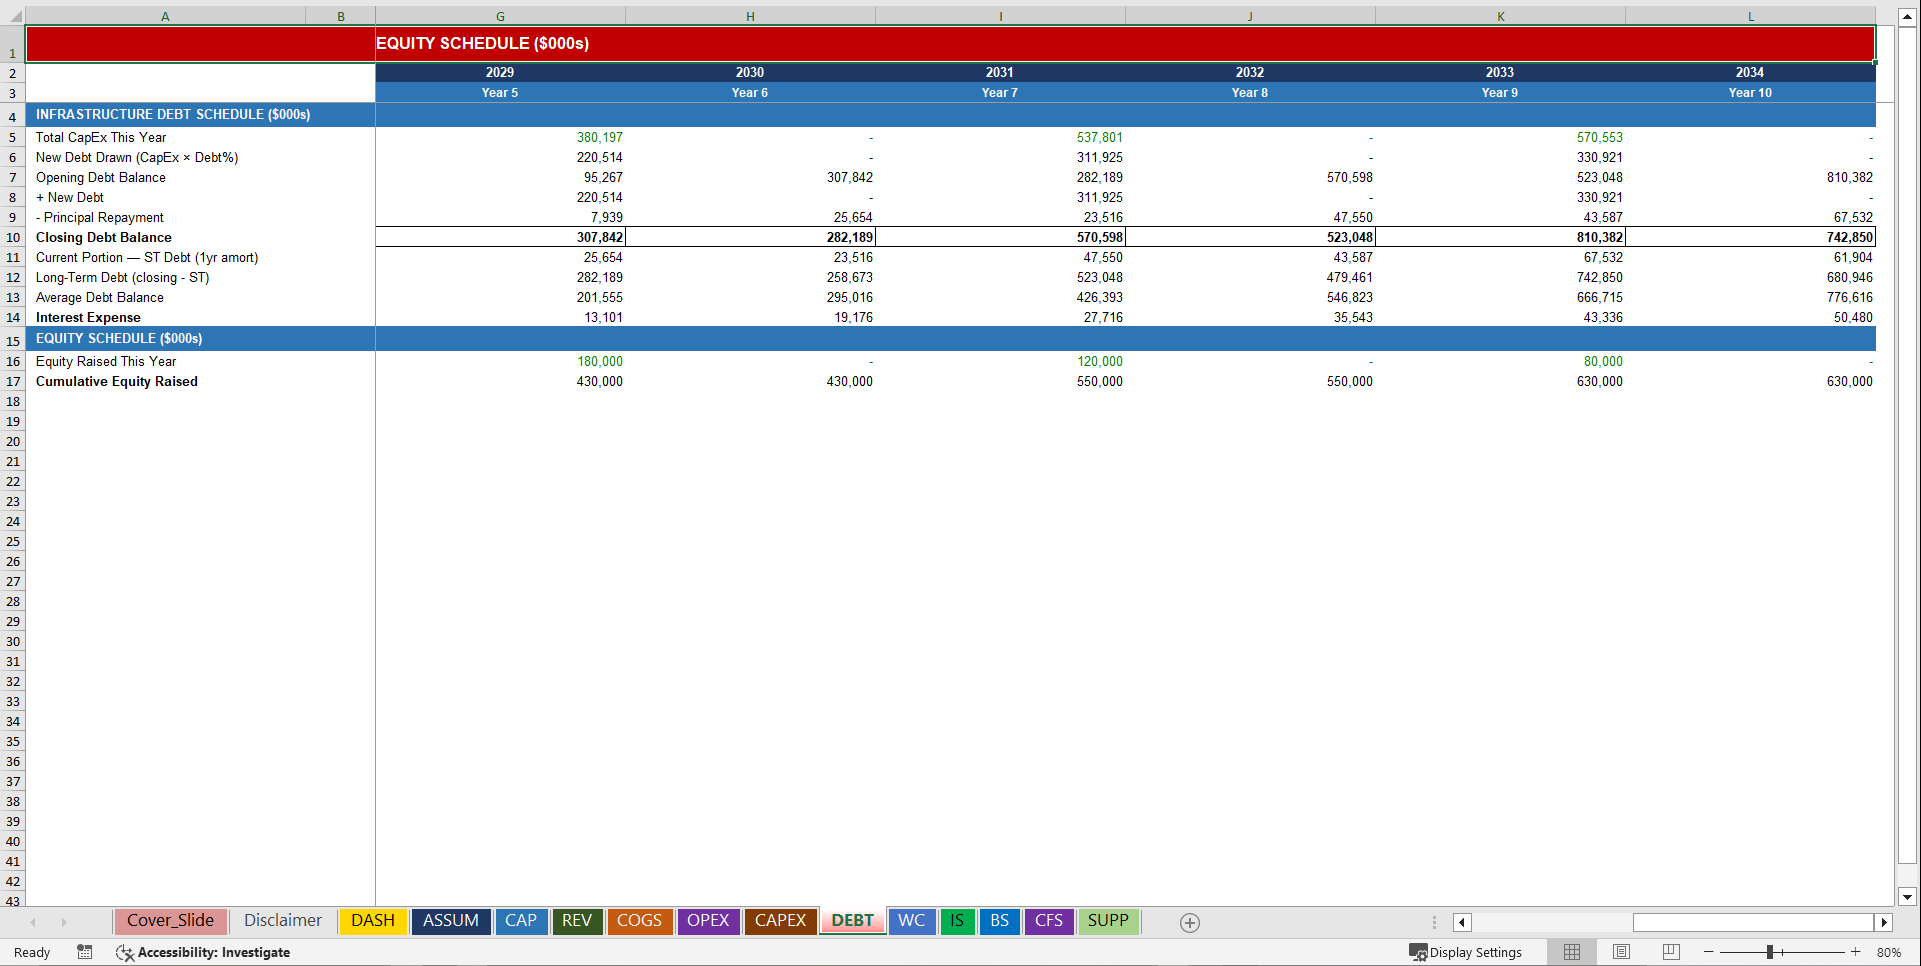
9️⃣ Debt & Equity Financing Schedule
Institutional-grade capital structure modeling:
5-Round Equity Schedule (Total: $630M):
• Year 1: $130M – Seed / Series A to fund initial 20 MW operations
• Year 3: $120M – Series A+ to fund first expansion phase
• Year 5: $180M – Series B to fund largest single expansion
• Year 7: $120M – Series C to fund fourth phase
• Year 9: $80M – Late-stage to fund fifth phase
Infrastructure Debt (58% of CapEx, 6.5% rate, 12-year tenor):
• Year 3 draw: $103.9M → Closing balance $104M
• Year 5 draw: $220.5M → Closing balance $308M
• Year 7 draw: $311.9M → Closing balance $571M
• Year 9 draw: $330.9M → Closing balance $810M
• Year 10 closing: $743M (amortization reducing balance)
• Interest expense: $3.4M Year 3 → $19.2M Year 6 → $50.5M Year 10
• Current vs. long-term debt split on balance sheet every year
Perfect for bank term sheets, green bond structuring, infrastructure fund co-investment, or private credit facilities.
🔟 Integrated 3-Statement Financials – Fully Linked, Fully Balanced
✔ Income Statement – Revenue → Gross Profit → EBITDA → EBIT → EBT → Net Income with max(0, pretax income) tax logic protecting early high-CapEx years
✔ Cash Flow Statement – Indirect method with OCF ($8.7M Year 1 → $96.9M Year 10), ICF (construction outflows of $179M / $380M / $538M / $571M in build years), and CFF (equity + debt draws minus repayments), ending cash ties directly to balance sheet
✔ Balance Sheet – Current assets (cash, AR, prepaid), net PP&E, current liabilities, long-term debt, paid-in capital, SBC reserve, retained earnings – confirmed $0 variance balance check on all 10 years, auditable formula visible in the sheet
Everything connects. Everything balances. Everything updates automatically.
1️⃣1️⃣ Scenario & Sensitivity Analysis
Instant visibility into your risk exposure.
3 Scenario Multiplier Inputs (change one cell, entire model shifts):
• Revenue Scenario Multiplier – 1.0× Base | 1.15× High AI Demand | 0.85× Recession
• CapEx Cost Multiplier – 1.0× Base | 1.10× Construction Inflation | 0.90× Efficient Build
• Churn Rate Multiplier – 1.0× Base | 1.50× Recession / Oversupply | 0.75× Strong Retention
💎 Why This Data Center Model Is Different
✔ Built specifically for colocation, hyperscale and AI compute operators – not generic SaaS or real estate templates
✔ MW-driven revenue logic tied to racks leased, power consumed, utilization rates and contract type mix
✔ Power resale margin modeled as a standalone revenue stream – $0.115/kWh revenue vs. $0.058/kWh cost – visible every year
✔ AI/GPU compute demand growth with verified 2.2× density premium over standard colo pricing – $3.2M Year 1 to $66M Year 10
✔ Interconnection ecosystem revenue modeled across three distinct streams: IX fees, cross-connect ports, and network transit
✔ PUE ratio of 1.38 feeding total power draw, electricity cost, and cooling cost simultaneously throughout the model
✔ Fully integrated equity rounds ($630M total) and project finance debt ($810M peak) with 12-year straight-line amortization
✔ 10-year forecast with startup-to-scale operating leverage: revenue per employee $330K → $1.44M
✔ Balance sheet balances confirmed with an auditable $0-check formula visible on every single year
✔ Working capital modeled with AR, deferred revenue, AP, and accrued expenses – all dynamically linked to revenue and cost drivers
This is how serious data center operators plan for scale.
🧠 Built for Real Profitability Decisions
This model allows you to:
• Raise Series A through Series C capital with institutional-grade digital infrastructure projections
• Secure green bonds, project finance facilities, and equipment loans with financial proof packages banks actually accept
• Negotiate better hyperscale anchor tenant terms with data-backed MW pricing and power margin analysis
• Optimize contract type mix – colocation vs. hyperscale wholesale vs. AI compute – for maximum blended gross margin
• Control power cost exposure and PUE overhead at every capacity phase simultaneously
• Manage customer churn, billing conversion lag, and deferred revenue float
• Forecast cash runway and time-to-profitability with capacity-phase precision across all 5 expansion events
• Evaluate new geography or campus expansion ROI before committing construction CapEx
• Stress-test hyperscale customer concentration before your next anchor lease renewal
• Prove to lenders that your $810M peak debt load is serviceable against $147M of Year 10 EBITDA
Instead of hoping your data center makes money – you know exactly when and how it will.
🚨 The Cost of Not Having This
Without a proper data center financial model, you risk:
• Running out of cash between equity rounds during peak construction spend – $179M, $380M, $538M, and $571M in four separate build years
• Underpricing your colocation rack rates at $1,850 MRR and collapsing your power resale margin
• Overstaffing operations before utilization crosses 60% and rack-level contribution justifies the overhead
• Underestimating how much equipment maintenance alone costs at scale – $33.4M per year once Gross PP&E hits $1.668B
• Getting rejected by infrastructure banks, green bond underwriters, and equipment lenders
• Signing the wrong power purchase agreement with no model to stress-test a $0.02/kWh electricity cost spike
• Expanding into new campuses too fast without phase-level profitability confirmation
• Losing institutional infrastructure investors because your model had no MW-level operational logic
• Burning through your $130M Series A in the first 18 months of construction mobilization
One properly scaled colocation platform with an AI compute wing can generate category-defining, barrier-to-entry, infrastructure-moat returns.
But only if you plan the MW unit economics correctly from Day 1.
⚡ Stop Guessing. Start Modeling Like an Institutional Data Center Operator.
If you are serious about:
• Launching a profitable colocation facility or hyperscale campus
• Scaling a multi-site digital infrastructure platform from 20 MW to 145 MW
• Raising venture capital or project finance debt in the data center vertical
• Securing SBA loans, infrastructure bonds, or equipment financing approvals
• Maximizing rack-level contribution margins and revenue per MW
• Surviving power cost compression and PUE inefficiency at scale
• Building a delivery-first AI compute hosting brand at institutional scale
• Preparing for a Series B, infrastructure fund exit, or data center REIT IPO
This model is your unfair advantage.
Download the Data Center Financial Model today – and launch, fund, and scale your digital infrastructure empire with the numbers to back it up.
Key Words:
Strategy & Transformation, Growth Strategy, Strategic Planning, Strategy Frameworks, Innovation Management, Pricing Strategy, Core Competencies, Strategy Development, Business Transformation, Marketing Plan Development, Product Strategy, Breakout Strategy, Competitive Advantage, Mission, Vision, Values, Strategy Deployment & Execution, Innovation, Vision Statement, Core Competencies Analysis, Corporate Strategy, Product Launch Strategy, BMI, Blue Ocean Strategy, Breakthrough Strategy, Business Model Innovation, Business Strategy Example, Corporate Transformation, Critical Success Factors, Customer Segmentation, Customer Value Proposition, Distinctive Capabilities, Enterprise Performance Management, KPI, Key Performance Indicators, Market Analysis, Market Entry Example, Market Entry Plan, Market Intelligence, Market Research, Market Segmentation, Market Sizing, Marketing, Michael Porter's Value Chain, Organizational Transformation, Performance Management, Performance Measurement, Platform Strategy, Product Go-to-Market Strategy, Reorganization, Restructuring, SWOT, SWOT Analysis, Service 4.0, Service Strategy, Service Transformation, Strategic Analysis, Strategic Plan Example, Strategy Deployment, Strategy Execution, Strategy Frameworks Compilation, Strategy Methodologies, Strategy Report Example, Value Chain, Value Chain Analysis, Value Innovation, Value Proposition, Vision Statement, Corporate Strategy, Business Development, Business plan pdf, business plan, PDF, Business Plan DOC, Business Plan Template, PPT, Market strategy playbook, strategic market planning, competitive analysis tools, market segmentation frameworks, growth strategy templates, product positioning strategy, market execution toolkit, strategic alignment playbook, KPI and OKR frameworks, business growth strategy guide, cross-functional strategy templates, market risk management, market strategy PowerPoint doc, guide, ebook, e-book ,McKinsey Change Playbook, Organizational change management toolkit, Change management frameworks 2025, Influence model for change, Change leadership strategies, Behavioral change in organizations, Change management PowerPoint templates, Transformational leadership in change, supply chain KPIs, supply chain KPI toolkit, supply chain PowerPoint template, logistics KPIs, procurement KPIs, inventory management KPIs, supply chain performance metrics, manufacturing KPIs, supply chain dashboard, supply chain strategy KPIs, reverse logistics KPIs, sustainability KPIs in supply chain, financial supply chain KPIs, warehouse KPIs, digital supply chain KPIs, 1200 KPIs, supply chain scorecard, KPI examples, supply chain templates, Corporate Finance SOPs, Finance SOP Excel Template, CFO Toolkit, Finance Department Procedures, Financial Planning SOPs, Treasury SOPs, Accounts Payable SOPs, Accounts Receivable SOPs, General Ledger SOPs, Accounting Policies Template, Internal Controls SOPs, Finance Process Standardization, Finance Operating Procedures, Finance Department Excel Template, FP&A Process Documentation, Corporate Finance Template, Finance SOP Toolkit, CFO Process Templates, Accounting SOP Package, Tax Compliance SOPs, Financial Risk Management Procedures.
NOTE: Our digital products are sold on an "as is" basis, making returns and refunds unavailable post-download. Please preview and inquire before purchasing. Please contact us before purchasing if you have any questions! This policy aligns with the standard Flevy Terms of Usage.
Got a question about the product? Email us at support@flevy.com or ask the author directly by using the "Ask the Author a Question" form. If you cannot view the preview above this document description, go here to view the large preview instead.
Source: Best Practices in Data Center, Integrated Financial Model Excel: Data Center Operator 10-Year 3 Statement Financial Model Excel (XLSX) Spreadsheet, SB Consulting
ABOUT THE AUTHOR
SB Consulting is dedicated to empowering businesses to communicate their ideas with impact. This consulting firm specializes in teaching organizations how to create effective corporate and management presentations. With training from top-tier global consulting firms, including McKinsey, BCG, and Porsche Consulting, extensive expertise in presentation design and ... [read more]
Ask the Author a Question
You must be logged in to contact the author.
