

Customer Churn Analysis Model – Excel XLSX
Excel (XLSX) + Excel (XLSX)
BENEFITS OF THIS DOWNLOADABLE EXCEL DOCUMENT
- Upload your customer sales export and get churn, retention curves, cohort heatmaps and revenue concentration in minutes.
- Quantifies concentration and stability (top customers, HHI, stability classes) to assess portfolio risk.
- Tracks new, retained and lost customers to explain revenue changes over time.
CUSTOMER CHURN EXCEL DESCRIPTION
Purpose of the tool
Upload your customer sales export and get churn, retention curves, cohort heatmaps and revenue concentration in minutes.
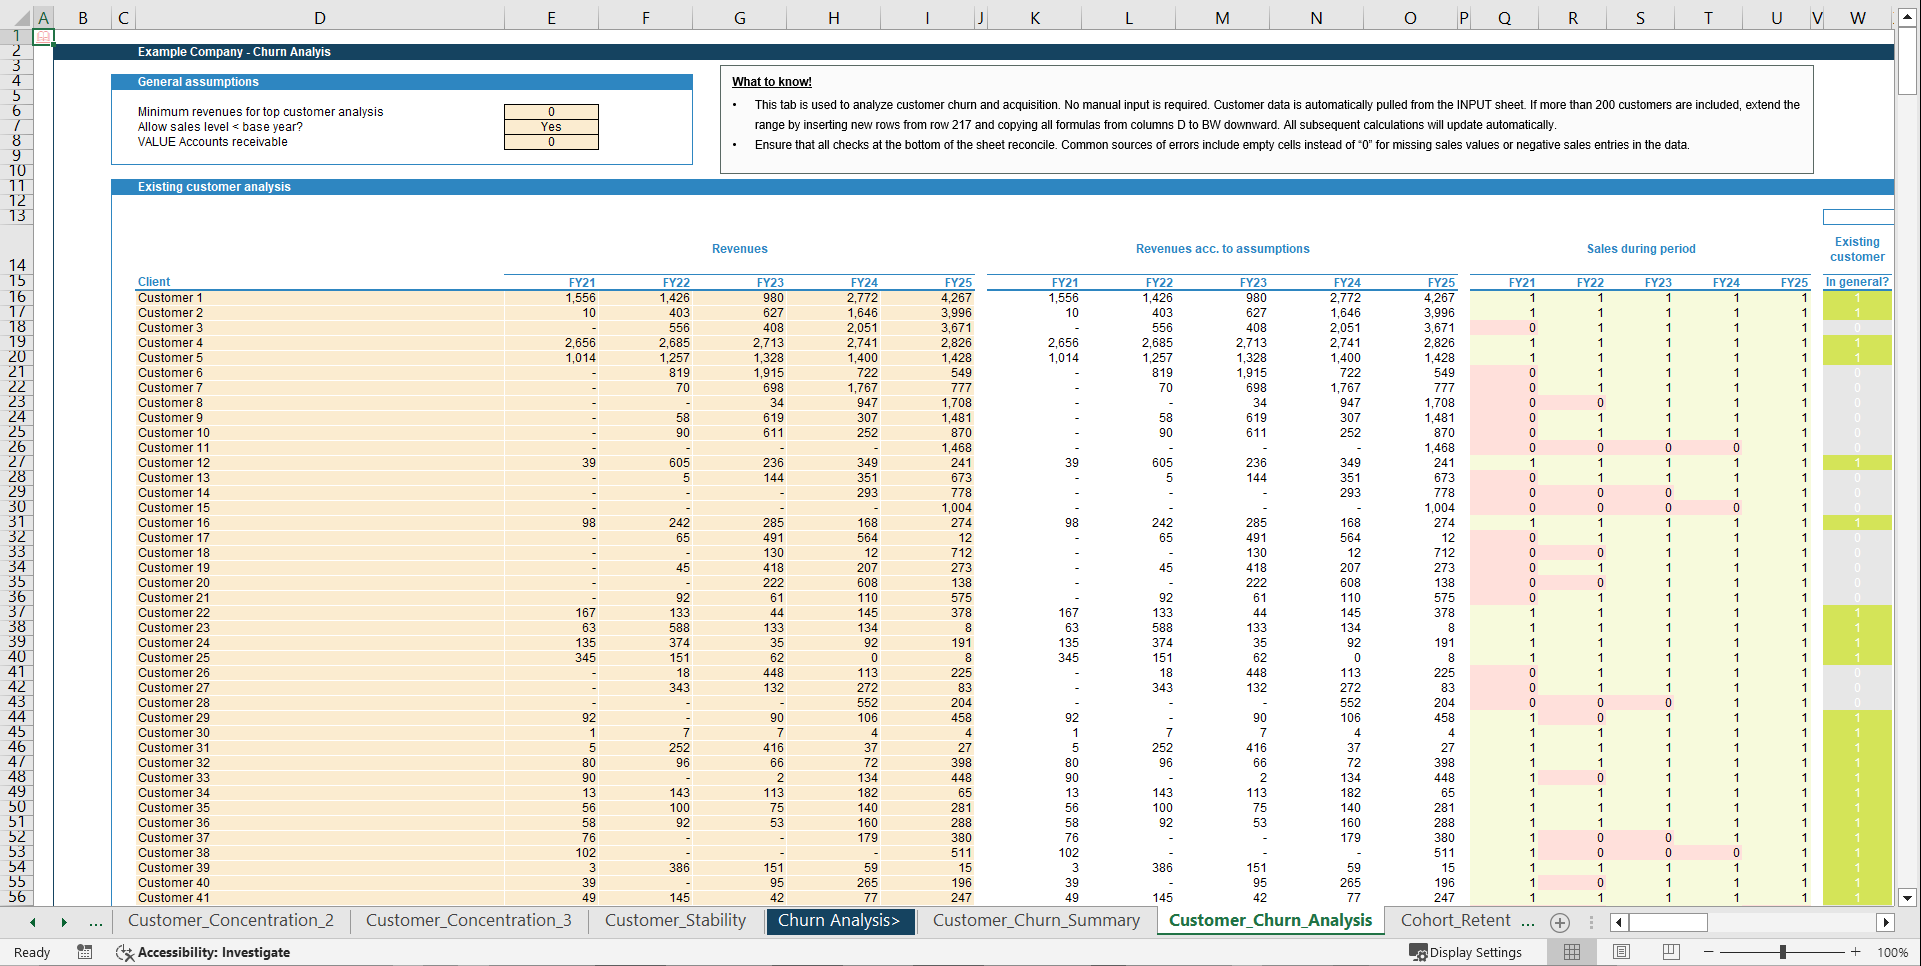
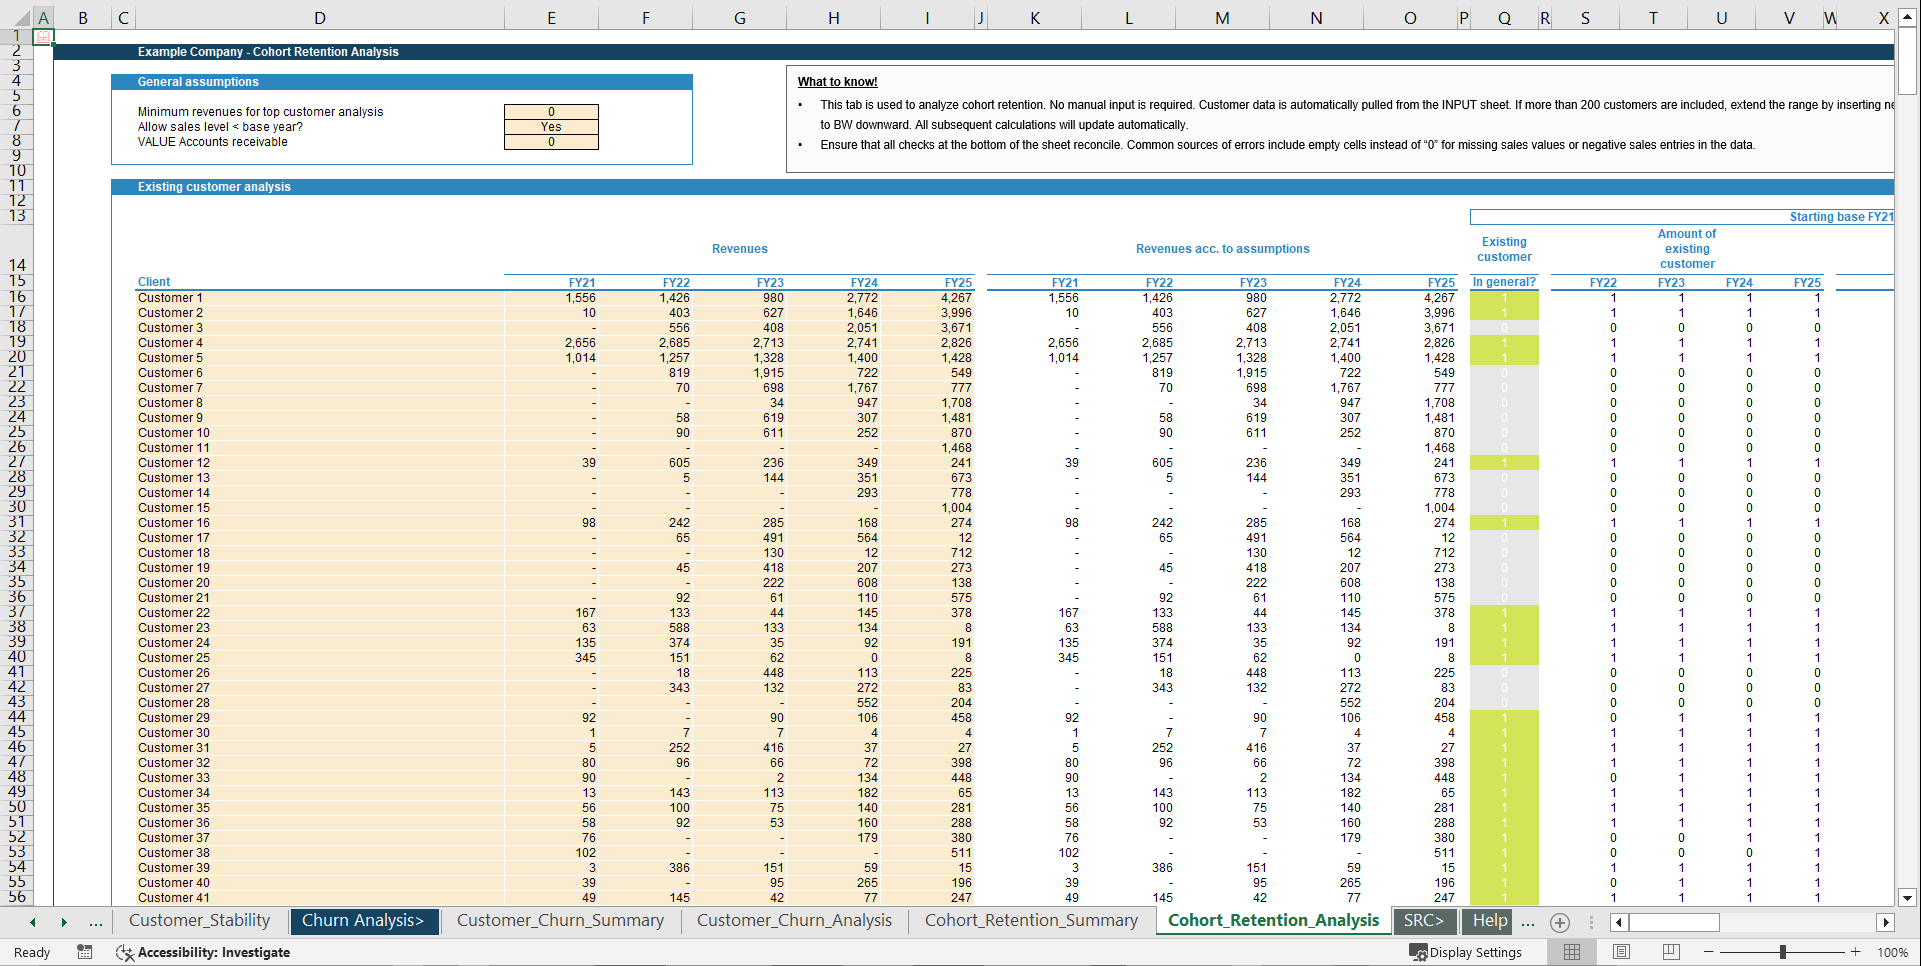
This Excel-based Customer (Churn) Analysis Model provides a deep and structured view of how your customer base, revenues and portfolio quality evolve over time. It tracks which customers are new, retained or lost in each period and quantifies how these movements drive overall sales development. Beyond simple churn rates, the model analyses customer concentration, portfolio stability and cohort retention to assess how resilient and diversified your revenue base really is. By segmenting customers into stability classes (for example stable, medium and volatile) and tracking cohorts over multiple years, it highlights concentration risks, revenue dependency on key accounts and the remaining "useful life" of your customer base.
Key Outputs
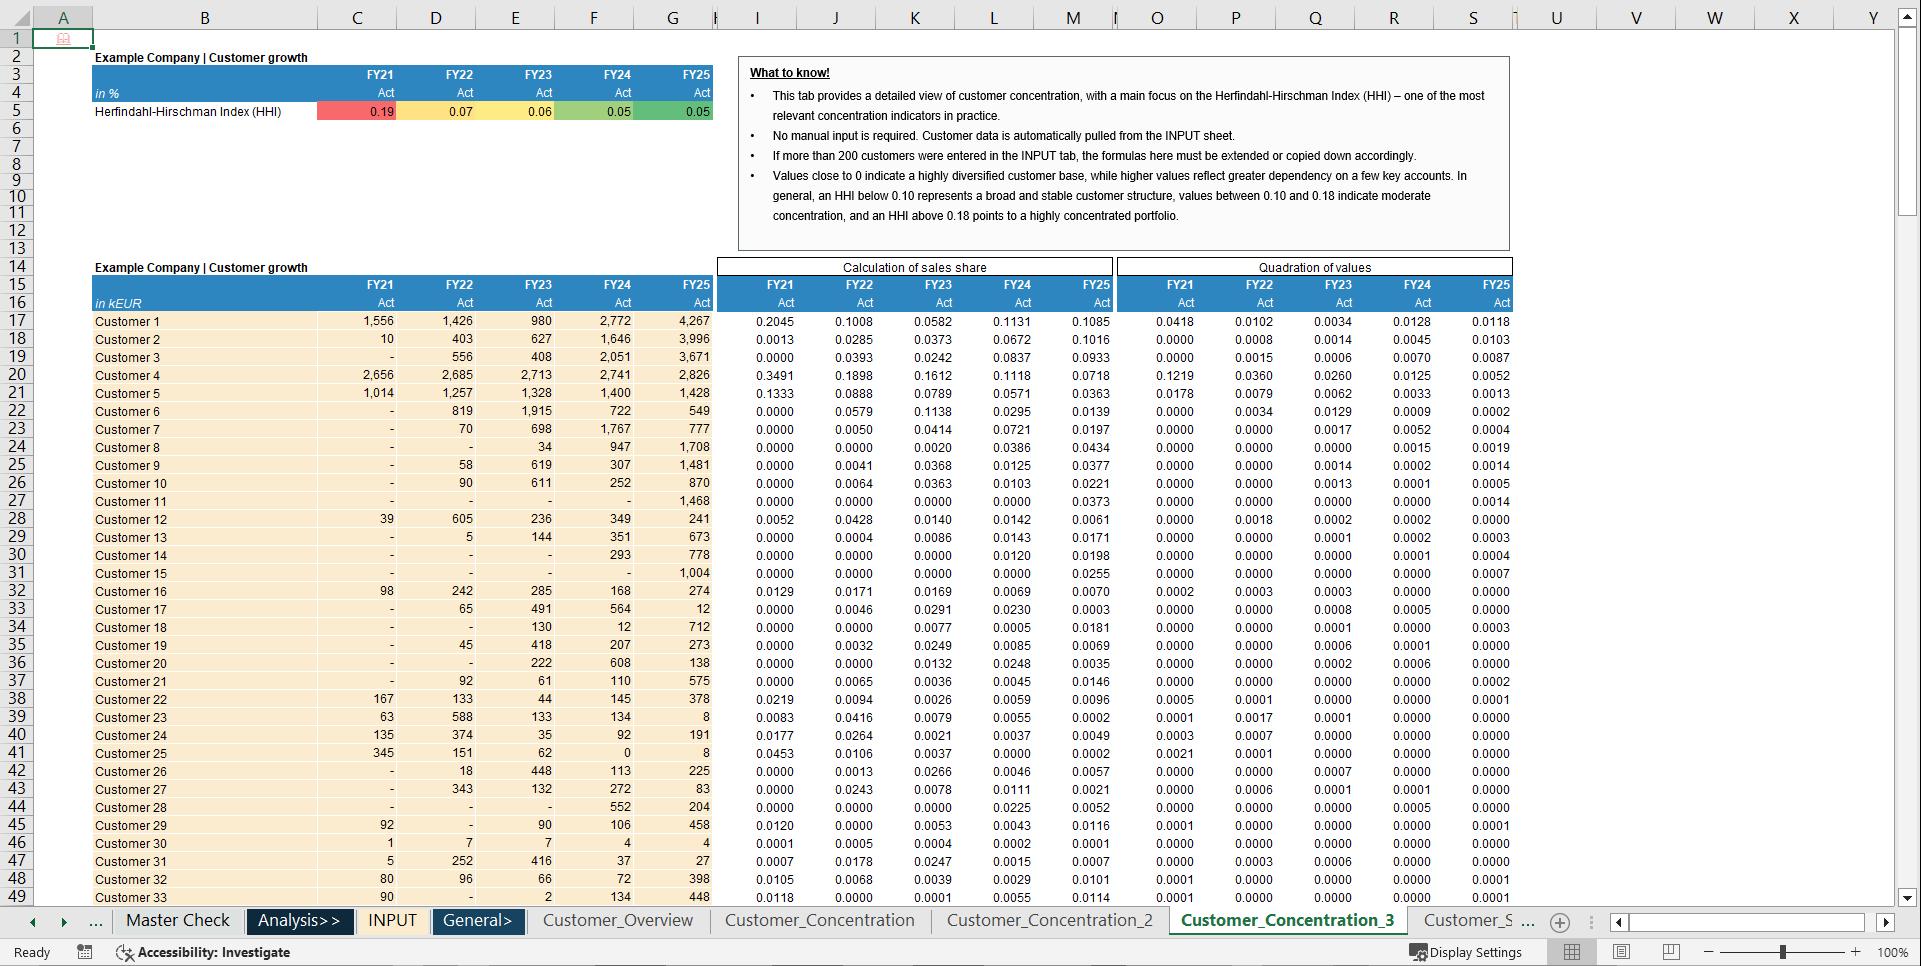
The model delivers a customer base overview showing the number of customers, total sales and average sales per customer by year. It includes a detailed customer concentration analysis covering top 1 and top 3/5 customers, long-tail views, the HHI index and share tables. Customer stability is broken down into stable, medium and volatile groups by both sales and customer count. In addition, churn and acquisition are analysed through waterfall views for changes in customer numbers and sales (existing vs. new vs. lost customers), supported by a per-customer churn classification (new, existing, departing) by year. Cohort retention is covered through retention curves and heatmaps by cohort based on customer counts, as well as sales development by cohort including churn percentages and remaining useful life (RUL) indicators.
Key Inputs & Assumptions
The model is based on annual customer-level sales data, typically structured as one row per customer and one column per year. It requires unique customer identifiers and a consistent year structure. Key parameters such as stability classes and minimum revenue thresholds are defined in the assumptions tab.
How to use
Start by setting the core parameters such as years, currency and stability thresholds in the Assumptions sheet. Then load customer-level sales into the Input sheet and ensure IDs are consistent and there are no blank cells. Finally, review the overview, concentration, stability, churn and cohort tabs to analyse customer base development, churn and revenue sustainability.
Customization & support
The model is highly customisable and allows you to adapt thresholds, classifications, tables and charts to your data structure, industry or reporting standards. For more complex customisations or individual requirements—such as firm-specific versions, additional modules or integration into existing workbooks—feel free to reach out and we can discuss a tailored solution. Each download includes both a fully blank "Clean Template" for working directly with your own data and a pre-populated Example Template that illustrates the model's logic and calculations using realistic sample data.
Got a question about the product? Email us at support@flevy.com or ask the author directly by using the "Ask the Author a Question" form. If you cannot view the preview above this document description, go here to view the large preview instead.
Source: Best Practices in Customer Churn Excel: Customer Churn Analysis Model Excel (XLSX) Spreadsheet, Finance Model Hub
ABOUT THE AUTHOR
I am an independent financial analyst specializing in valuation, transaction services, M&A analysis, and the development of practical Excel-based models for advisors and investors.
My templates are built on corporate finance, valuation, and financial modeling best practices and are structured to be intuitive, transparent, and easy to customize. The goal is to translate complex topics into clear,
... [read more]
Ask the Author a Question
You must be logged in to contact the author.
