
 Click main image to view in full screen. Unlock all 23 preview images:
Country Visualization Toolkit: Editable Maps for Every Country, State, Province – PowerPoint PPTX Template
PowerPoint (PPTX) 384 Slides


BENEFITS OF THIS DOWNLOADABLE POWERPOINT DOCUMENT
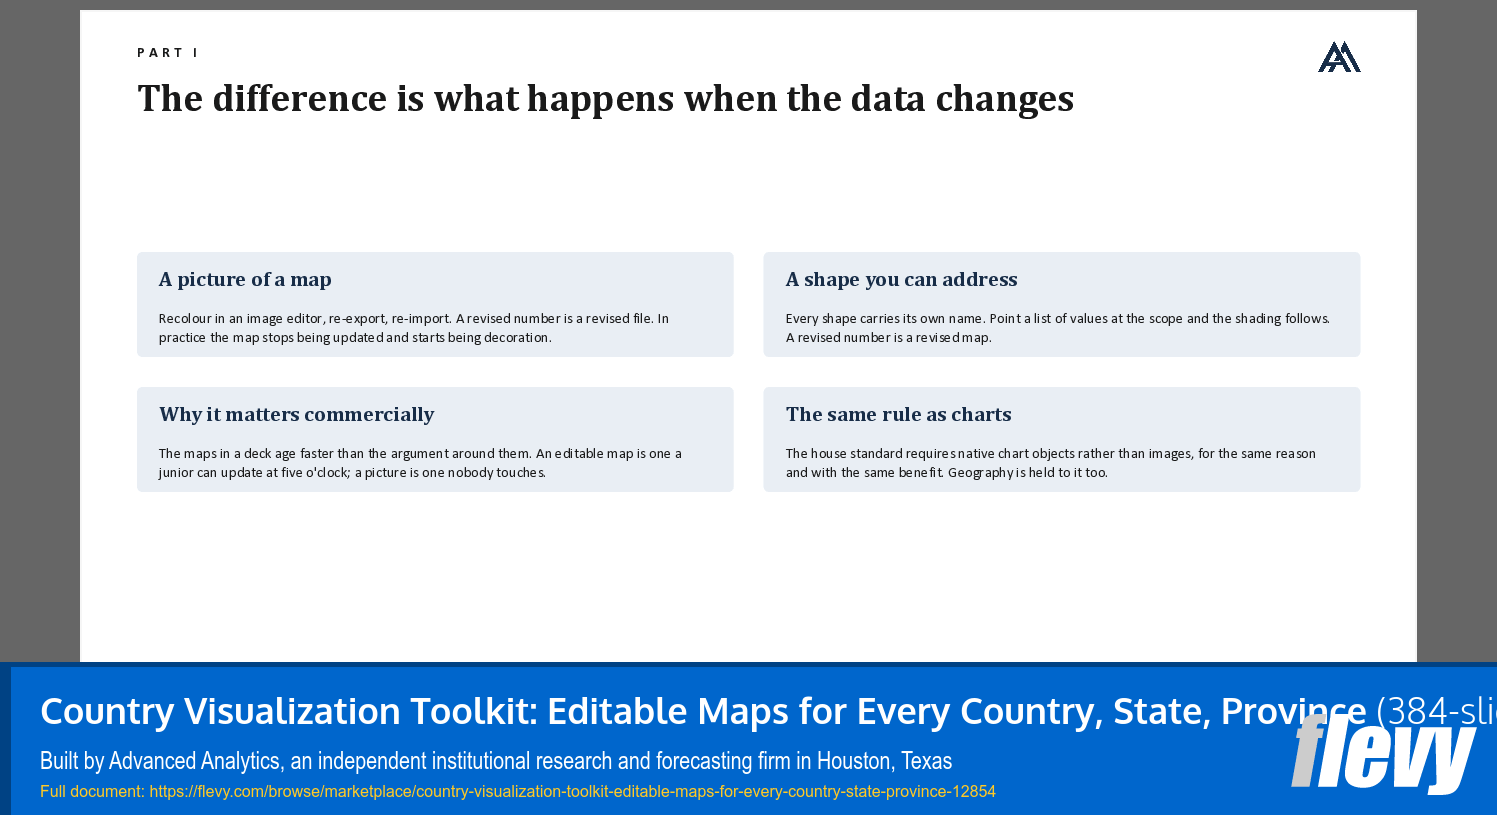
- Shade a map from data instead of colouring it by hand. Every shape carries its own name, so a country, state or county map becomes a data exhibit driven by the numbers you already have, and a revised number is a revised map rather than an afternoon.
- Use it in client work without a licence problem following you. The geometry is public domain at source, which is a materially different position from the map bundles that permit use but not redistribution, and different again from tracing something you fo
- Go from the world to a single county without changing tools. The same library answers a global market map, a European regional view and a Texas county site study, drawn in one consistent visual language so a deck that moves between scales does not look as
POWERPOINT MAP DIAGRAMS PPT TEMPLATE DESCRIPTION
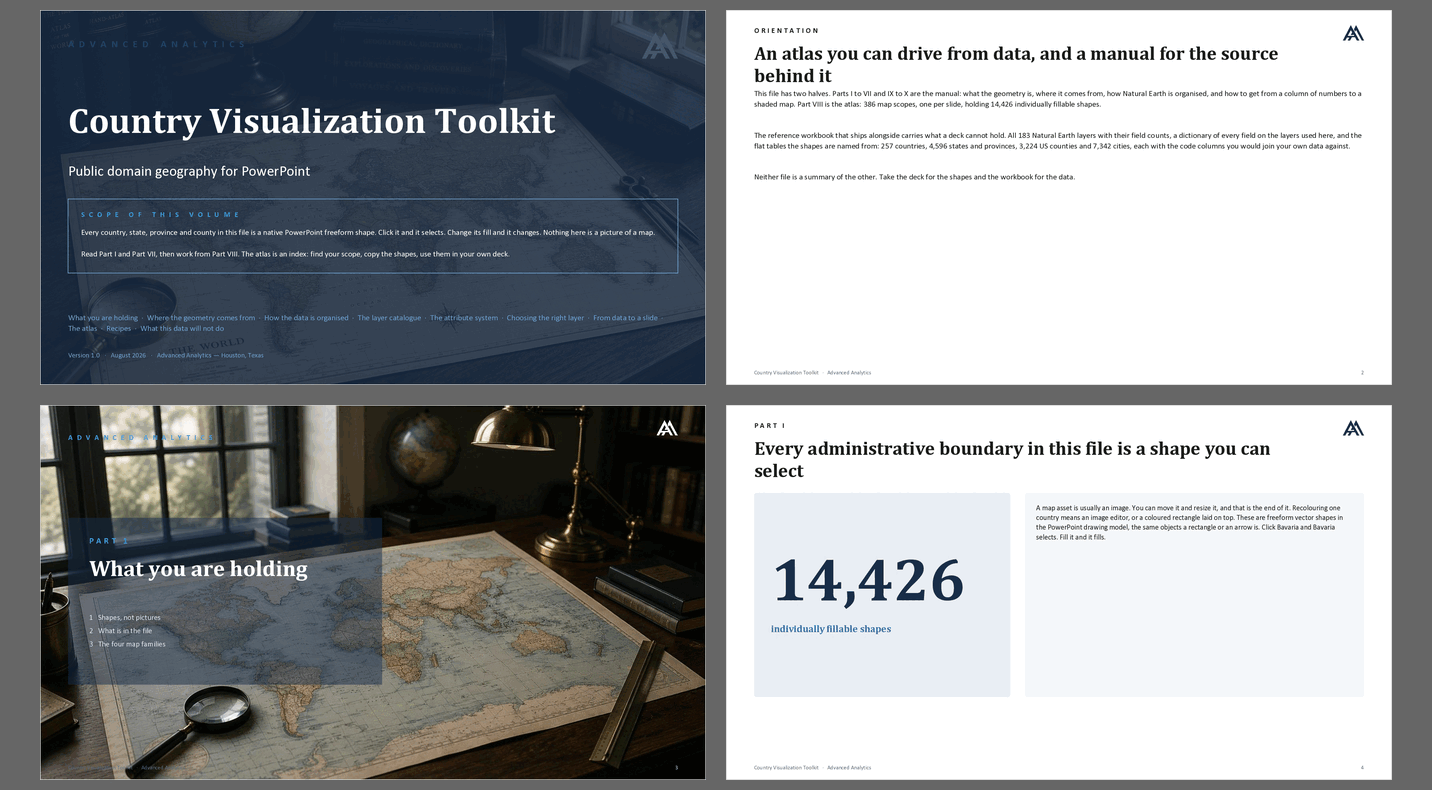
Most map assets sold for PowerPoint are pictures. You can move them and you can resize them, and that is the end of it. Change one country's colored and you are in an image editor, or you are drawing a colored rectangle on top and hoping nobody looks closely.
This is not that. Every country, every state, every province and every county in this library is a native PowerPoint freeform shape. Click it and it selects. Change its fill and it changes. Put a number against it and it shades. The whole atlas behaves the way a chart behaves, because it is built from vector geometry rather than exported as a picture of some.
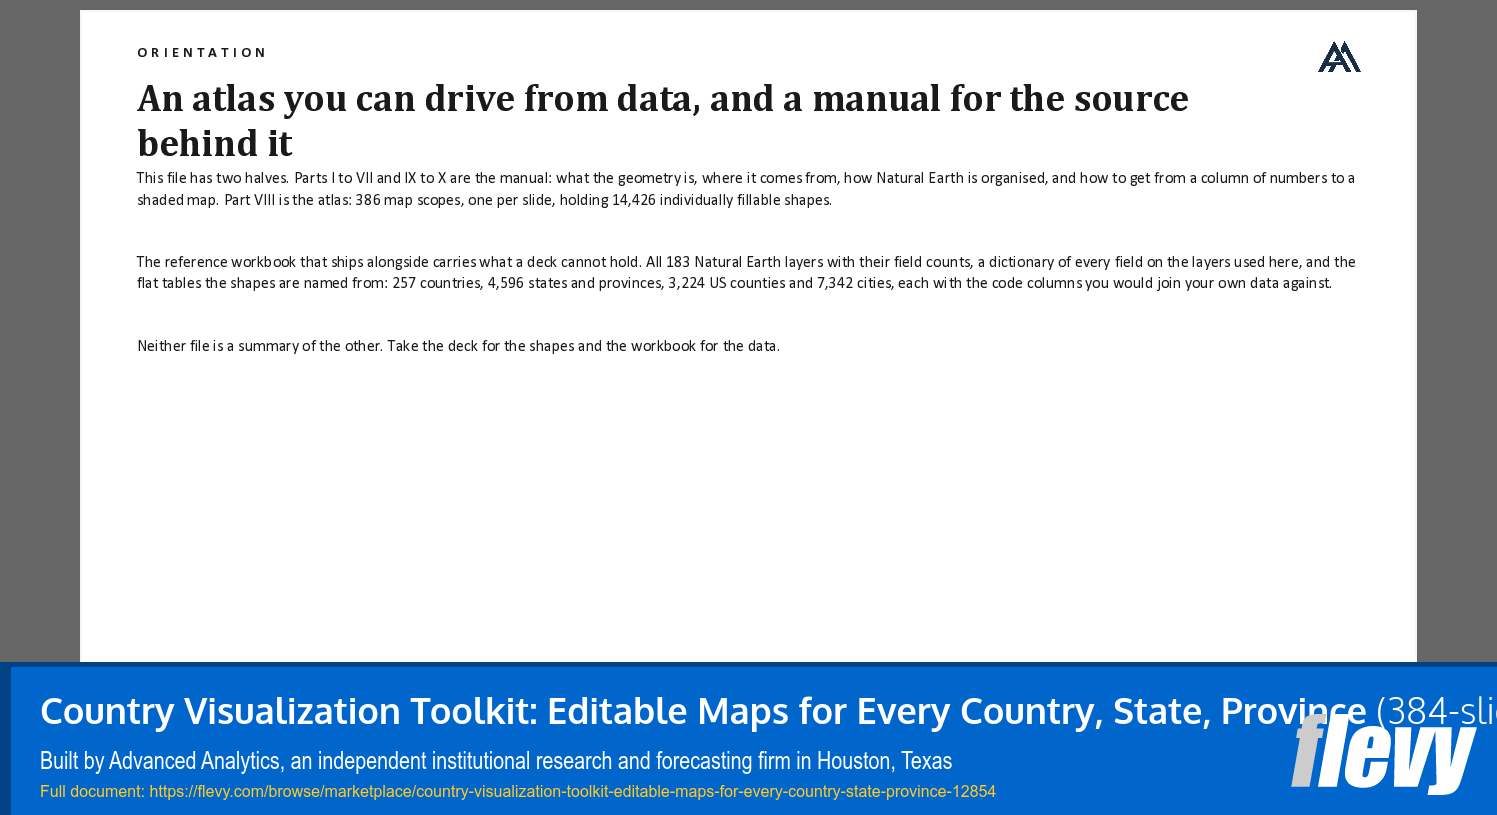
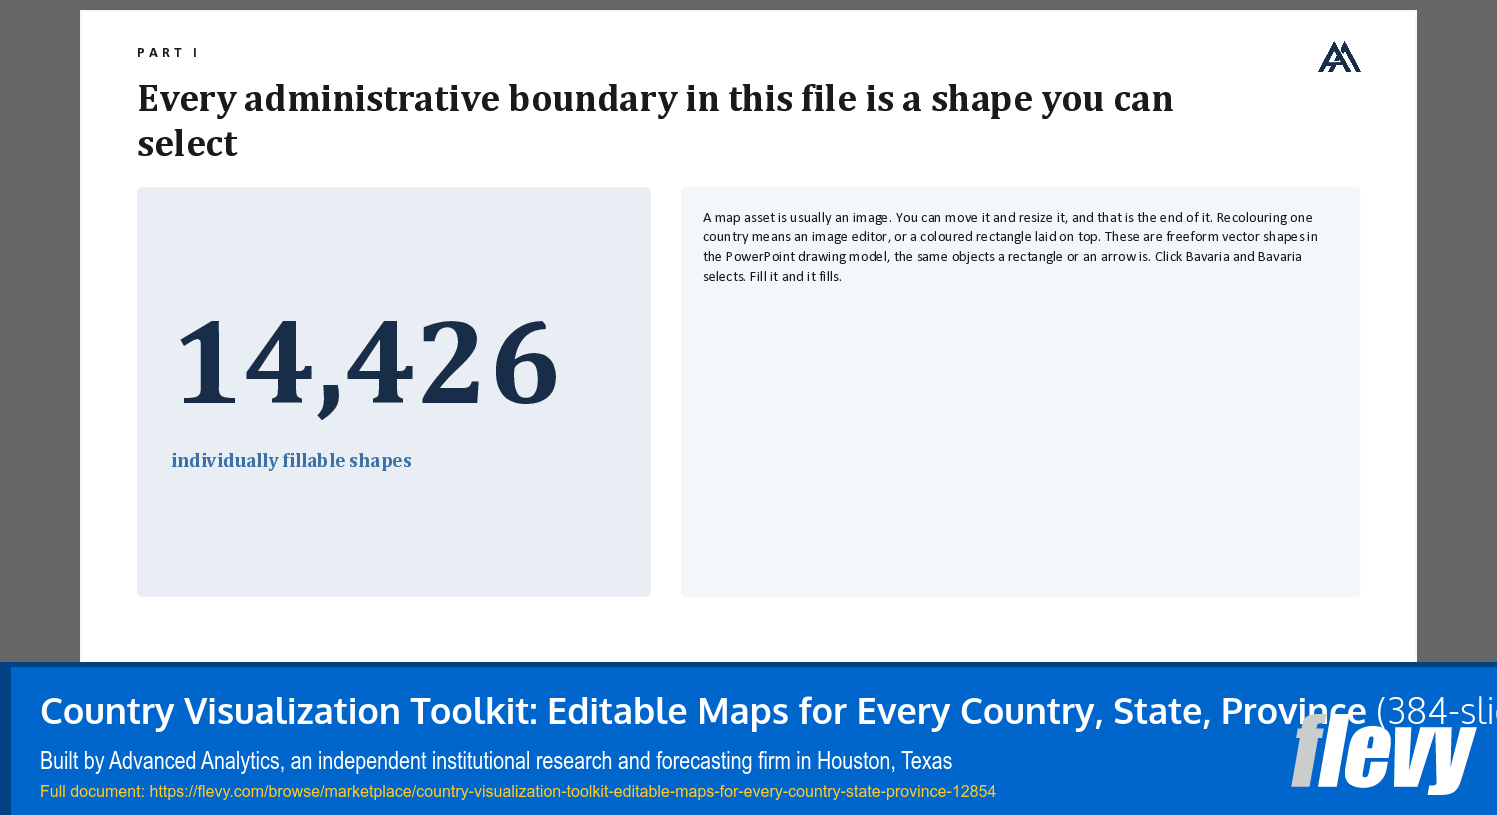
The library holds 385 map scopes and 14,426 individually fillable shapes, 11,240 of them carrying a name you can shade from data:
–The world, with all 257 countries as separate shapes, in a true Robinson projection
–25 regional maps, each cut to a proper cartographic window rather than assembled from a country list, so Europe is Europe and not four fifths Siberia
–257 country maps, subdivided into states, provinces, prefectures, departments or regions wherever that division exists, with neighboring countries drawn in as context
–The United States by state, and all 51 states individually by county, down to the last county in Texas
The geometry comes from Natural Earth version 5.1.2, the public domain dataset maintained under the North American Cartographic
Information Society. It is free for any use, commercial included, with no attribution required. That matters for a document you buy: nothing in this file carries a license that follows it into your own client work.
A reference volume ships alongside the maps. It documents the whole of Natural Earth, all 183 layers and 350,371 features across three scales, and explains which layer answers which question: where the 26 language name fields live, which of the five parallel country code systems to join on, why the same country map exists in 34 national point of view variants, and where the population series from 1950 to 2050 sits. The atlas is the working asset. The reference is how you go further than it.
Got a question about the product? Email us at support@flevy.com or ask the author directly by using the "Ask the Author a Question" form. If you cannot view the preview above this document description, go here to view the large preview instead.
Source: Best Practices in PowerPoint Map Diagrams PowerPoint Slides: Country Visualization Toolkit: Editable Maps for Every Country, State, Province PowerPoint (PPTX) Presentation Slide Deck, Advanced Analytics
ABOUT THE AUTHOR

Advanced Analytics is an independent institutional research and forecasting firm in Houston, Texas, founded in 2016. We build market forecasts and decision models for the industries powering the AI buildout -- grid equipment, data centre infrastructure, nuclear, semiconductors and industrial capital goods -- for institutional investors, private equity, manufacturers and utilities. The documents ... [read more]
Ask the Author a Question
You must be logged in to contact the author.




























