
Consulting Project-Based Engagement Financial Model – Excel XLSX
Excel (XLSX)
BENEFITS OF THIS DOWNLOADABLE EXCEL DOCUMENT
- Provides a comprehensive framework for building an investor-ready financial model tailored to project-based consulting and advisory firms.
- Delivers a structured system for forecasting revenue, utilization, staffing, and cash flow in professional services businesses.
- Equips founders and operators with a disciplined financial planning model designed to support capital raising, scaling, and long-term firm valuation growth.
CONSULTING TRAINING EXCEL DESCRIPTION
Curated by McKinsey-trained Executives
📊 Consulting Project-Based Engagement Financial Model – Investor-Ready Excel Pro Forma for Consulting Firms, Advisory Practices & Professional Services Entrepreneurs
The Ultimate Financial Model for Management Consultants, Boutique Firms & Professional Services Investors
Stop running your consulting firm on spreadsheets held together with guesswork.
Stop pitching PE firms and strategic buyers with revenue projections that don't survive one question.
Stop underestimating bench time, attrition, write-offs, and working capital drag.
Stop leaving money on the table because your utilization targets were never modeled correctly.
If you are launching a boutique advisory firm, scaling a consulting practice, opening a second office, structuring a partnership, or raising institutional capital – your financial model is not "just a spreadsheet."
It is your:
• #1 Investor & LP Pitch Weapon
• Bank & SBA Loan Approval Tool
• Utilization & Billing Rate Optimizer
• Headcount & Capacity Planning Command Center
• Partnership Structuring & Equity Roadmap
This model gives you – fully built, fully formula-driven – exactly what private equity firms, strategic acquirers, banks, and serious operators expect to see in a professional consulting firm business plan and financial projection package.
💼 What You Get
✅ 10-Year Integrated 3-Statement Financial Model (Annual + Monthly Granularity)
✅ Fully Linked Income Statement, Balance Sheet & Cash Flow Statement (Indirect Method)
✅ Revenue Built from Operational Drivers – Billable Hours × Billing Rate × Realization Rate
✅ Billing Rate Engine by Seniority (Partner, Director, Manager, Senior Consultant, Analyst)
✅ Dynamic Headcount & Capacity Planning Model with Attrition & Hiring Ramp
✅ Utilization Rate Modeling by Role with New Hire Ramp Curves
✅ Revenue Segmentation by Service Line, Revenue Type & Client Segment
✅ Cost of Revenue Schedule with Direct Delivery Compensation & Subcontractor Logic
✅ Operating Expense Engine – Sales, Marketing, G&A & Overhead Staffing
✅ Working Capital Schedule (DSO, WIP Days, DPO, Deferred Revenue, Bonus Accruals)
✅ CapEx & Depreciation Schedule with Asset-Level Useful Life Tracking
✅ Debt & Equity Schedule with Revolver, Partner Distributions & Equity Raises
✅ Break-Even Analysis & Partner Profit per Partner Tracking
✅ Sensitivity Tables & 5-Scenario Analysis (Base, High Growth, Recession, Pricing Pressure, Talent Shortage)
✅ Executive Dashboard with KPIs & 4 Dynamic Charts
✅ Blue-Coded Assumptions – Change One Cell, Entire Model Updates
This is not a generic professional services spreadsheet.
This is a complete consulting firm financial planning system built for real-world profitability and institutional capital raising.
🎯 Who This Is For
• First-time boutique consulting firm founders
• Established advisory practice owners preparing for a strategic sale
• Multi-practice consulting firms modeling expansion
• Private equity-backed consulting platforms
• Management consultants launching independent firms
• Partnership groups structuring equity and profit-sharing
• SBA and bank loan applicants in professional services
• Investors and PE funds evaluating consulting firm acquisitions
• M&A advisors preparing sell-side CIM financial packages
• Consultants building financial models for their own clients
If you bill by the hour, run client engagements, or plan to build a scalable advisory business – this was built for you.
🔥 Why Most Consulting Firm Financial Models Fail
Most templates rely on:
• Simple "Revenue = Headcount × Rate" with no operational logic
• No utilization ramp for new hires
• No realization rate or write-off modeling
• No attrition impact on capacity and revenue
• No working capital dynamics – DSO, WIP, deferred retainers
• No service line or client segment revenue segmentation
• No subcontractor overflow capacity logic
• No partner distribution or equity structure
• No debt schedule or revolver integration
• No true 3-statement linkage – balance sheet never balances
This model fixes all of that – from the ground up.
📊 What's Inside – Every Major Component
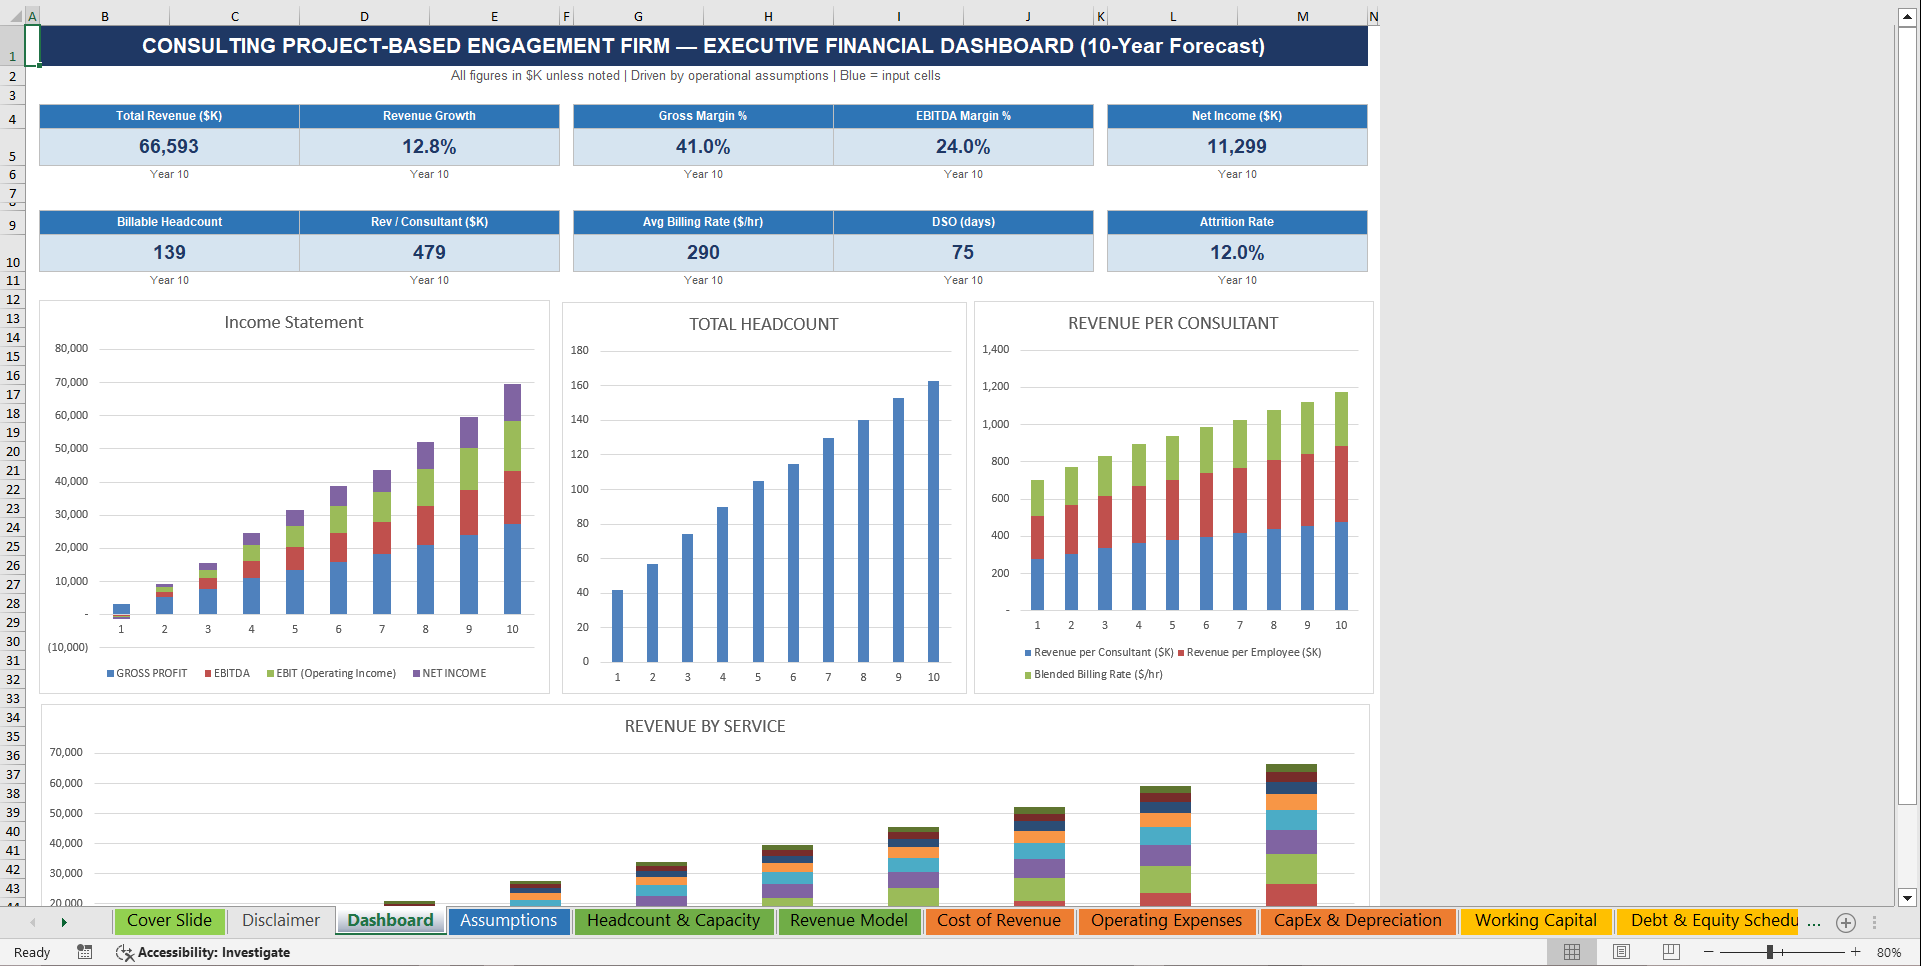
1️⃣ Executive Dashboard
Instant investor snapshot including:
• Total Revenue & Revenue Growth % (10-year)
• Gross Margin % & EBITDA Margin %
• Net Income & Cash Balance
• Billable Headcount & Revenue per Consultant
• Average Blended Billing Rate
• DSO, Attrition Rate & WIP Balance
• Partner Profit per Partner & ROIC
• 4 Dynamic Charts: Revenue Growth, Margin Trends, Headcount Growth, Gross Margin Trend
Built for pitch decks, investor data rooms, and bank submissions.
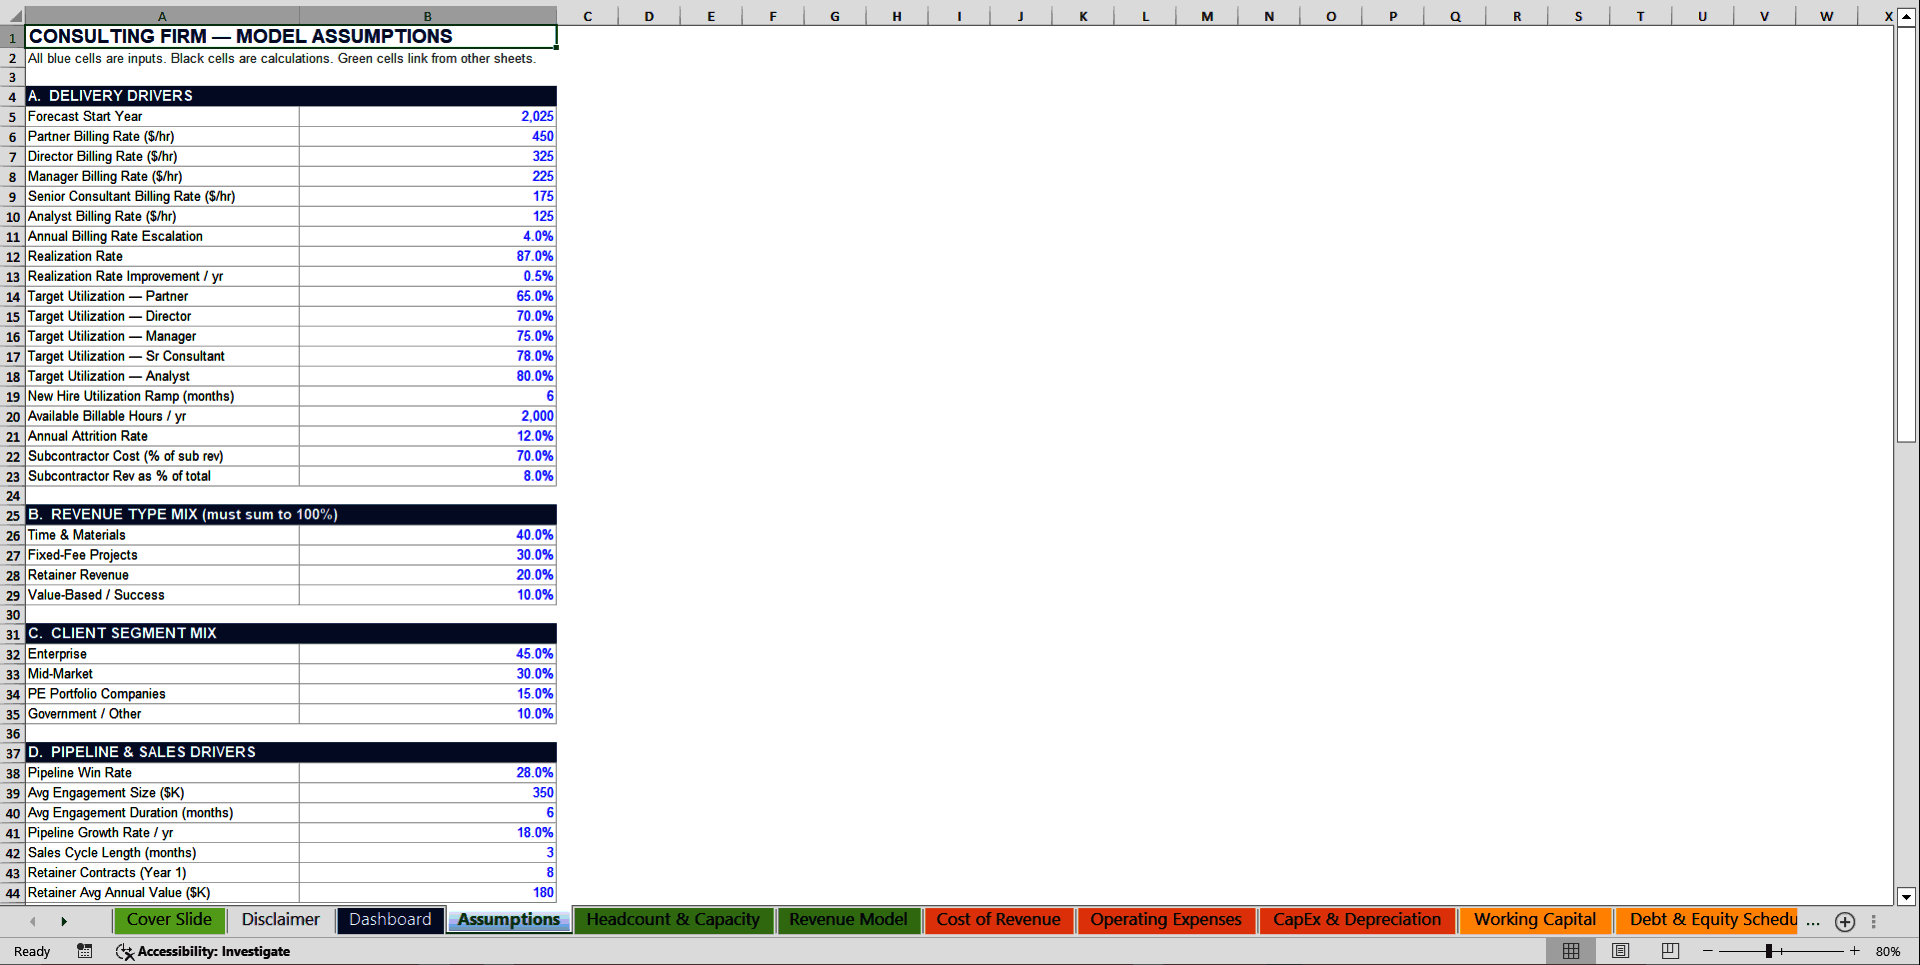
2️⃣ Assumptions Engine (Single Source of Truth)
Centralized input section controlling the entire model across 9 structured blocks:
• Delivery Drivers – Billing rates by seniority, realization rate, utilization targets by role, available hours, attrition rate, new hire ramp, subcontractor usage
• Revenue Type Mix – Time & Materials, Fixed-Fee, Retainer, Value-Based / Success Fees
• Client Segment Mix – Enterprise, Mid-Market, PE Portfolio Companies, Government
• Pipeline & Sales Drivers – Win rate, average engagement size, engagement duration, pipeline growth, retainer contracts & average value
• Working Capital – DSO, WIP days, DPO, bad debt %, write-off %, bonus payout lag, upfront retainer %
• Compensation – Base salary by role, annual salary escalation, bonus %, benefits & payroll tax %
• G&A & Overhead – Office rent per sqft, IT per employee, insurance, legal & audit, recruiting fees, marketing %
• Financial Assumptions – Tax rate, interest rate, revolver size, SBC %, partner distribution %, opening cash & equity
• CapEx – IT hardware per employee, office build-out, capitalized software, asset useful lives
Change one input – the entire 10-year model recalculates instantly.
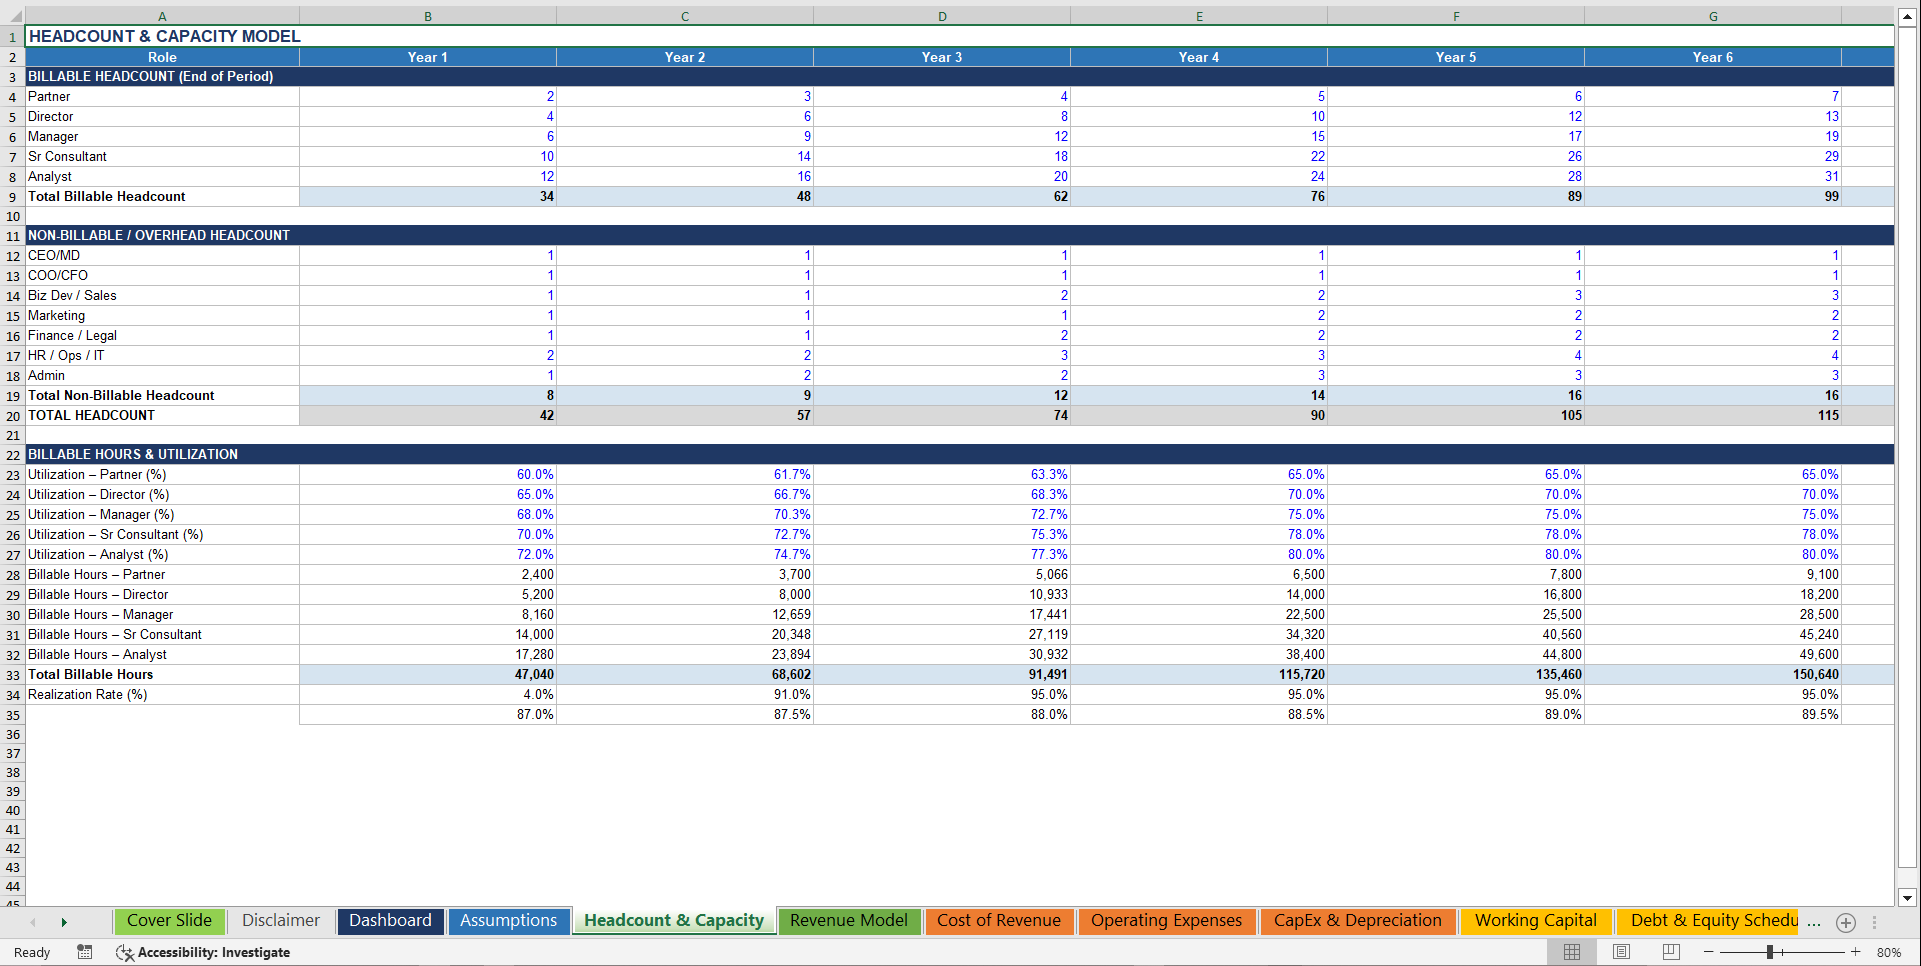
3️⃣ Headcount & Capacity Model
Structured for real consulting firm operations:
• Billable headcount plan by role – Partner, Director, Manager, Senior Consultant, Analyst
• Non-billable / overhead headcount – CEO, COO/CFO, Biz Dev, Marketing, Finance, HR/Ops/IT, Admin
• Utilization rate by seniority with ramp curves for new hires
• Billable hours calculated per role per year
• Total billable hours and blended realization rate
• Attrition-adjusted headcount dynamics
Know exactly what your capacity and bench cost looks like before signing a lease or adding a Partner.
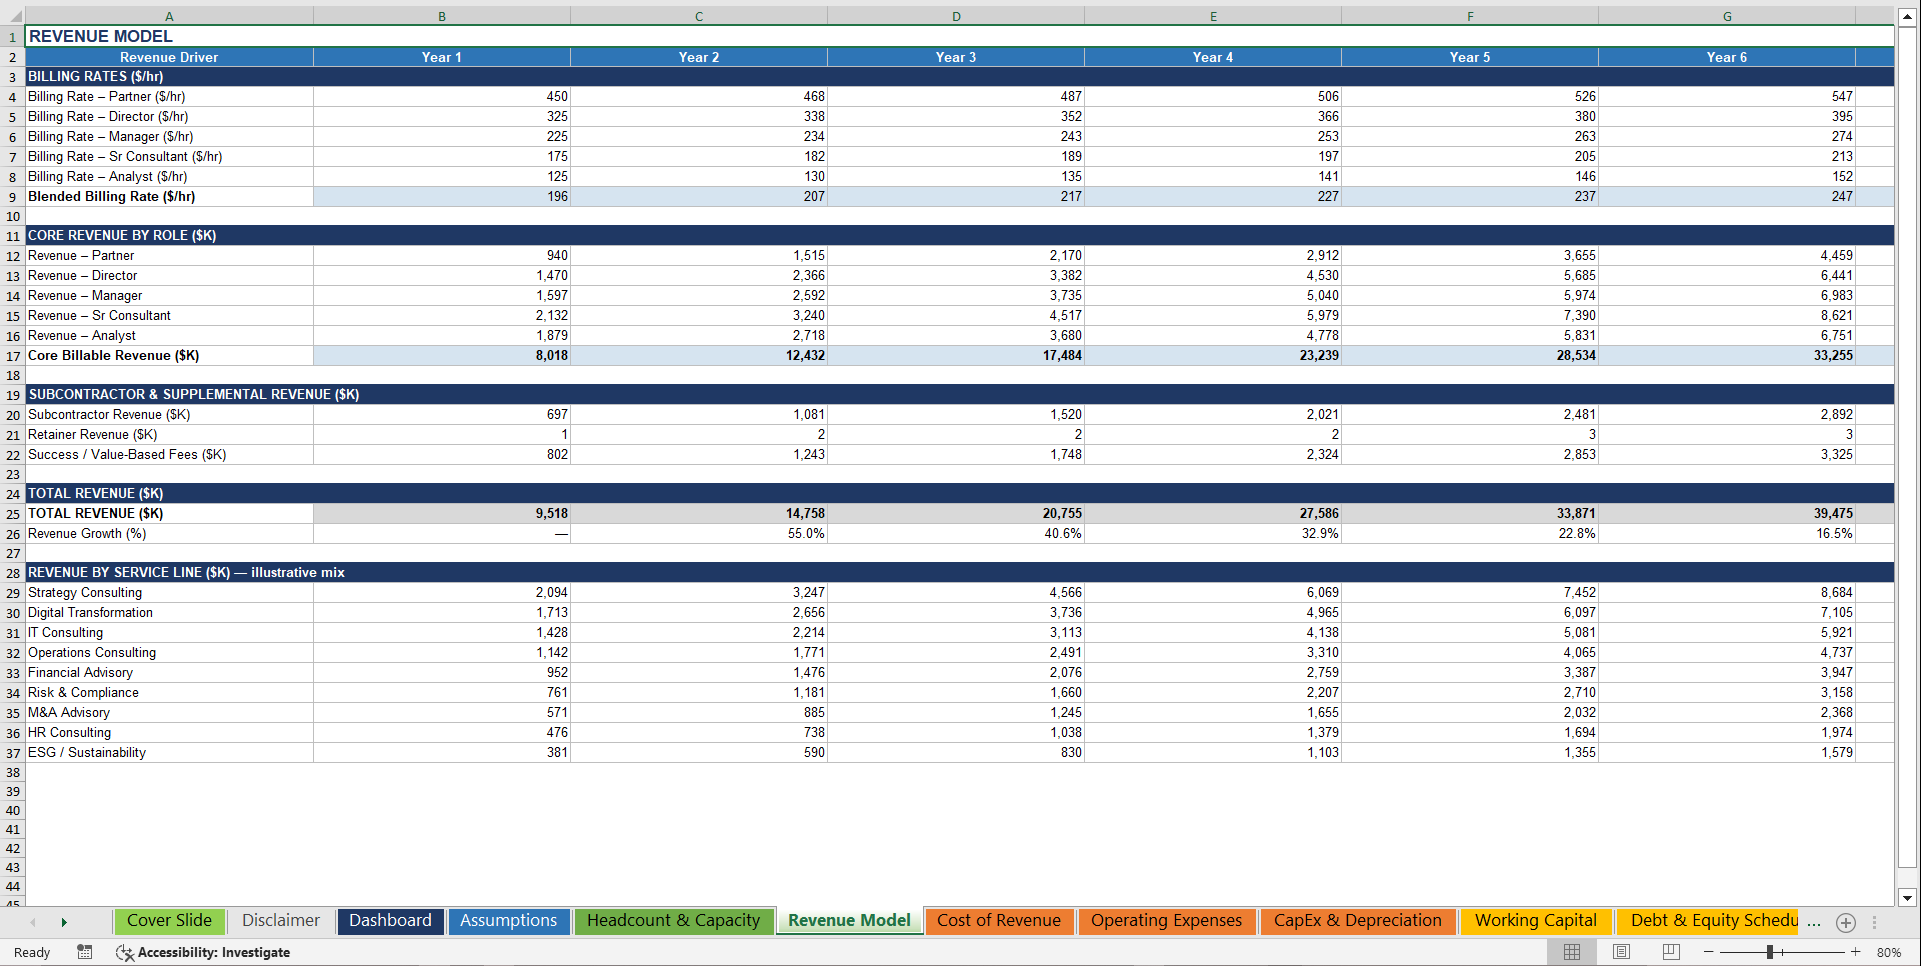
4️⃣ Revenue Engine (Built Like a Real Consulting Firm)
Model includes:
• Revenue by seniority level (Partner through Analyst)
• Blended billing rate calculated dynamically from hours-weighted mix
• Annual billing rate escalation compounding over 10 years
• Subcontractor overflow revenue
• Retainer contract revenue with pipeline-driven growth
• Value-based and success fee revenue
• Revenue by service line – Strategy, Digital Transformation, IT, Operations, Financial Advisory, Risk & Compliance, M&A, HR, ESG, Managed Services
• Revenue growth tracked year-over-year
This allows you to stress-test headcount, pricing, utilization, and service mix before committing capital.
5️⃣ Cost of Revenue Schedule & Gross Margin Tracking
Track real profitability at the delivery level:
• Direct consultant base compensation by role
• Bonus & incentive pay tied to billable revenue
• Benefits and payroll taxes on delivery staff
• Subcontractor and contractor costs
• Project travel & entertainment
• Delivery software and tools
See:
• Total cost of revenue by year
• Gross profit by year
• Gross margin % progression from Year 1 through Year 10
• Margin improvement as the firm scales and billing rates compound
Stop guessing your profit. Know it.
6️⃣ Operating Expense Engine
Full overhead visibility across two structured blocks:
Sales & Marketing:
• Marketing programs, campaigns & thought leadership content
• Business development salaries with bonus and benefits loaded
General & Administrative:
• Overhead staff compensation – all non-billable roles fully modeled
• Office rent driven by headcount × sqft × rate per sqft
• IT & software licenses per employee
• Insurance as a percentage of revenue
• Legal & audit fees with inflation escalation
• Recruiting fees tied to net new hires
• Training & development
• Stock-based compensation
Structured for real consulting firm P&L management – not theory.
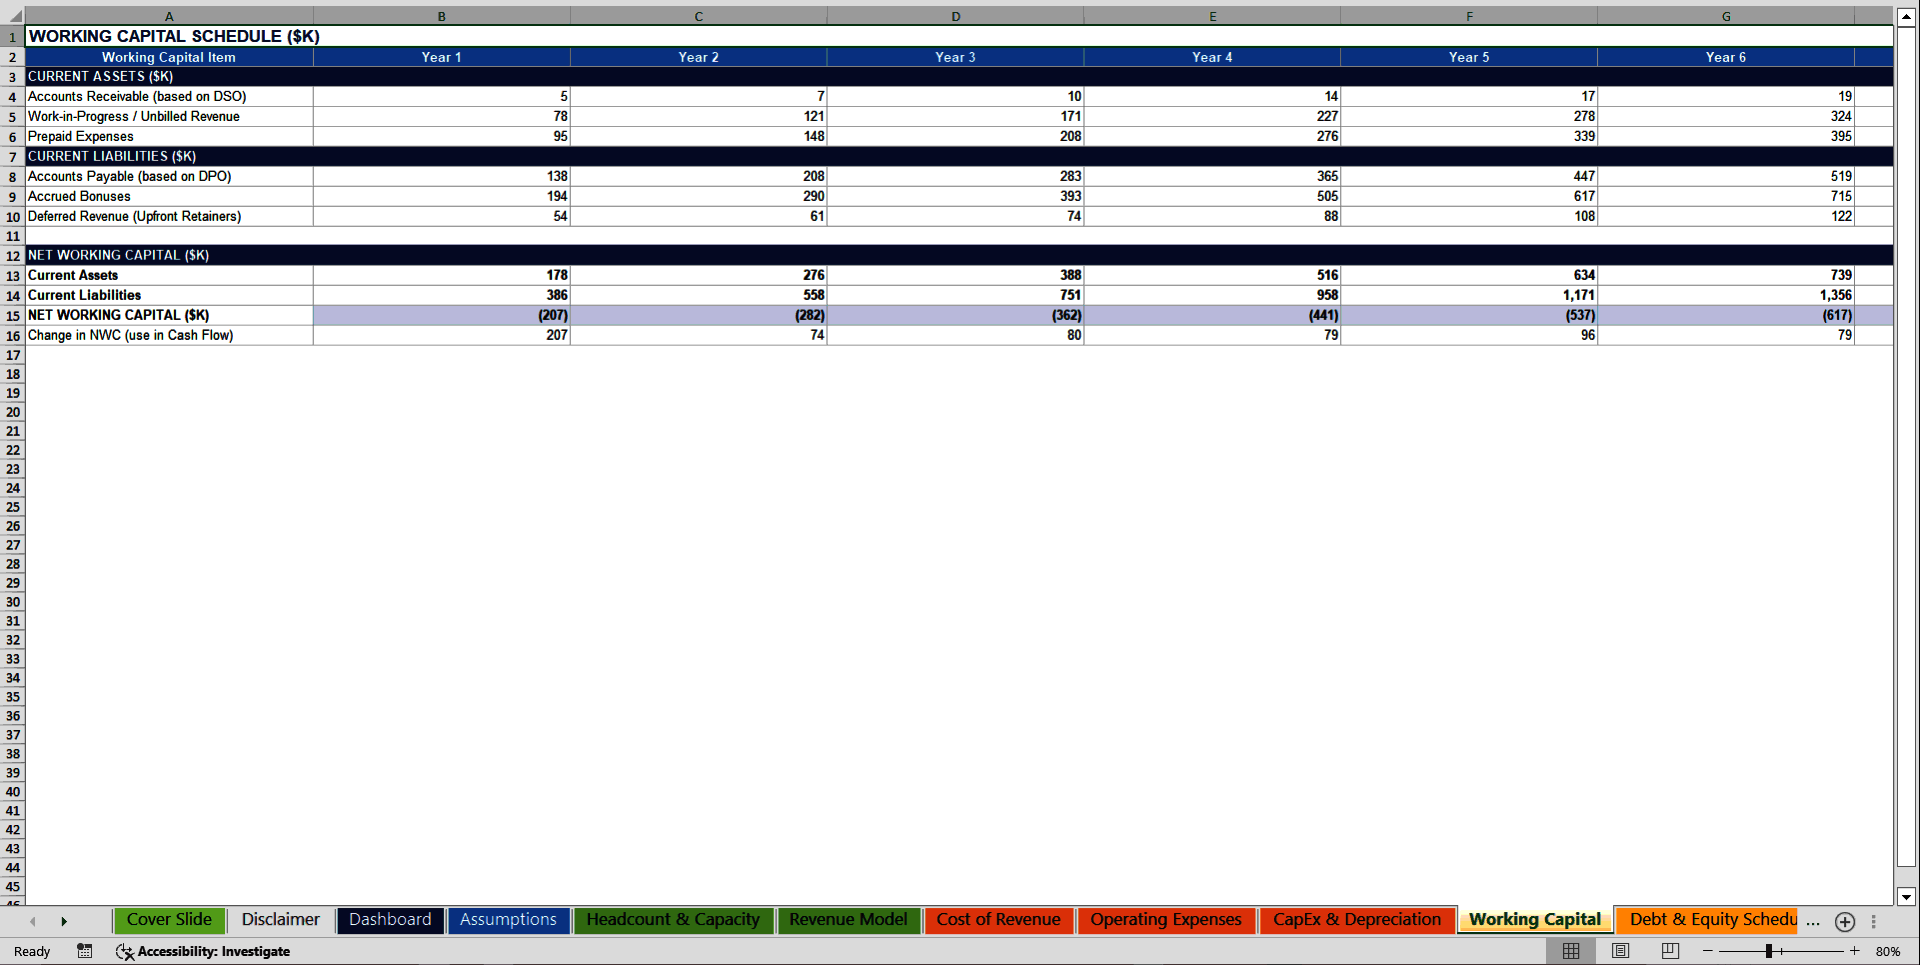
7️⃣ Working Capital Schedule
The most overlooked driver of consulting firm cash flow – fully modeled:
• Accounts receivable based on DSO
• Work-in-progress / unbilled revenue based on WIP days
• Prepaid expenses
• Accounts payable based on DPO
• Accrued bonuses (quarterly lag)
• Deferred revenue from upfront retainer billing
• Net working capital and period-over-period change
Built to reflect the real cash conversion cycle of a project-based professional services firm.
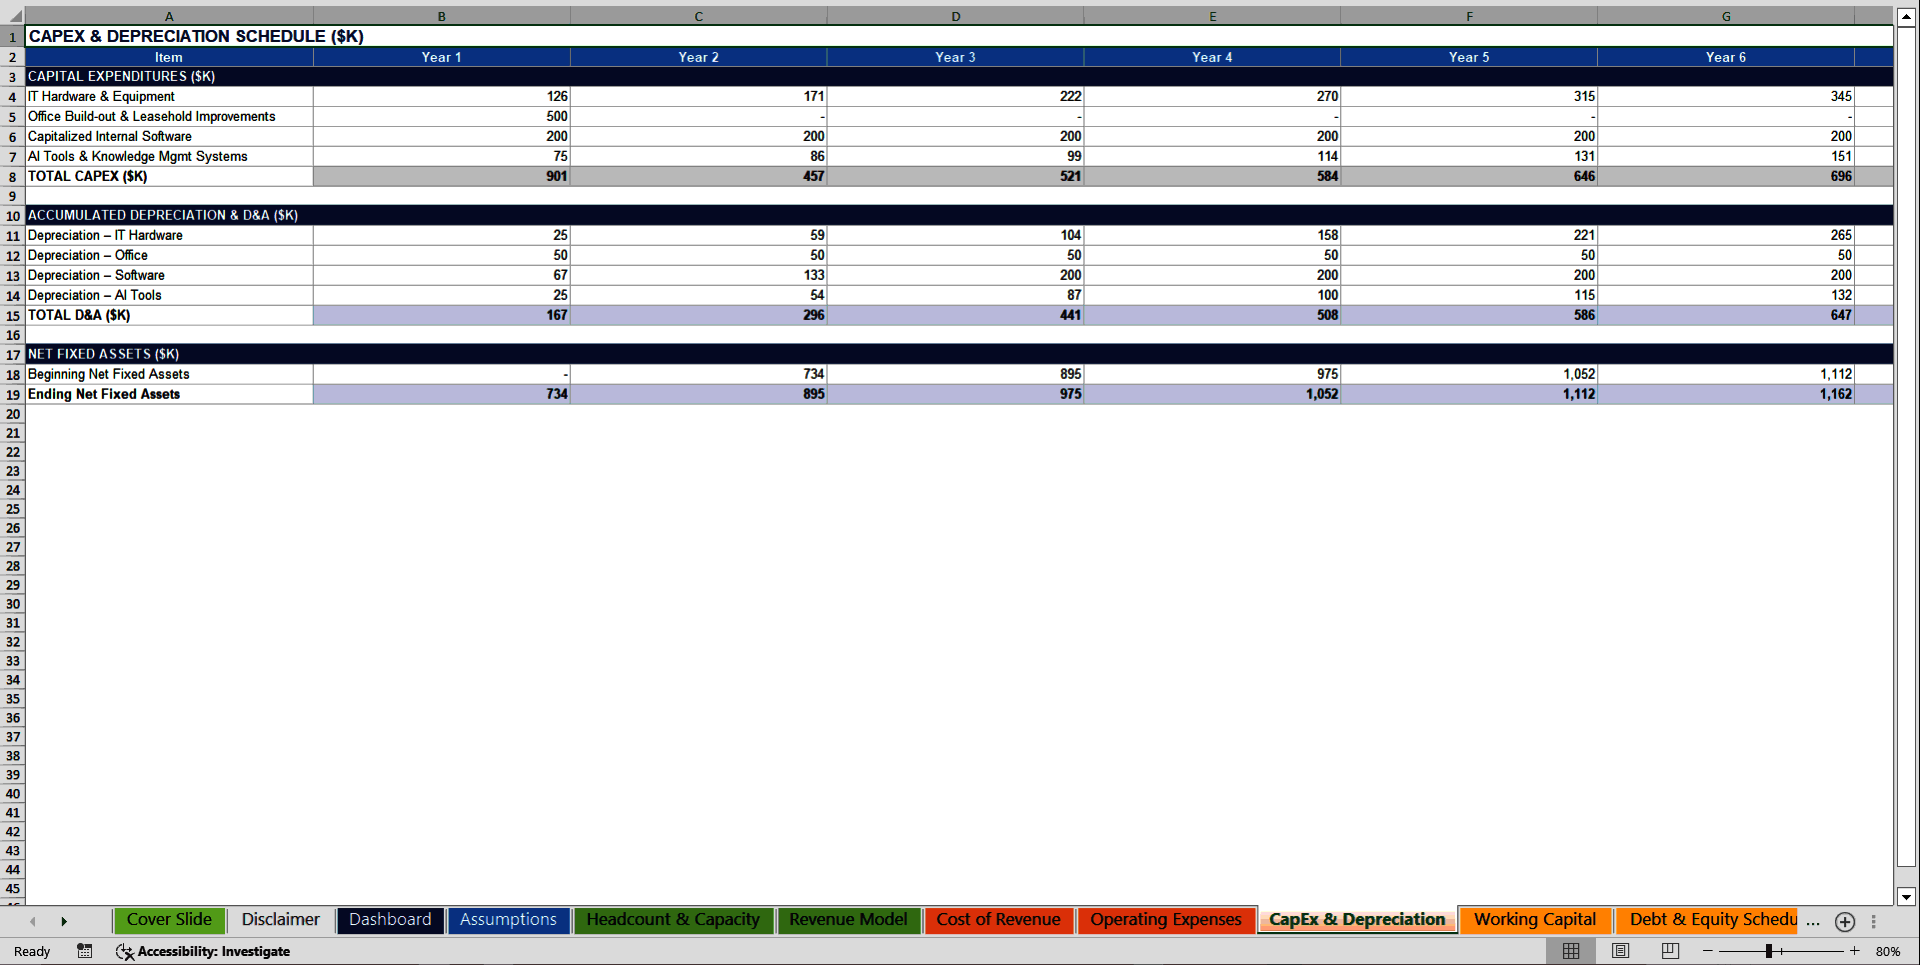
8️⃣ CapEx & Depreciation Schedule
Asset-level capital expenditure tracking:
• IT hardware per employee per year
• Office build-out and leasehold improvements (Year 1)
• Capitalized internal software
• AI productivity tools and knowledge management systems
• Straight-line depreciation by asset class with individual useful lives
• Net fixed asset roll-forward linked directly to the Balance Sheet
9️⃣ Debt & Equity Schedule
Institutional-grade financing structure:
• Beginning and ending debt balance roll-forward
• New debt issuance and repayment tracking
• Interest expense calculated on average debt balance
• Revolving credit facility sized in assumptions
• Equity raised and partner capital contributions
• Partner distributions / dividends linked to net income and payout ratio
Perfect for SBA loans, bank financing, private lenders, or partnership capital structuring.
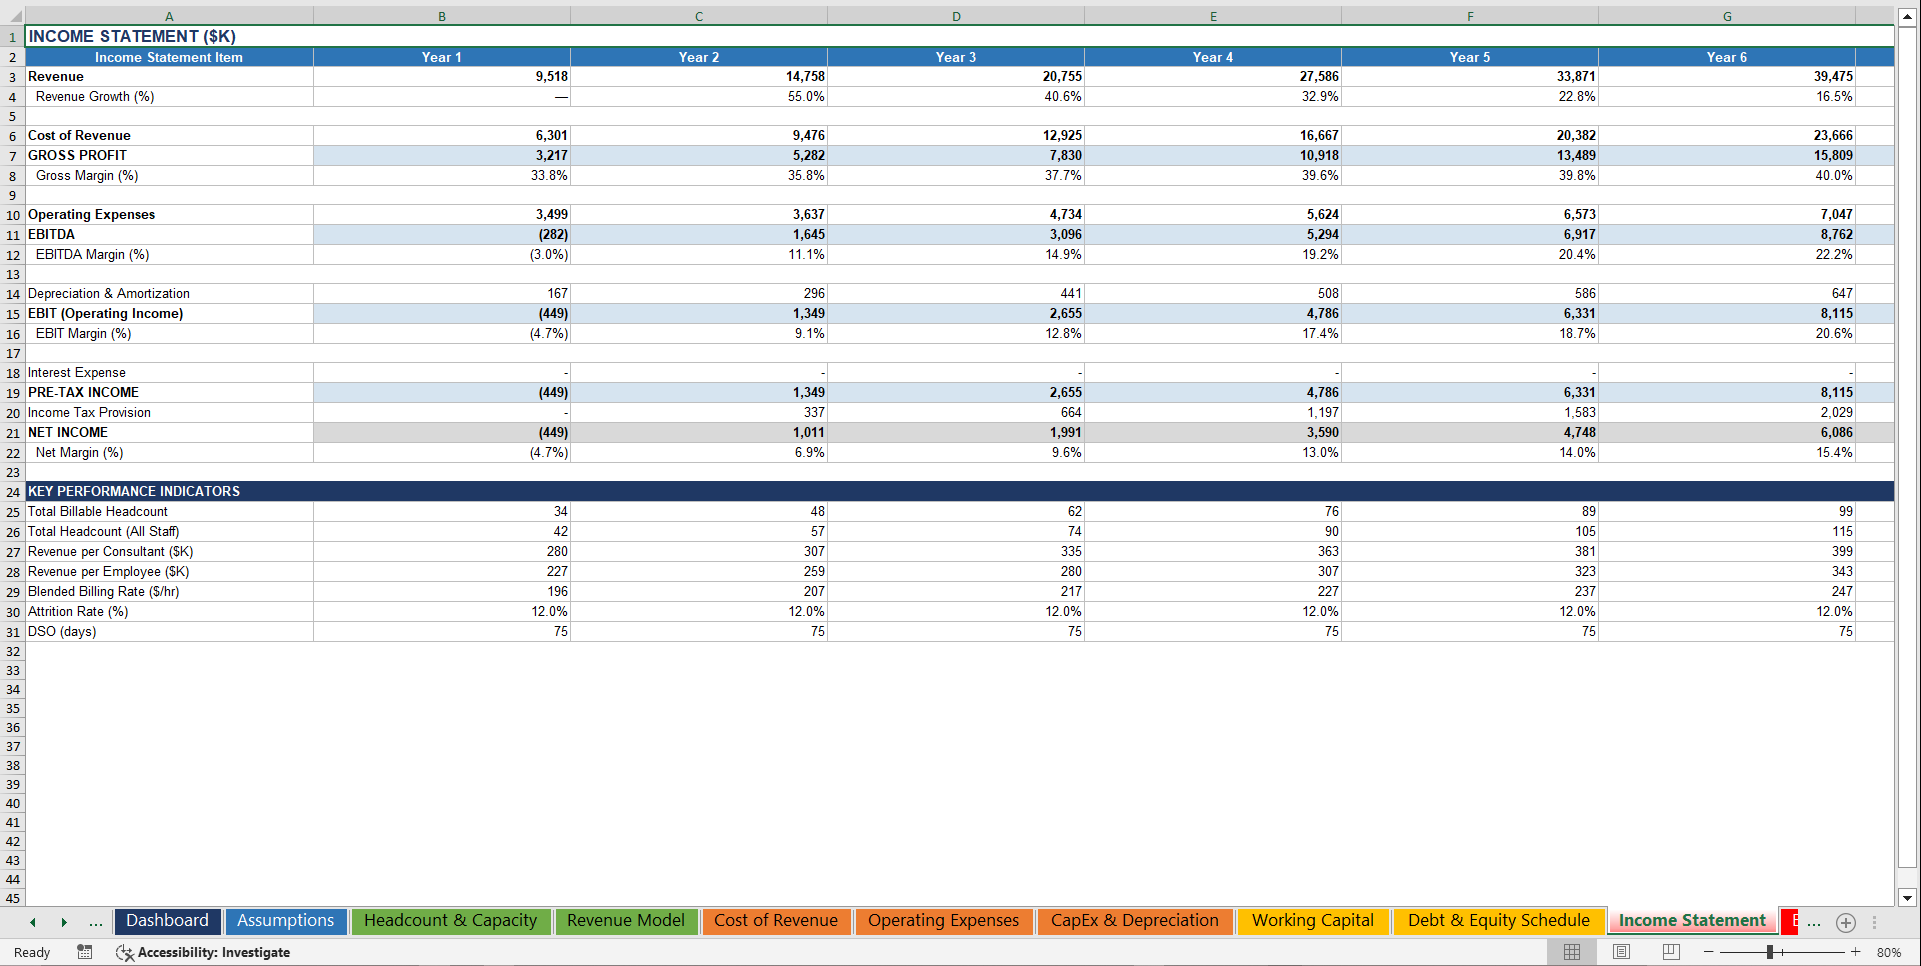
🔟 Integrated 3-Statement Financial Model
✔ Income Statement – Revenue through Net Income with Gross Margin, EBITDA, EBIT & Net Margin %
✔ Cash Flow Statement – Indirect method, fully linked: Net Income → D&A → SBC → Working Capital Changes → CapEx → Financing
✔ Balance Sheet – Cash, AR, WIP, Fixed Assets, AP, Accrued Compensation, Deferred Revenue, Debt, Equity, Retained Earnings
Everything connects. Everything balances. Everything updates automatically.
1️⃣1️⃣ Sensitivity & Scenario Analysis
Instant visibility into your real risk exposure:
Sensitivity Table 1: Utilization Rate vs. Billing Rate Escalation → EBITDA Margin (Year 5)
Sensitivity Table 2: Attrition Rate vs. Win Rate → Revenue (Year 5)
5 Full Scenario Snapshots at Year 5:
• Base Case – $33.9M revenue, 40% gross margin, 20% EBITDA margin
• High Growth Case – $68M revenue, 49% gross margin, 24% EBITDA margin
• Recession Case – $28M revenue, 40% gross margin, 10% EBITDA margin
• Pricing Pressure Case – $38M revenue, 42% gross margin, 15% EBITDA margin
• Talent Shortage Case – $32M revenue, 38% gross margin, 8% EBITDA margin
Know your risk before you sign the next engagement – or the next lease.
💎 Why This Consulting Model Is Different
✔ Built specifically for project-based consulting firms – not generic SaaS or retail templates
✔ Revenue driven by billable hours, billing rates, utilization and realization – not arbitrary growth %
✔ Labor-driven cost structure with role-level compensation detail
✔ Fully integrated 3-statement model – balance sheet actually balances
✔ Working capital dynamics built for professional services cash cycles
✔ Partnership distribution and equity structure included
✔ 10-year forecast horizon suitable for PE, strategic sale, or IPO readiness
✔ Institutional-level structure scaled for boutique firms and growing practices
✔ Professional formatting with color-coded inputs, formulas and cross-sheet links
✔ Dynamic and fully editable – your assumptions, your numbers, your model
This is how serious consulting firm operators and their investors plan.
🧠 Built for Real Profit Decisions
This model allows you to:
• Secure bank or SBA financing with a credible projection package
• Raise capital from private equity or strategic investors
• Negotiate better office lease terms with landlord-ready financials
• Optimize billing rates and utilization targets by seniority
• Control labor costs and bench time proactively
• Manage cash flow around DSO, bonus cycles and retainer billing
• Structure partner compensation, equity and distributions correctly
• Evaluate second-office or new practice area expansion economics
• Prepare sell-side financial documentation for an M&A process
• Make data-driven decisions instead of gut-feel ones
Instead of hoping your consulting firm makes money – you know when and how it will.
🚨 The Cost of Not Having This
Without a proper financial model, you risk:
• Running out of cash between project cycles
• Underpricing your billing rates for years
• Overstaffing during a slow pipeline quarter
• Underestimating startup and build-out costs
• Getting rejected by lenders for missing financial documentation
• Signing the wrong office lease for the wrong term
• Losing investor confidence in your first meeting
• Closing within the first two years – like most boutique firms do
One properly structured, well-run consulting firm can generate extraordinary returns on human capital.
But only if you plan it correctly.
⚡ Stop Guessing. Start Modeling Like a Professional Services CFO.
If you are serious about:
• Launching a profitable consulting firm
• Scaling an advisory practice
• Raising institutional capital
• Securing bank financing
• Maximizing billing rates and utilization
• Building a long-term professional services business worth selling
This model is your shortcut.
👉 Download the Consulting Project-Based Engagement Financial Model today – and launch, fund, and scale your advisory firm with confidence.
Key Words:
Strategy & Transformation, Growth Strategy, Strategic Planning, Strategy Frameworks, Innovation Management, Pricing Strategy, Core Competencies, Strategy Development, Business Transformation, Marketing Plan Development, Product Strategy, Breakout Strategy, Competitive Advantage, Mission, Vision, Values, Strategy Deployment & Execution, Innovation, Vision Statement, Core Competencies Analysis, Corporate Strategy, Product Launch Strategy, BMI, Blue Ocean Strategy, Breakthrough Strategy, Business Model Innovation, Business Strategy Example, Corporate Transformation, Critical Success Factors, Customer Segmentation, Customer Value Proposition, Distinctive Capabilities, Enterprise Performance Management, KPI, Key Performance Indicators, Market Analysis, Market Entry Example, Market Entry Plan, Market Intelligence, Market Research, Market Segmentation, Market Sizing, Marketing, Michael Porter's Value Chain, Organizational Transformation, Performance Management, Performance Measurement, Platform Strategy, Product Go-to-Market Strategy, Reorganization, Restructuring, SWOT, SWOT Analysis, Service 4.0, Service Strategy, Service Transformation, Strategic Analysis, Strategic Plan Example, Strategy Deployment, Strategy Execution, Strategy Frameworks Compilation, Strategy Methodologies, Strategy Report Example, Value Chain, Value Chain Analysis, Value Innovation, Value Proposition, Vision Statement, Corporate Strategy, Business Development, Business plan pdf, business plan, PDF, Business Plan DOC, Business Plan Template, PPT, Market strategy playbook, strategic market planning, competitive analysis tools, market segmentation frameworks, growth strategy templates, product positioning strategy, market execution toolkit, strategic alignment playbook, KPI and OKR frameworks, business growth strategy guide, cross-functional strategy templates, market risk management, market strategy PowerPoint doc, guide, ebook, e-book ,McKinsey Change Playbook, Organizational change management toolkit, Change management frameworks 2025, Influence model for change, Change leadership strategies, Behavioral change in organizations, Change management PowerPoint templates, Transformational leadership in change, supply chain KPIs, supply chain KPI toolkit, supply chain PowerPoint template, logistics KPIs, procurement KPIs, inventory management KPIs, supply chain performance metrics, manufacturing KPIs, supply chain dashboard, supply chain strategy KPIs, reverse logistics KPIs, sustainability KPIs in supply chain, financial supply chain KPIs, warehouse KPIs, digital supply chain KPIs, 1200 KPIs, supply chain scorecard, KPI examples, supply chain templates, Corporate Finance SOPs, Finance SOP Excel Template, CFO Toolkit, Finance Department Procedures, Financial Planning SOPs, Treasury SOPs, Accounts Payable SOPs, Accounts Receivable SOPs, General Ledger SOPs, Accounting Policies Template, Internal Controls SOPs, Finance Process Standardization, Finance Operating Procedures, Finance Department Excel Template, FP&A Process Documentation, Corporate Finance Template, Finance SOP Toolkit, CFO Process Templates, Accounting SOP Package, Tax Compliance SOPs, Financial Risk Management Procedures.
NOTE: Our digital products are sold on an "as is" basis, making returns and refunds unavailable post-download. Please preview and inquire before purchasing. Please contact us before purchasing if you have any questions! This policy aligns with the standard Flevy Terms of Usage.
Got a question about the product? Email us at support@flevy.com or ask the author directly by using the "Ask the Author a Question" form. If you cannot view the preview above this document description, go here to view the large preview instead.
Source: Best Practices in Consulting Training, Integrated Financial Model Excel: Consulting Project-Based Engagement Financial Model Excel (XLSX) Spreadsheet, SB Consulting
ABOUT THE AUTHOR
SB Consulting is dedicated to empowering businesses to communicate their ideas with impact. This consulting firm specializes in teaching organizations how to create effective corporate and management presentations. With training from top-tier global consulting firms, including McKinsey, BCG, and Porsche Consulting, extensive expertise in presentation design and ... [read more]
Ask the Author a Question
You must be logged in to contact the author.
