
Construction Company 10-Year 3 Statement Financial Model – Excel XLSX
Excel (XLSX)
BENEFITS OF THIS DOWNLOADABLE EXCEL DOCUMENT
- Provides a structured financial modeling framework tailored for construction companies to plan project pipelines, forecast cash flow, and scale operations with investor-ready projections.
- Delivers a comprehensive pro forma system for general contractors and infrastructure developers to model contract revenue, subcontractor costs, and long-term profitability.
- Enables construction founders and finance teams to build data-driven financial forecasts that support fundraising, banking approvals, and strategic expansion decisions.
CONSTRUCTION EXCEL DESCRIPTION
Curated by McKinsey-trained Executives
🏗️ Construction Company Financial Model – Investor-Ready Excel Pro Forma for General Contractors, Subcontractors & Infrastructure Developers
The Ultimate Financial Model for Construction Founders, Project Finance Teams & Infrastructure Investors
Stop bidding on projects based on gut feeling.
Stop pitching investors with back-of-napkin contract margin math.
Stop underestimating subcontractor dependency, backlog conversion lag, and regulatory cash drag.
Stop losing money because your projections ignored labor inflation, equipment depreciation compounding, and payment retention cycles.
If you are launching a general contracting firm, scaling a multi-division infrastructure business, entering a new regional market, franchising a construction management platform, or raising a Series A – your financial model is not "just a spreadsheet."
It is your:
• #1 Investor Pitch Weapon
• Banking & Bonding Approval Tool
• Subcontractor Cost Optimizer
• Project-Level Profit Command Center
• Multi-Jurisdiction Expansion Roadmap
This model gives you – fully built, fully formula-driven – exactly what banks, private equity firms, infrastructure funds, bonding agencies, and serious construction operators expect to see in a professional construction business plan and financial projection package.
💼 What You Get
✅ 10-Year Fully Integrated 3-Statement Financial Model
✅ Annual Revenue & Cash Flow Forecasts with Monthly-Grade Granularity
✅ Project Acquisition Engine Built from Bid Win Rate × Backlog Conversion × Active Contract Volume
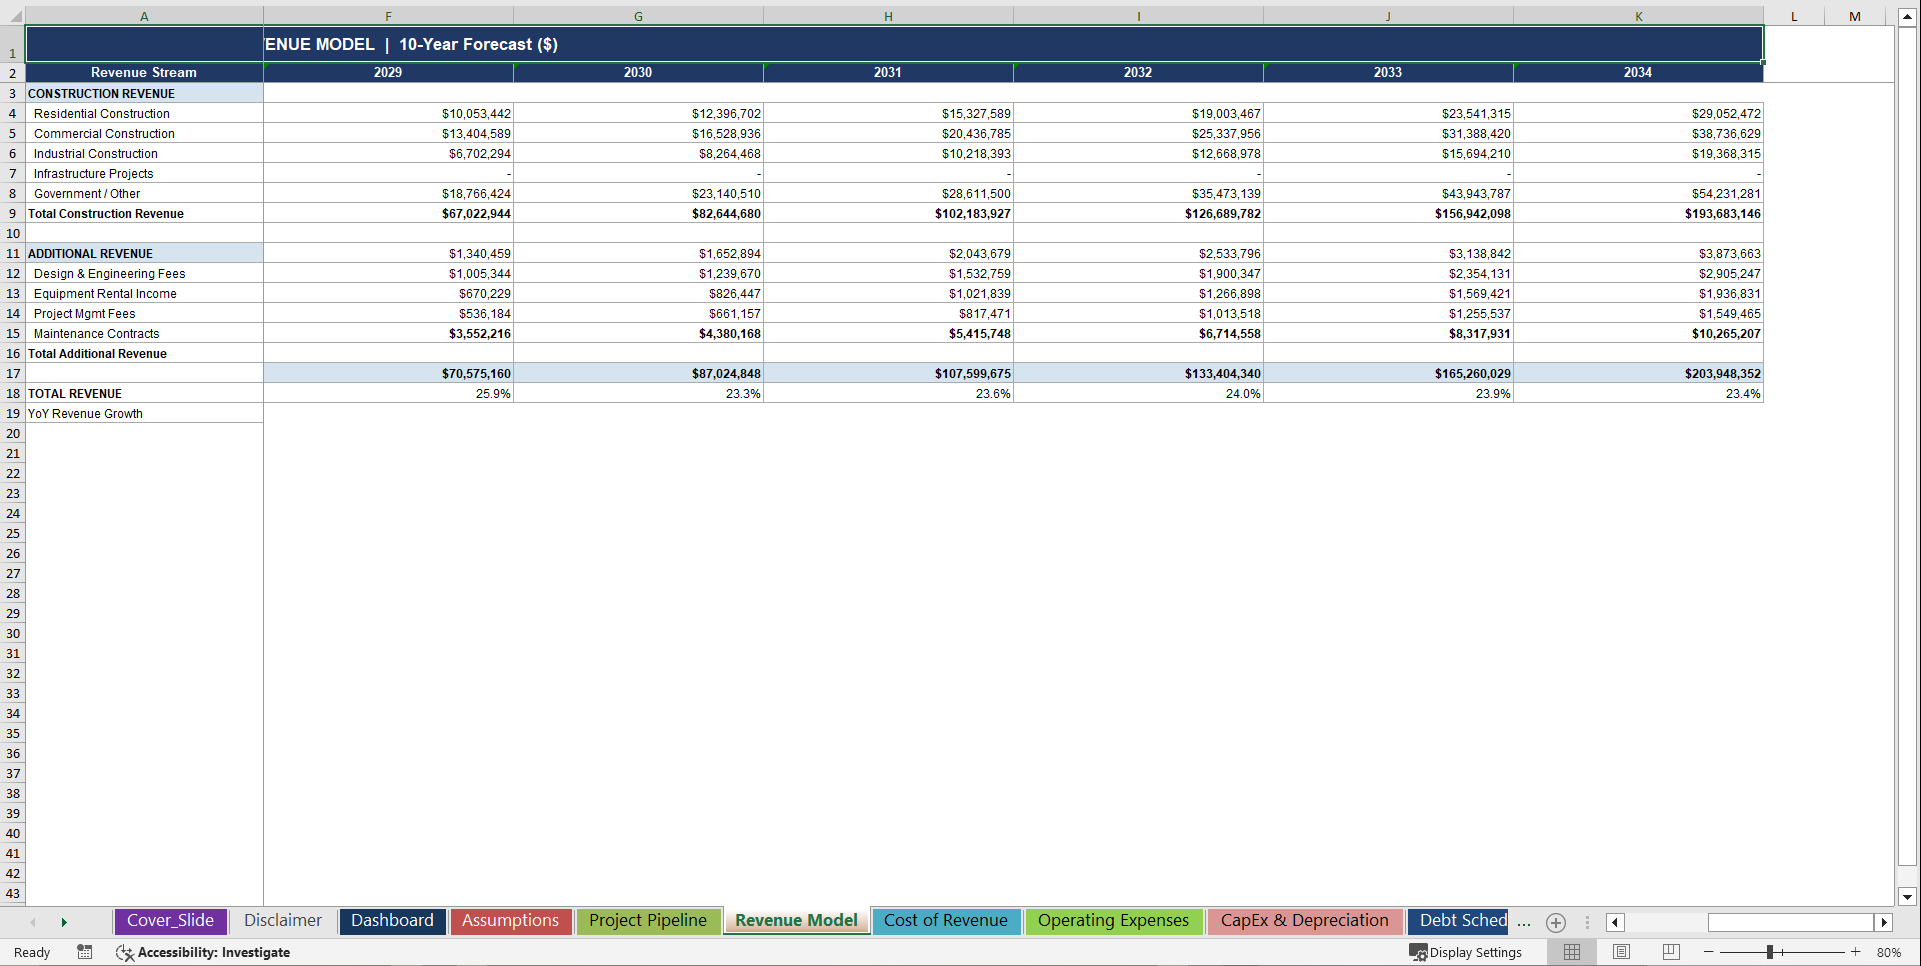
✅ Revenue Segmented by Contract Type (Residential, Commercial, Industrial, Infrastructure, Government)
✅ Revenue Segmented by Customer Segment (Private Developers, Corporate Clients, Government Agencies, Infrastructure Authorities)
✅ Subcontractor Cost & Affiliate Fee Modeling (Fixed-Price, Cost-Plus & Time-and-Materials)
✅ Bonus Cost, Bid Preparation Burn & Regulatory Compliance Provision Tracking
✅ House Edge replaced by: Blended Gross Margin Engine (GGR = Turnover × Blended House Edge → Revenue = Contract Value × Completion %)
✅ Project Cohort Retention Curves & Lifetime Client Value Modeling
✅ Generic Fixed Cost Structure replaced by: Jurisdiction-Level Licensing, Permitting & Regulatory Compliance Costs
✅ Corporate Headcount & Salary Build by Team (Engineering, Compliance, Safety, Project Management, Business Development)
✅ CapEx Schedule – Equipment Procurement, Fleet Expansion, Site Infrastructure & Fraud-Proof Cost Control Systems
✅ PP&E Rollforward with Straight-Line Equipment Depreciation
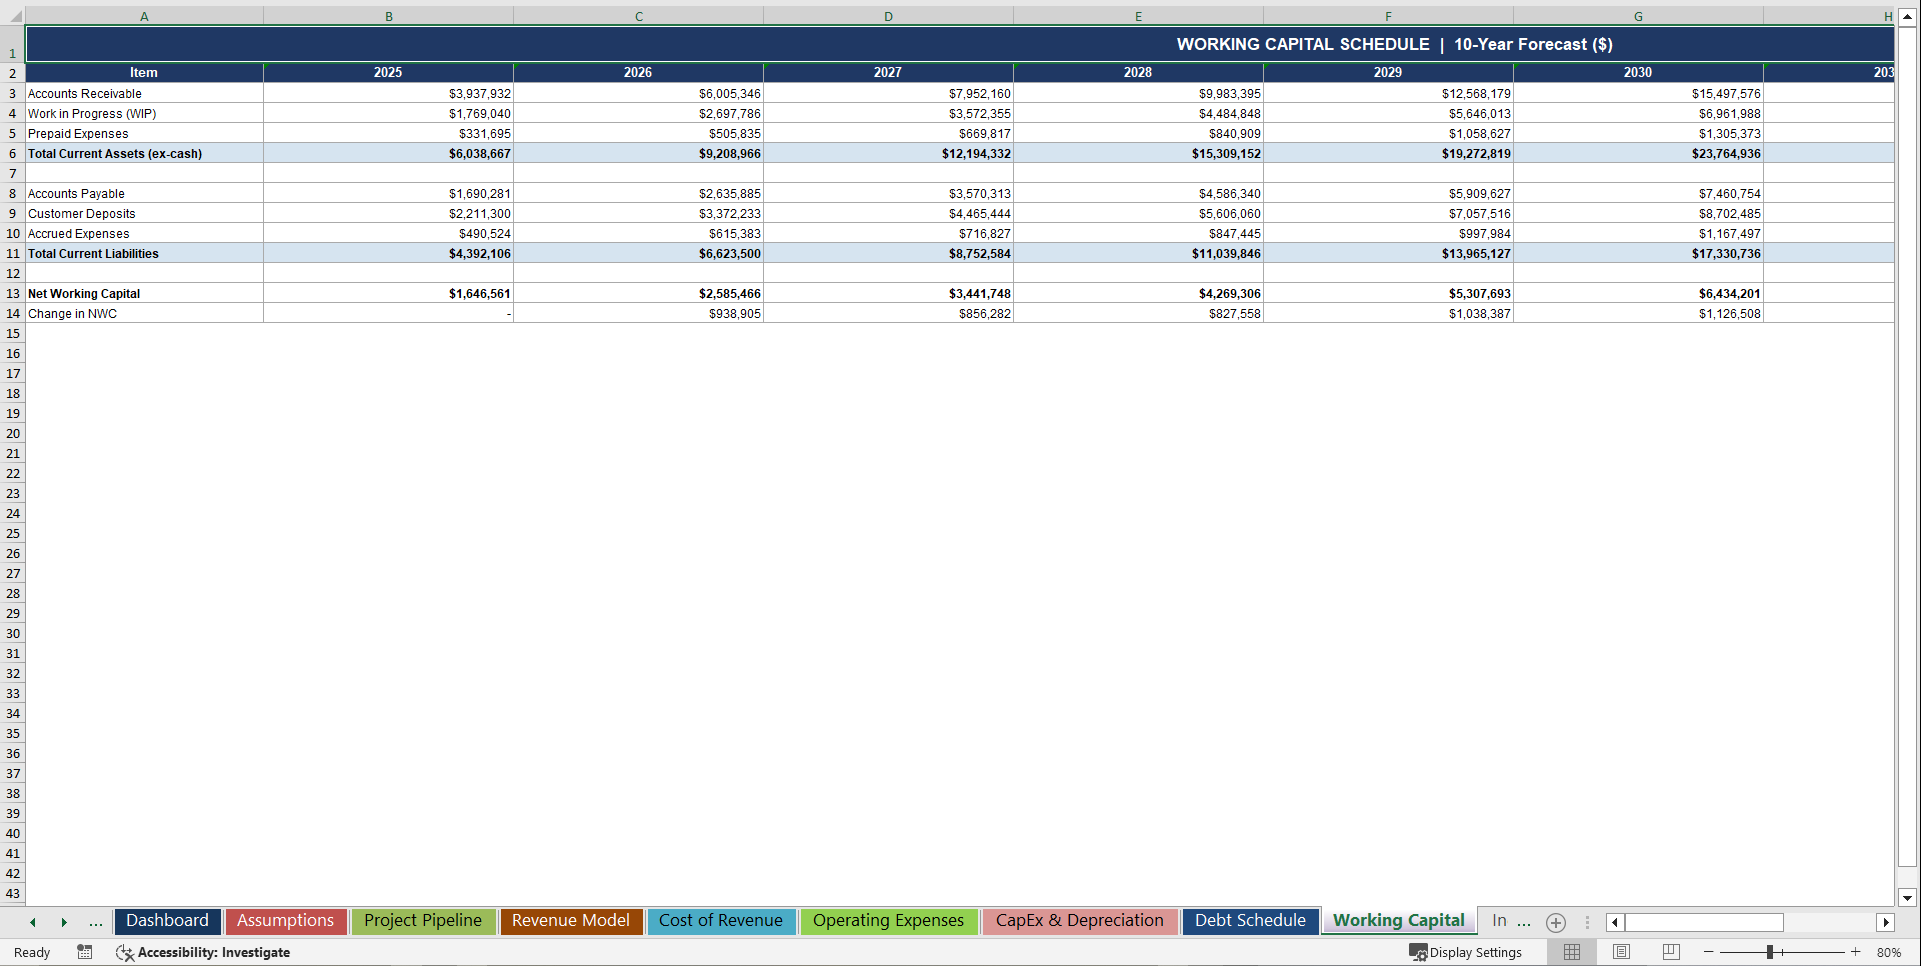
✅ Working Capital Schedule (Retention Receivables, Subcontractor Payables, Billing-in-Advance Float)
✅ Debt & Equity Schedule (Seed Capital, Equipment Financing, Bank Revolvers, Convertible Notes)
✅ Loan Amortization & Interest Expense Schedule
✅ Investor-Ready Income Statement (Revenue → Gross Profit → EBITDA → EBIT → Net Income)
✅ Cash Flow Statement – Indirect Method, Fully Linked
✅ Balance Sheet – Dynamically Balances to Zero Every Year
✅ Scenario & Sensitivity Analysis (4 Named Scenarios + Sensitivity Matrix)
✅ Executive Dashboard with 12 KPIs Across All 10 Years
✅ Blue-Coded Assumptions – Change One Cell, Entire Model Recalculates Instantly
This is not a generic contractor spreadsheet.
This is a complete construction financial planning system built for real-world project unit economics and institutional capital raising.
🎯 Who This Is For
• First-time general contracting founders
• Multi-division infrastructure and civil engineering operators
• Delivery-first construction entrepreneurs launching subcontractor management platforms
• Design-build firm operators and construction management consultants
• Infrastructure project finance teams and public-private partnership developers
• Franchise expansion teams entering new regional construction markets
• SBA, bonding agency, and bank financing applicants
• Series A & Series B fundraising teams in the construction and infrastructure vertical
• Private equity firms evaluating construction roll-ups and platform acquisitions
• Consultants building investor decks for capital-intensive construction clients
• Accelerators & incubators supporting next-generation built-environment startups
If you manage project pipelines, deliver built assets, or run contract-driven revenue businesses – this was built for you.
🔥 Why Most Construction Financial Models Fail
Most templates rely on:
• Simple "Revenue = Projects × Average Contract Value" with zero operational logic
• No project cohort ramp-up curve for new market entries
• No channel split between repeat clients, bid-won contracts, and direct-negotiated work
• No subcontractor dependency or affiliate concentration risk analysis built into margin
• No order-level bonus cost, bid preparation burn, or payment retention modeling
• No labor efficiency ratio tied to active projects per site supervisor
• No jurisdiction-level fixed cost vs. project contribution margin
• No backlog conversion rate or percentage-of-completion revenue recognition
• No PP&E rollforward or equipment depreciation schedule
• No working capital modeling for retention receivables and subcontractor payables
• No equity round or equipment financing integration
• No NOL carryforward tax protection in early loss years
• No multi-division or multi-jurisdiction expansion logic
This model fixes all of that – from the ground up.
📊 What's Inside – Every Major Component
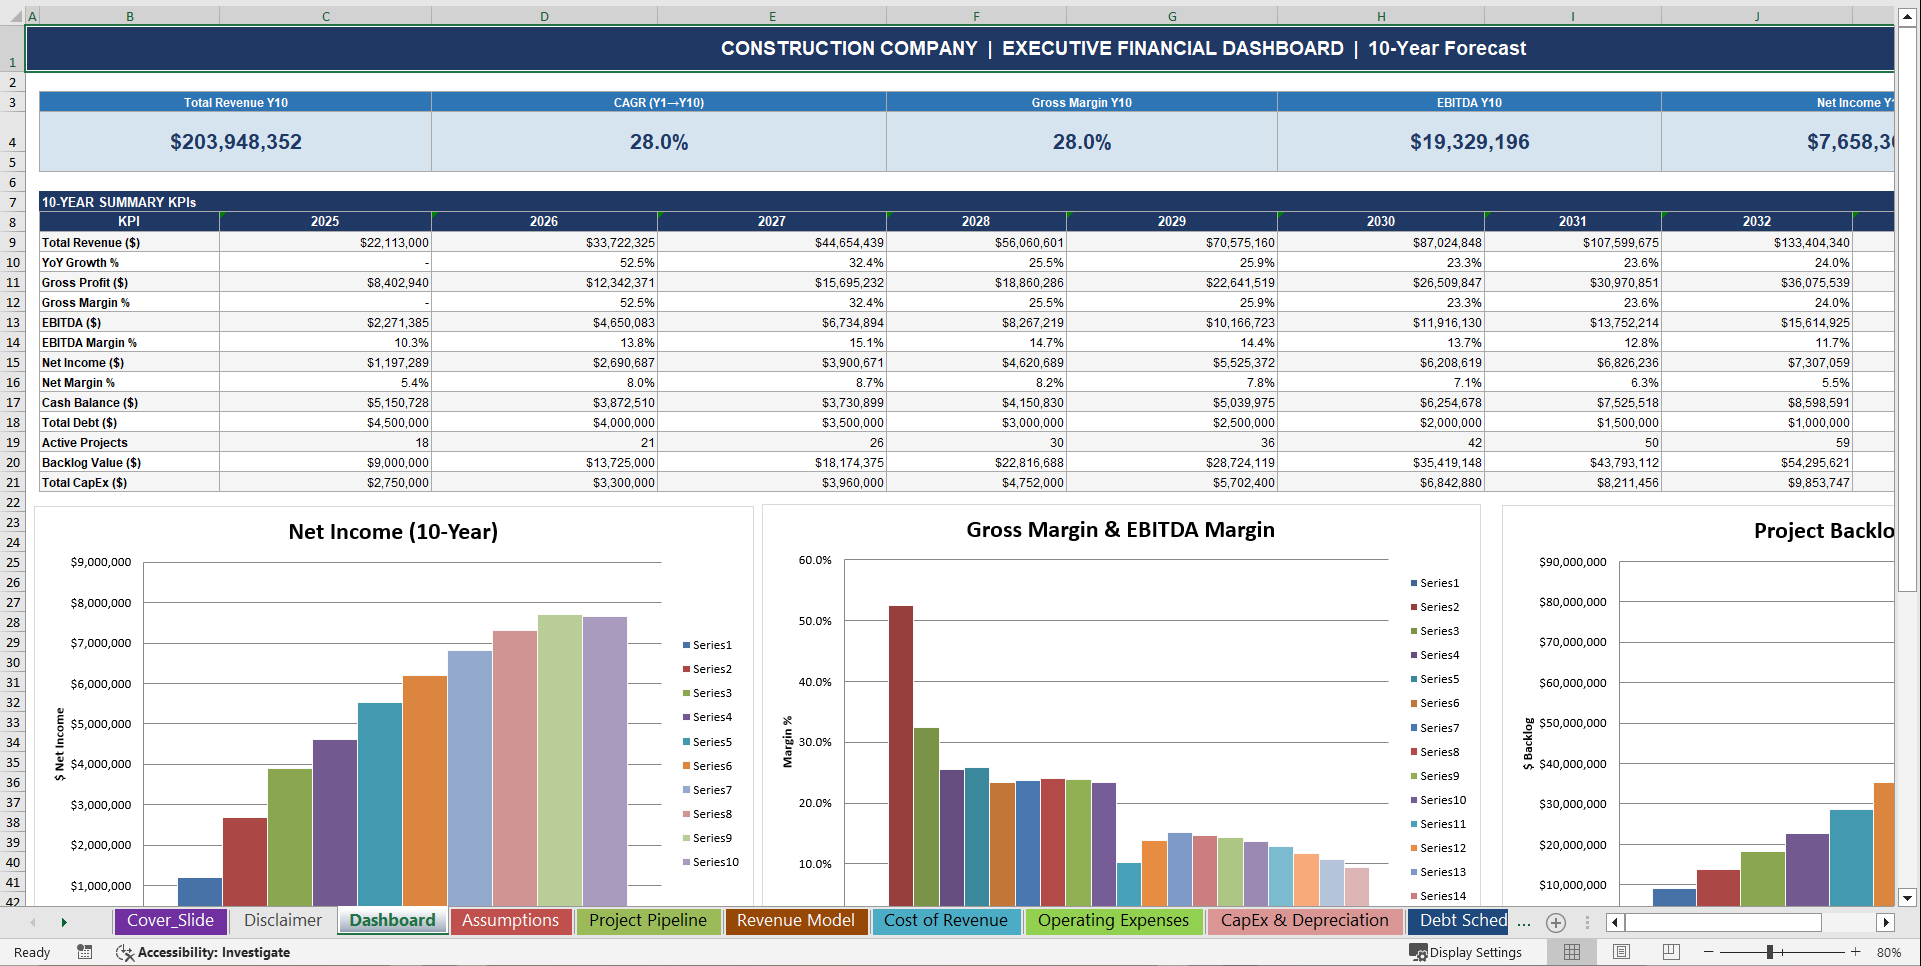
1️⃣ Executive Dashboard
Instant investor snapshot including:
• Total Revenue Scaling from Year 1 ($20M GGR) to Year 10 ($250M+ Contract Revenue)
• Gross Profit & Gross Margin % by Year
• EBITDA & EBITDA Margin % by Year
• Net Income & Net Margin % by Year
• Ending Cash Balance & Cash Runway
• Total Active Projects, Backlog Value & Average Contract Value
• Bonus Rate % replaced by: Material Cost Inflation %, Subcontractor Commission % & Blended Project Margin
• Revenue per Employee & CapEx vs. Revenue Ratio
• LTV, CAC, LTV/CAC Ratio & Client Retention Rate
• Equity Raised by Round
Built for pitch decks, bank meetings, bonding agency due diligence, licensing applications, and board presentations.
2️⃣ Assumptions Engine (Single Source of Truth)
Centralized input section controlling the entire model.
Includes:
• Project acquisition plan (new contracts won per year)
• Project ramp factor – backlog conversion curve in launch year
• Active project volume from churn-adjusted backlog
• Average bets per player per month replaced by: Average project stages per contract per year with annual scope growth
• Average bet size replaced by: Average contract value with annual escalation baked in
• Deposit frequency replaced by: Billing milestone frequency, average draw request size & retention release rate
• Revenue channel mix (Residential, Commercial, Industrial, Infrastructure, Government) per year
• Blended gross margin dynamically calculated from contract type mix weights
• Subcontractor commission rates by year (Fixed-Price, Cost-Plus & Hybrid blended)
• Direct payment processing fees replaced by: Direct payment retention rate as % of billings
• Bonus & promotional cost replaced by: Bid preparation burn & mobilization cost as % of revenue
• Game provider revenue share replaced by: Design & engineering fee share as % of contract value
• Fraud loss rate replaced by: Defect, rework & warranty cost rate as % of project costs
• Responsible gaming provisions replaced by: Safety compliance provisions as % of revenue
• Jackpot contribution replaced by: Equipment mobilization reserve as % of heavy equipment revenue
• Engineering, Compliance, Safety & Marketing headcount plan
• Benefits & payroll tax load on all compensation
• Marketing spend as % of revenue
• CapEx per equipment class, fleet vehicle procurement, site infrastructure & IT systems
• Technology & systems CapEx
• Replacement CapEx % of gross PP&E
• Depreciation & amortization useful life by asset class
• Retention receivable days, DPO, subcontractor payout lag & affiliate payout lag replaced by: subcontractor payment terms
• Equity raise amounts (Seed, Series A, Series B) and timing
• Debt facility draw and repayment schedule
• Interest rate, tax rate & NOL carryforward protection
Change one input – the entire 10-year model recalculates instantly.
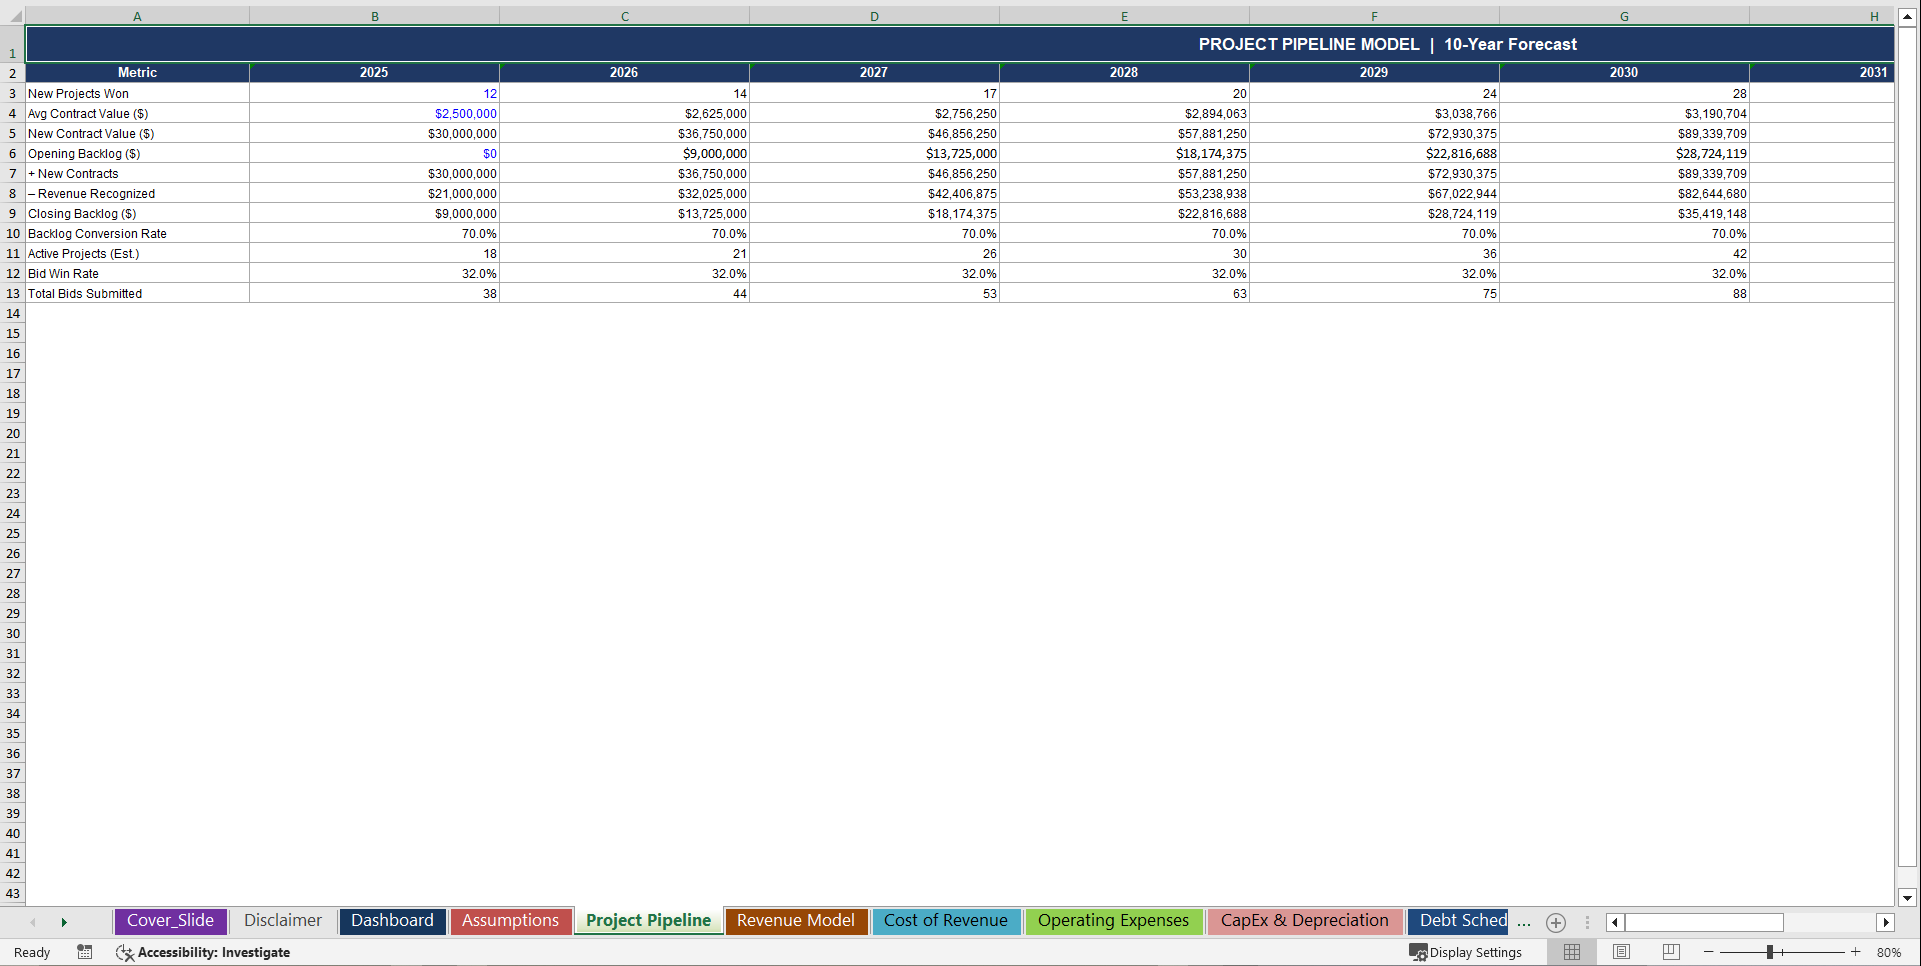
3️⃣ Project Pipeline & CapEx Budget
Structured for real construction scaling:
• New project acquisition costs per cohort
• Heavy equipment procurement costs
• Fleet vehicle and truck investment
• Site safety and compliance system CapEx
• Replacement & maintenance CapEx by year
• PP&E / fixed asset rollforward (opening, additions, depreciation, closing)
• Net book value of equipment and property year by year
• Expansion-driven compliance and engineering hiring triggers
Know exactly how much capital you need before signing your next construction contract or government tender.
4️⃣ Project & Revenue Engine (Built Like a Real Construction Company)
Model includes:
• Mature project backlog volume vs. new contract ramp curve
• Effective active project equivalent calculation
• Total annual contract turnover driving all COGS and labor
• Delivery platform revenue replaced by: Residential GGR, Commercial Revenue, Industrial Revenue, Infrastructure Revenue, Government Contract Revenue
• Direct app & website revenue replaced by: Direct-negotiated contract revenue net of retention
• Catering & B2B revenue replaced by: Design-build and maintenance contract licensing revenue
• Gross Revenue vs. Net Project Revenue reconciliation
• Retention, defect deduction & contract variation reconciliation
• Revenue mix shift toward direct client and repeat customer concentration over time
• Multi-division and multi-jurisdiction expansion logic
This allows you to stress-test project volume, contract pricing, division mix, and subcontractor dependency before committing capital.
5️⃣ Cost of Goods Sold (COGS) & Margin Tracking
Track real profitability at the project and contract level:
• Materials cost (% of revenue with inflation escalation)
• Subcontractor costs (fixed-price and cost-plus blended)
• Direct labor costs (% of revenue with wage inflation)
• Equipment and fuel (% of revenue)
• Project management costs (% of revenue)
• Safety and insurance provisions (% of revenue)
• Permits and compliance fees (% of revenue)
• Warranty, defect and rework costs (% of revenue)
See:
• Gross margin by cost component
• Blended gross margin % trending from 20% to 38%+
• Contribution margin (Revenue minus all variable project delivery costs)
• Contribution margin % trending toward institutional target range
• Project-level EBITDA and contract payback period
Stop guessing your unit economics. Know them cold.
6️⃣ Project Efficiency & Staffing Model
Engineering, compliance, and site management headcount is your largest controllable cost in construction.
This model includes:
• Active projects per site supervisor (efficiency ratio)
• Total site management headcount required from active project volume
• Project acquisition cost per cohort (CAC by year)
• Annual wage inflation assumptions across all teams
• Corporate team salaries by role (CEO, CFO, COO, Head of Safety & Compliance, Project Managers, Site Supervisors, Engineers, Sales Team)
• Benefits & payroll tax load on all compensation
• Expansion-triggered compliance and engineering hiring plan by year
• Labor cost as % of revenue by year
• Kitchen-level vs. corporate labor replaced by: Site-facing vs. corporate infrastructure labor split
Built for operational reality – not theoretical headcount planning.
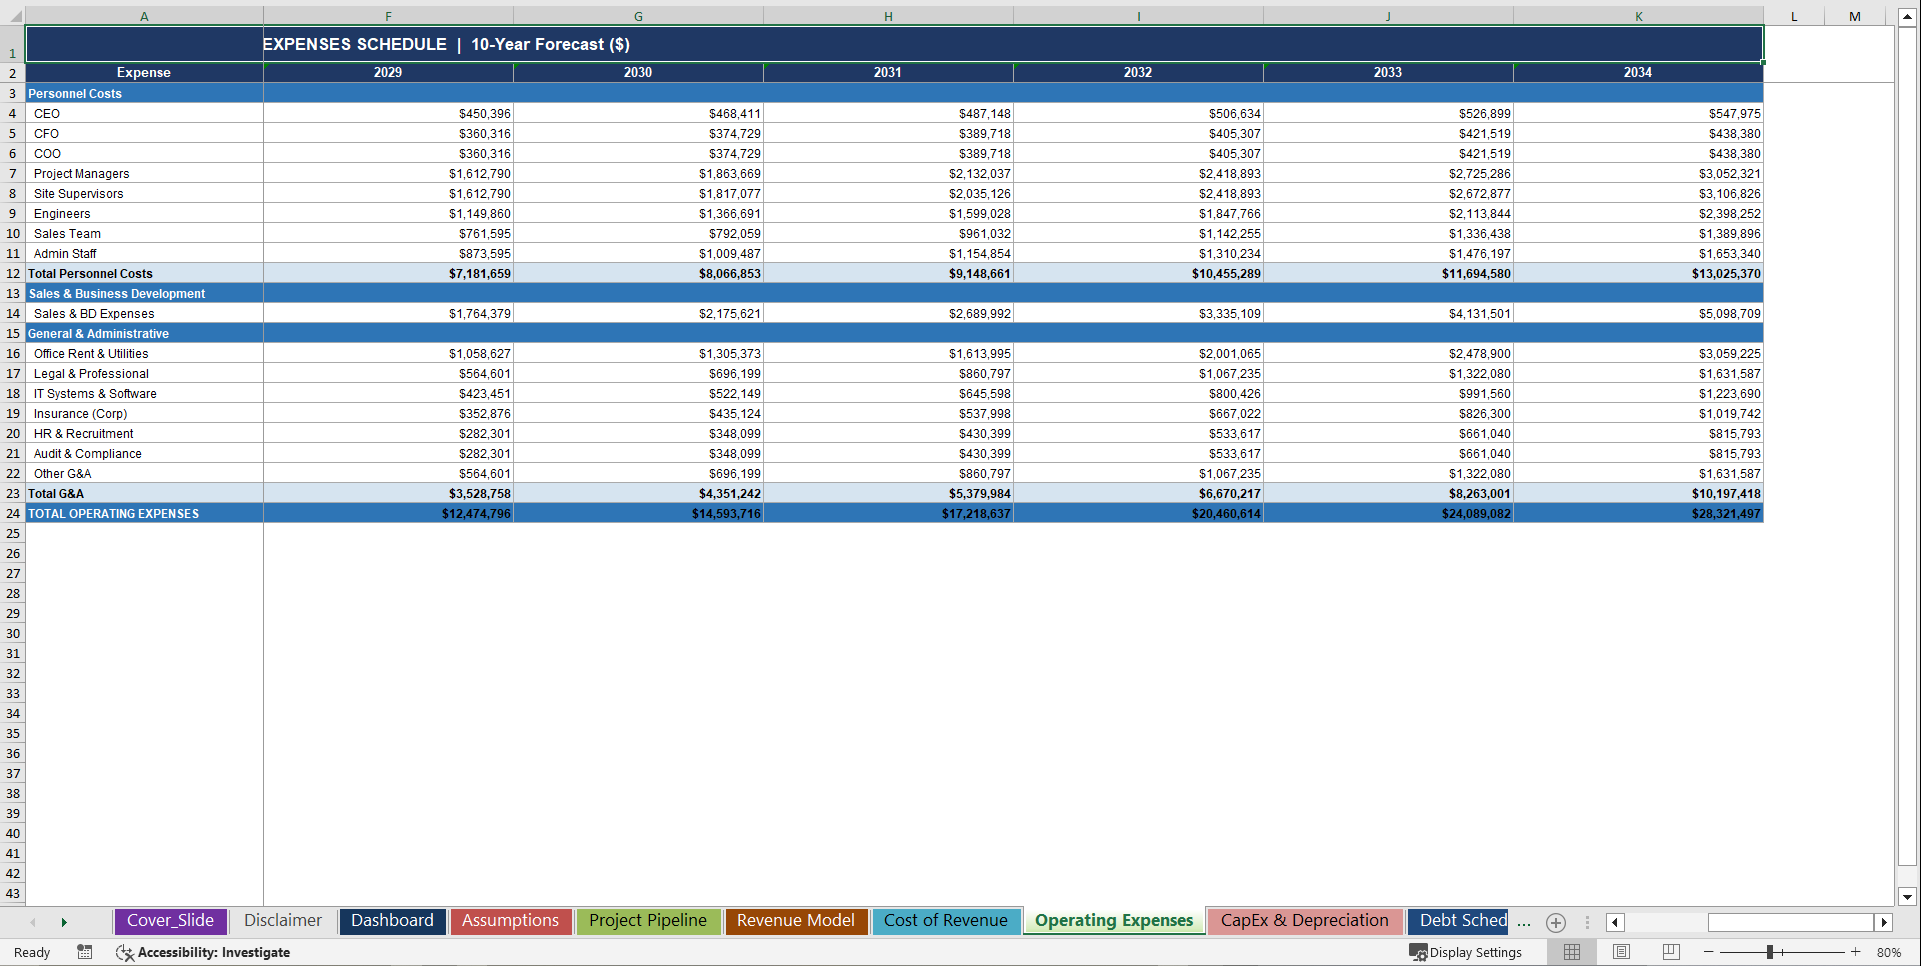
7️⃣ Jurisdiction-Level & Corporate Operating Expense Structure
Full overhead visibility – split exactly the way construction investors want to see it:
Jurisdiction-Level Fixed Costs:
• Contractor licensing fees per jurisdiction × total active licenses
• Fixed compliance and safety monitoring costs per jurisdiction
• Responsible construction and environmental system costs per jurisdiction
• Site office and redundancy costs per geography
Corporate Overhead:
• C-Suite compensation (CEO, CFO, COO)
• Engineering & platform team
• Compliance, legal & regulatory team
• Marketing, CRM & bid management team
• Finance, HR & G&A team
• Benefits & payroll taxes
• Marketing & project acquisition spend (% of revenue)
• Technology, software & data infrastructure subscriptions
Structured for real construction P&L presentation to institutional investors.
8️⃣ Debt & Equity Financing Schedule
Institutional-grade capital structure modeling:
• Seed round equity raise (Year 1)
• Series A equity raise (Year 2)
• Series B equity raise (Year 4)
• Equipment financing & revolving credit facility draw & timing
• Annual debt repayment schedule
• Interest expense on average debt balance
• Debt balance rollforward (opening → draws → repayments → closing)
• Cumulative equity raised tracking
• Current vs. long-term debt split on Balance Sheet
• Debt / EBITDA covenant monitoring
Perfect for bank term sheets, equipment finance facilities, bonding agency financial proof requirements, or private credit facilities.
9️⃣ Integrated 3-Statement Financials
✔ Income Statement – Revenue → Gross Profit → EBITDA → EBIT → EBT → Net Income (with NOL tax protection in early loss years)
✔ Cash Flow Statement – Indirect method, CFO + CFI + CFF, ending cash ties directly to Balance Sheet
✔ Balance Sheet – Current assets, retention receivables, net PP&E, subcontractor payables, accrued wages, customer deposits, debt tranches, paid-in capital, retained earnings
Everything connects.
Everything balances.
Everything updates automatically.
🔟 Scenario & Sensitivity Analysis
Instant visibility into your risk exposure across 4 named scenarios:
• Base Case – Current assumptions, moderate project pipeline growth
• High Growth Case – Project acquisition +25%, contract values +5%, accelerated market expansion
• Recession Case – Active projects -20%, contract values -5%, marketing spend halved
• Construction Boom Case – Material supply surge, bid win rate acceleration, government infrastructure wave
Plus conditional risk alert monitoring for:
• Cash runway falling below 6 months of operating burn
• Material cost inflation exceeding 20% of revenue (margin compression threshold)
• Subcontractor dependency above 80% of project delivery cost
• LTV/CAC ratio falling below 3x (unit economics collapse warning)
• EBITDA margin turning negative beyond Year 5
• Project delay rate exceeding monthly target threshold
• Debt / EBITDA covenant breach
Know your risk before you sign the contract, accept the term sheet, or mobilize to site.
💎 Why This Construction Model Is Different
✔ Built specifically for general contractors and infrastructure developers – not generic SaaS or restaurant templates
✔ Project-level revenue logic driven by backlog conversion, billing behavior, and contract mix
✔ Subcontractor cost and platform fee deductions built directly into revenue and COGS
✔ LTV/CAC ratio modeling with cohort-level retention curves – not generic headcount guessing
✔ Jurisdiction-level fixed cost vs. corporate overhead – split the way PE firms want to see it
✔ Fully integrated equity rounds and equipment financing schedule
✔ 10-year forecast with startup-to-scale operating leverage from $20M to $250M revenue
✔ NOL carryforward tax protection in early high-spend project acquisition years
✔ Working capital modeling for retention receivables and subcontractor payables
✔ Institutional-level structure for Series A, Series B, and beyond
This is how serious construction operators plan for scale.
🧠 Built for Real Profitability Decisions
This model allows you to:
• Raise Series A and Series B capital with institutional-grade construction projections
• Secure contractor licenses and bonding with financial proof packages banks actually accept
• Negotiate better subcontractor terms with data-backed margin analysis
• Optimize game mix pricing replaced by: contract type mix, retention strategy, and VIP client tier strategy
• Control subcontractor commission exposure and platform dependency concentration
• Manage project churn, bid burn, and safety compliance provision costs
• Forecast cash runway and time-to-profitability with project-cohort precision
• Evaluate new jurisdiction expansion ROI before committing licensing CapEx
• Model multi-division and multi-contract vertical unit economics separately
• Stress-test subcontractor risk before your next framework agreement renewal
Instead of hoping your construction company makes money – you know exactly when and how it will.
🚨 The Cost of Not Having This
Without a proper construction financial model, you risk:
• Running out of cash between equity rounds during peak project mobilization spend
• Underpricing your bid strategy and destroying contribution margin
• Overstaffing site teams before project volume justifies the overhead
• Underestimating subcontractor commission drag on net project revenue
• Getting rejected by banks, bonding agencies, and equipment lenders
• Signing the wrong subcontractor revenue share agreement with no margin for error
• Expanding into new jurisdictions too fast without project-level profitability
• Losing institutional investors because your model had no operational construction logic
• Burning through runway in the first 18 months of mobilization
One properly scaled construction platform can generate category-defining, license-protected, barrier-to-entry returns.
But only if you plan the project unit economics correctly from Day 1.
⚡ Stop Guessing. Start Modeling Like an Institutional Construction Operator.
If you are serious about:
• Launching a profitable general contracting firm or infrastructure developer
• Scaling a multi-division construction platform across regulated jurisdictions
• Raising venture capital or equipment financing in the construction vertical
• Securing SBA loans, bank facilities, or contractor bonding approvals
• Maximizing project-level contribution margins and LTV/CAC ratios
• Surviving subcontractor cost compression and regulatory fee increases
• Building a delivery-first construction brand at institutional scale
• Preparing for a Series B, strategic acquisition, or public market readiness
This model is your unfair advantage.
👉 Download the Construction Company Financial Model today – and launch, fund, and scale your construction empire with the numbers to back it up.
Key Words:
Strategy & Transformation, Growth Strategy, Strategic Planning, Strategy Frameworks, Innovation Management, Pricing Strategy, Core Competencies, Strategy Development, Business Transformation, Marketing Plan Development, Product Strategy, Breakout Strategy, Competitive Advantage, Mission, Vision, Values, Strategy Deployment & Execution, Innovation, Vision Statement, Core Competencies Analysis, Corporate Strategy, Product Launch Strategy, BMI, Blue Ocean Strategy, Breakthrough Strategy, Business Model Innovation, Business Strategy Example, Corporate Transformation, Critical Success Factors, Customer Segmentation, Customer Value Proposition, Distinctive Capabilities, Enterprise Performance Management, KPI, Key Performance Indicators, Market Analysis, Market Entry Example, Market Entry Plan, Market Intelligence, Market Research, Market Segmentation, Market Sizing, Marketing, Michael Porter's Value Chain, Organizational Transformation, Performance Management, Performance Measurement, Platform Strategy, Product Go-to-Market Strategy, Reorganization, Restructuring, SWOT, SWOT Analysis, Service 4.0, Service Strategy, Service Transformation, Strategic Analysis, Strategic Plan Example, Strategy Deployment, Strategy Execution, Strategy Frameworks Compilation, Strategy Methodologies, Strategy Report Example, Value Chain, Value Chain Analysis, Value Innovation, Value Proposition, Vision Statement, Corporate Strategy, Business Development, Business plan pdf, business plan, PDF, Business Plan DOC, Business Plan Template, PPT, Market strategy playbook, strategic market planning, competitive analysis tools, market segmentation frameworks, growth strategy templates, product positioning strategy, market execution toolkit, strategic alignment playbook, KPI and OKR frameworks, business growth strategy guide, cross-functional strategy templates, market risk management, market strategy PowerPoint doc, guide, ebook, e-book ,McKinsey Change Playbook, Organizational change management toolkit, Change management frameworks 2025, Influence model for change, Change leadership strategies, Behavioral change in organizations, Change management PowerPoint templates, Transformational leadership in change, supply chain KPIs, supply chain KPI toolkit, supply chain PowerPoint template, logistics KPIs, procurement KPIs, inventory management KPIs, supply chain performance metrics, manufacturing KPIs, supply chain dashboard, supply chain strategy KPIs, reverse logistics KPIs, sustainability KPIs in supply chain, financial supply chain KPIs, warehouse KPIs, digital supply chain KPIs, 1200 KPIs, supply chain scorecard, KPI examples, supply chain templates, Corporate Finance SOPs, Finance SOP Excel Template, CFO Toolkit, Finance Department Procedures, Financial Planning SOPs, Treasury SOPs, Accounts Payable SOPs, Accounts Receivable SOPs, General Ledger SOPs, Accounting Policies Template, Internal Controls SOPs, Finance Process Standardization, Finance Operating Procedures, Finance Department Excel Template, FP&A Process Documentation, Corporate Finance Template, Finance SOP Toolkit, CFO Process Templates, Accounting SOP Package, Tax Compliance SOPs, Financial Risk Management Procedures.
NOTE: Our digital products are sold on an "as is" basis, making returns and refunds unavailable post-download. Please preview and inquire before purchasing. Please contact us before purchasing if you have any questions! This policy aligns with the standard Flevy Terms of Usage.
Got a question about the product? Email us at support@flevy.com or ask the author directly by using the "Ask the Author a Question" form. If you cannot view the preview above this document description, go here to view the large preview instead.
Source: Best Practices in Construction, Integrated Financial Model Excel: Construction Company 10-Year 3 Statement Financial Model Excel (XLSX) Spreadsheet, SB Consulting
ABOUT THE AUTHOR
SB Consulting is dedicated to empowering businesses to communicate their ideas with impact. This consulting firm specializes in teaching organizations how to create effective corporate and management presentations. With training from top-tier global consulting firms, including McKinsey, BCG, and Porsche Consulting, extensive expertise in presentation design and ... [read more]
Ask the Author a Question
You must be logged in to contact the author.
