
FOOD & BEVERAGE INDUSTRY EXCEL DESCRIPTION
In today's competitive catering industry, accurate financial planning is essential to ensure business growth, stability, and profitability. The Catering Service Excel Financial Model is a comprehensive tool designed to help catering business owners understand and manage their finances effectively. This model is highly adaptable and user-friendly, enabling business owners to make informed decisions based on real-time data, track performance, and make adjustments as necessary. Whether you're in the early stages of a catering startup or looking to optimize an established catering company, this model offers valuable insights into revenue, costs, and long-term projections.
Key Components
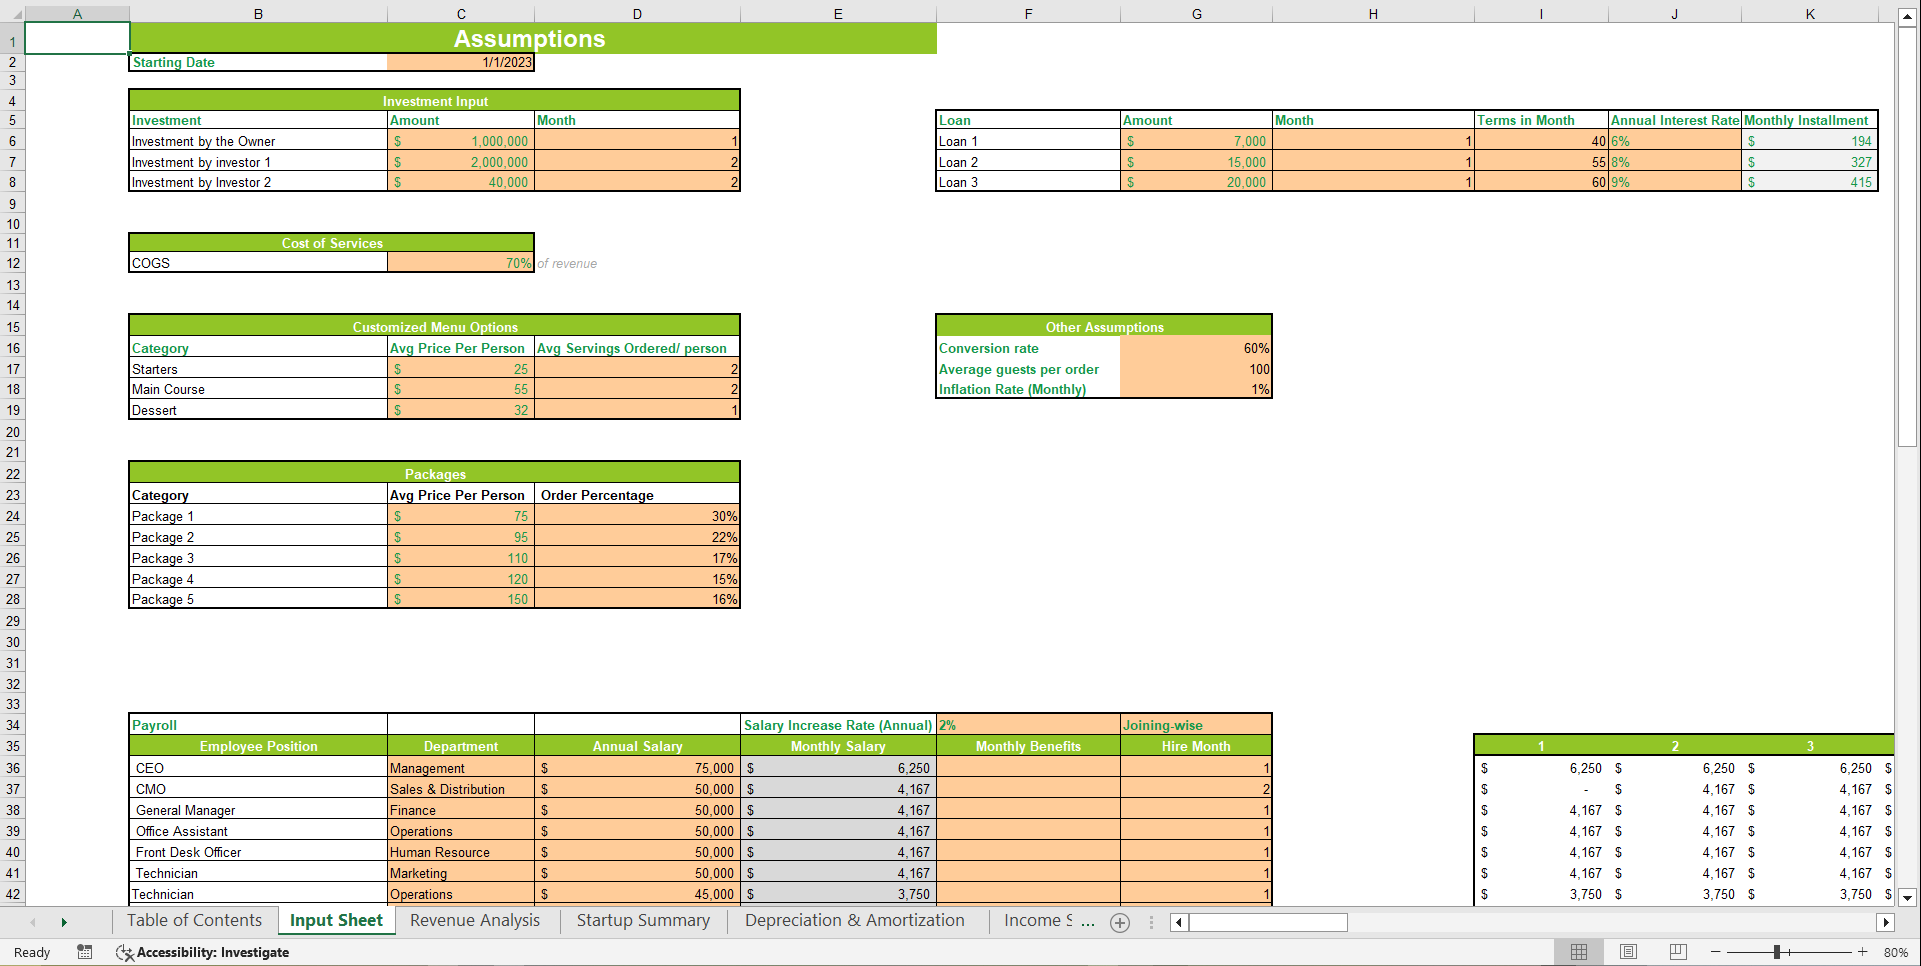
Input Sheet
The Input Sheet is the foundation of the financial model, providing the core assumptions and inputs needed to drive the calculations throughout the model.
1. Startup Costs: This section includes detailed assumptions about initial investments, including equipment, capital expenditure, and upfront investment costs.
2. Revenue Assumptions: Projected income from various revenue streams like catering for corporate events, buffet catering, and other services.
3. Cost Assumptions: Captures fixed costs (e.g., rent, salaries), variable costs (e.g., food, supplies), and the cost of capital, ensuring a comprehensive view of all business expenses.
4. Financing Inputs: Includes the amount of owner investment and any bank loans, with associated interest rates and terms.
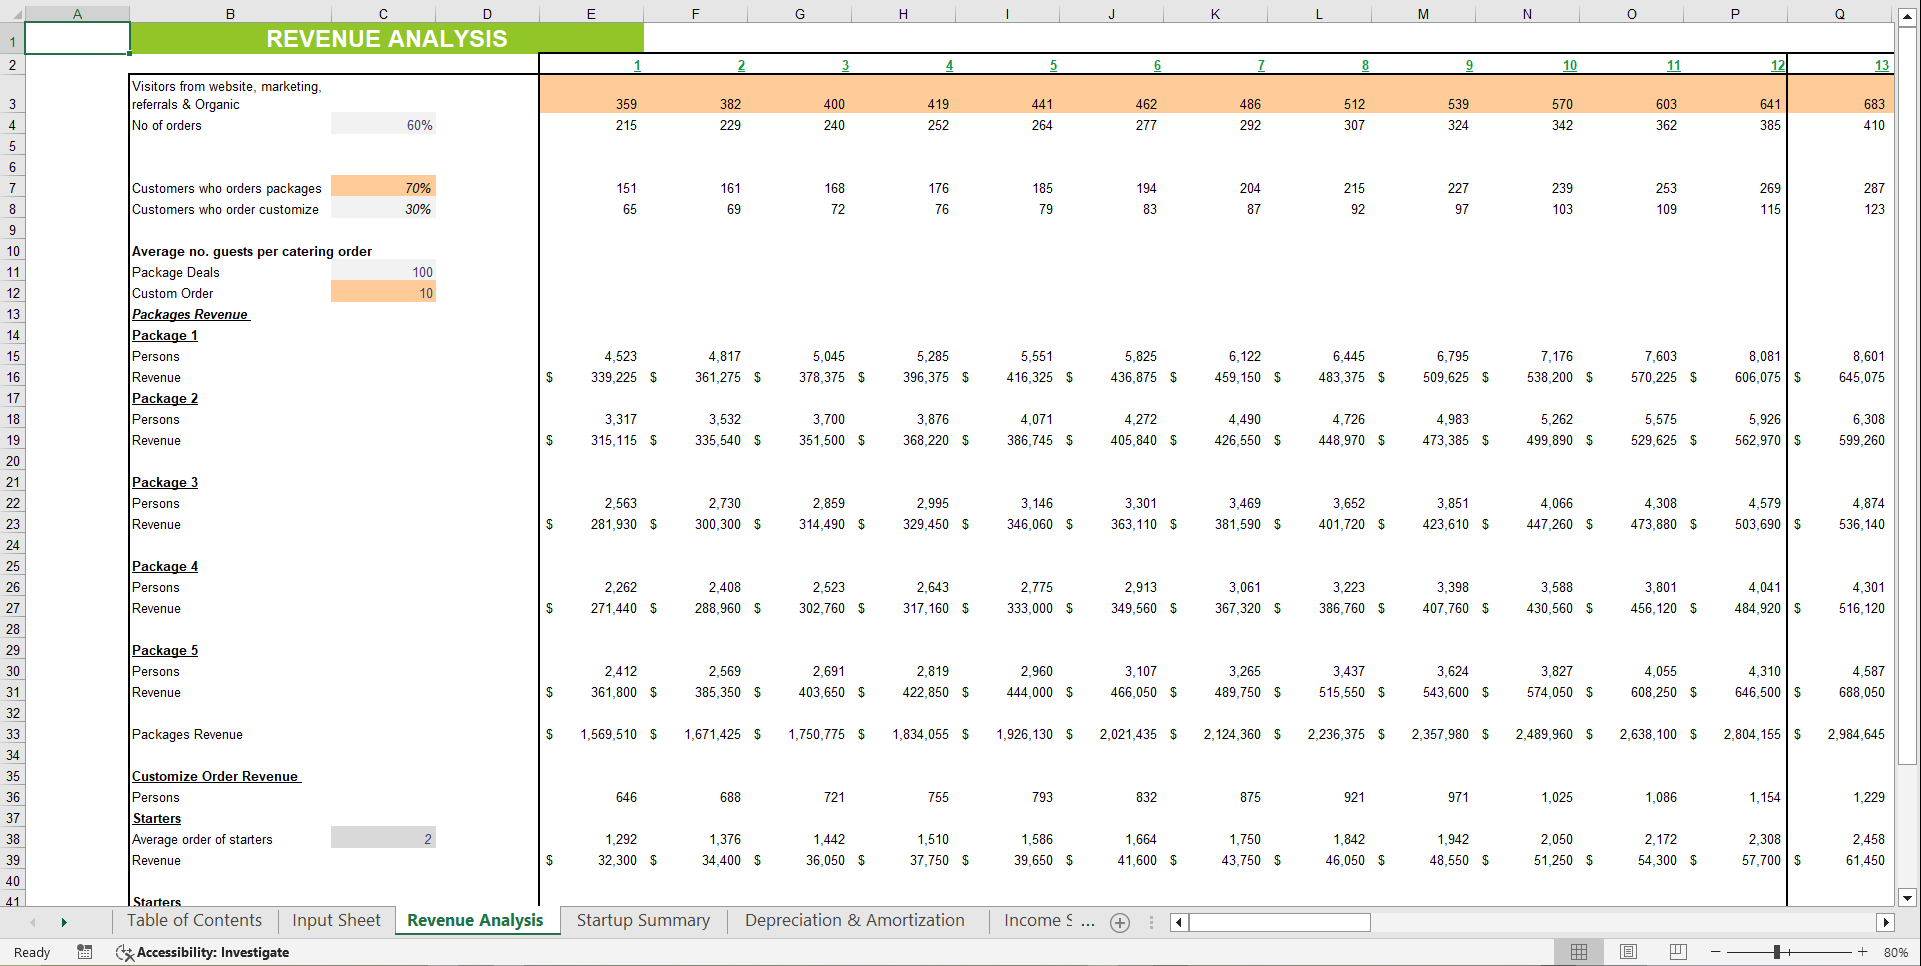
Revenue Analysis
The Revenue Analysis section provides a breakdown of expected revenue across different catering services. It includes the following:
1. Revenue Streams: The model accounts for various types of catering services, such as corporate events, weddings, private parties, and buffet catering.
2. Revenue Projections: The model projects monthly revenue based on assumptions around the number of events, pricing per event, and expected growth rates.
3. Price Adjustments: Reflects anticipated changes in pricing over the years based on inflation, market demand, and cost increases.
Startup Summary
This section outlines the startup costs, capital expenditures, and financial assumptions that are critical for a catering service startup.
1. Initial Capital Investment: Detailed breakdown of the initial capital required to launch the catering business.
2. Startup Expenses: Covers essential costs such as kitchen equipment, initial inventory, licenses, and permits.
3. Financing Needs: Based on the capital expenditure and other startup expenses, this section estimates the necessary funding to start operations.
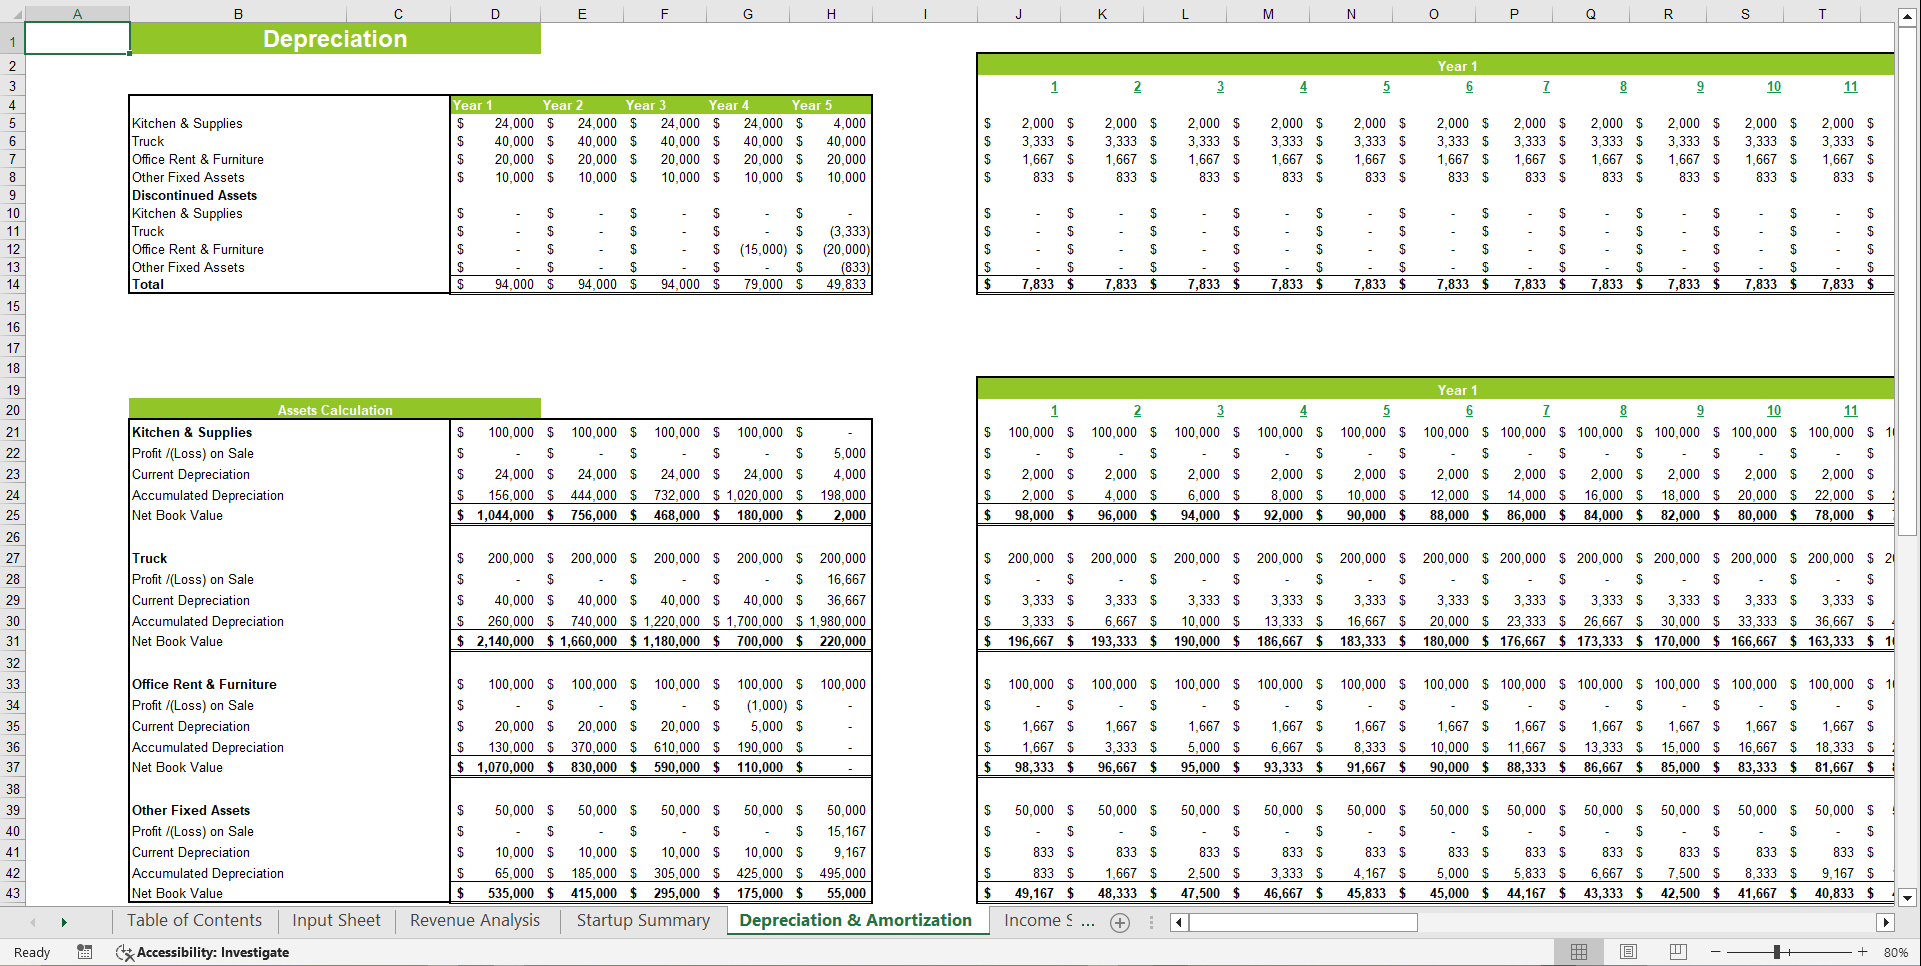
Depreciation and Amortization Schedule
This sheet tracks the depreciation of physical assets and amortization of intangible assets over time.
1. Asset Depreciation: Depreciation schedules for assets like kitchen equipment, vehicles, and office furniture.
2. Amortization of Intangible Assets: Includes amortization for assets like licenses or patents that lose value over time.
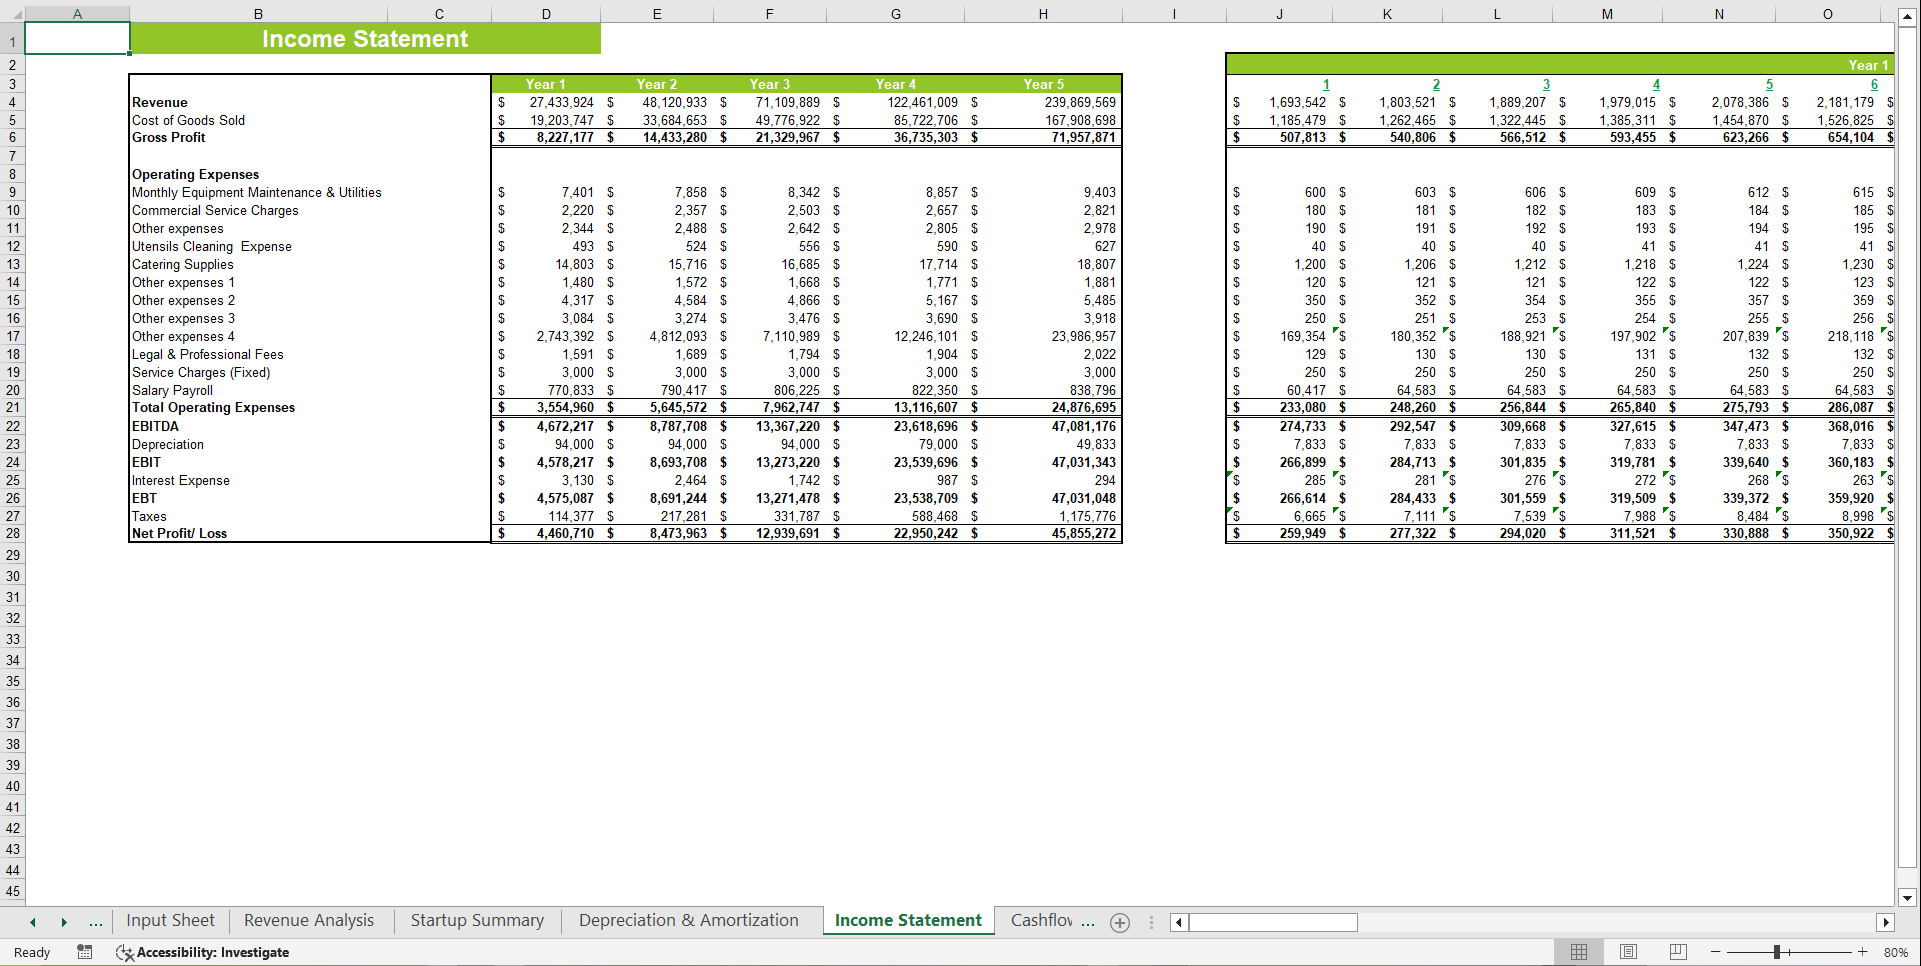
Income Statement
The Income Statement is crucial for understanding the catering service's profitability over time.
1. Revenue: Includes projected earnings from catering services.
2. Cost of Goods Sold (COGS): Reflects the direct costs involved in providing catering services, such as food costs and staff wages.
3. Gross Profit: The difference between revenue and COGS, providing insight into the efficiency of the business.
4. Operating Expenses: Includes administrative costs, marketing, and rent.
5. Net Profit: The final bottom line after all expenses have been deducted.
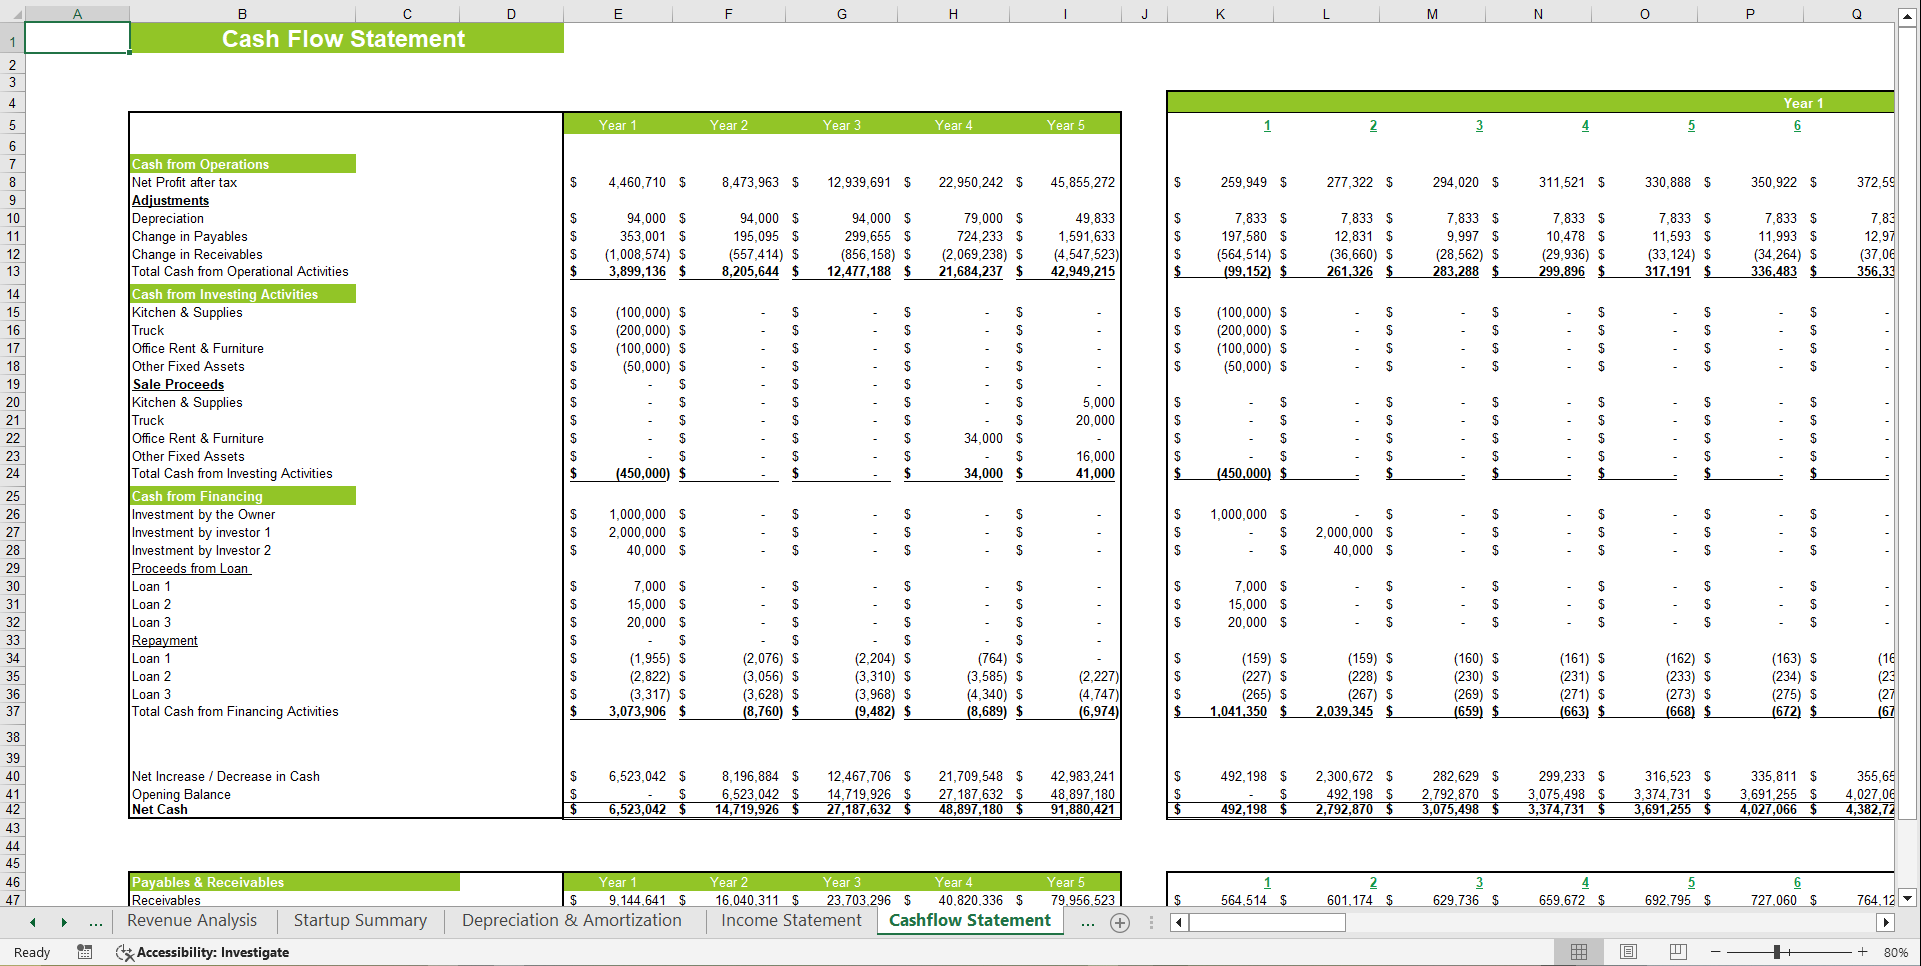
Cashflow Statement
The Cashflow Statement helps track the liquidity of the catering service by providing insights into the inflows and outflows of cash.
1. Operational Cash Flow: Tracks cash generated from day-to-day operations, including receipts from customers and payments for operational costs.
2. Investing and Financing Activities: Includes cash flows from investments (e.g., purchases of new equipment) and financing (e.g., loans and interest payments).
3. Net Change in Cash: Tracks the overall change in cash over time, ensuring the business maintains sufficient liquidity.
Balance Sheet
The Balance Sheet provides a snapshot of the catering business's financial position at any given time.
1. Assets: Includes current assets like cash and accounts receivables, as well as fixed assets like equipment and property.
2. Liabilities: Reflects both short-term liabilities (e.g., accounts payable) and long-term liabilities (e.g., bank loans).
3. Equity: Shows the owner's equity in the business, representing the difference between assets and liabilities.
Break Even Analysis
The Break Even Analysis sheet helps determine the sales volume needed to cover costs and start generating profit.
1. Fixed Costs: Costs that remain constant regardless of the number of events, such as rent and administrative salaries.
2. Variable Costs: Costs that vary based on the number of events or meals served, such as food costs and labor.
3. Break Even Point: Identifies the sales level at which total revenue equals total costs, ensuring no loss.
Project Evaluation
This section helps assess the feasibility of the catering business by providing:
1. Projected Profits: Based on revenue and cost assumptions.
2. Return on Investment (ROI): Measures the profitability relative to the initial investment.
3. Cash Flow Projections: Projects cash inflows and outflows to ensure sufficient liquidity for ongoing operations.
Sensitivity Analysis
The Sensitivity Analysis tests how different variables impact the financial outcomes.
1. Variable Sensitivity: Examines how changes in costs (e.g., food costs) or revenue assumptions (e.g., sales volume) affect profitability.
2. Risk Assessment: Helps identify potential risks to business performance and profitability.
KPIs and Financial Ratios
Key Performance Indicators (KPIs) and financial ratios help track the business's performance.
1. Accounts Receivables Turnover Ratio: Measures how efficiently the business collects payments from clients.
2. Gross Margin: Indicates the percentage of revenue remaining after the cost of goods sold.
3. Profitability Ratios: Provides insight into the company's ability to generate profits relative to revenue.
Dashboard
The Dashboard consolidates key financial metrics in a user-friendly visualization tool, providing at-a-glance insights into the business's financial health.
1. Financial Performance Visualization: Displays key metrics like revenue, costs, profits, and cash flows.
2. Decision-Making Support: Helps business owners track critical numbers and make data-driven decisions.
FAQ's
What is the purpose of the Catering Service Excel Financial Model?
The model provides a comprehensive tool for catering business owners to make informed decisions. It includes financial projections, tracks cost budgets, and helps forecast revenue streams to ensure the business remains profitable and financially healthy.
How can I use the Input Sheet effectively?
The Input Sheet is where you enter initial assumptions about your business. It includes startup costs, revenue projections, and financing details. Accurate entries here will ensure that your financial projections and cash flow statements are accurate, reflecting your business's true financial position.
What is the significance of Break Even Analysis in the model?
The Break Even Analysis helps identify the minimum sales volume needed to cover all fixed and variable costs. This is crucial for setting revenue targets and understanding the risk level of the business, especially in the early stages of operation.
How can I interpret the Cash Flow Statement?
The Cash Flow Statement tracks all the cash movements within the business. By analyzing it, you can monitor liquidity, ensuring you have enough cash to cover operational costs, and identify when the business might need additional financing.
What is the role of Sensitivity Analysis in financial planning?
Sensitivity Analysis allows you to test various scenarios (e.g., changes in food costs or sales volume) to see how these factors impact overall profitability. This is crucial for understanding the risks and uncertainties in your business model, helping you make more informed financial decisions.
Got a question about the product? Email us at support@flevy.com or ask the author directly by using the "Ask the Author a Question" form. If you cannot view the preview above this document description, go here to view the large preview instead.
Source: Best Practices in Food & Beverage Industry, Restaurant Industry, Integrated Financial Model Excel: Catering Service Financial Model Template Excel (XLSX) Spreadsheet, Oak Business Consultant
