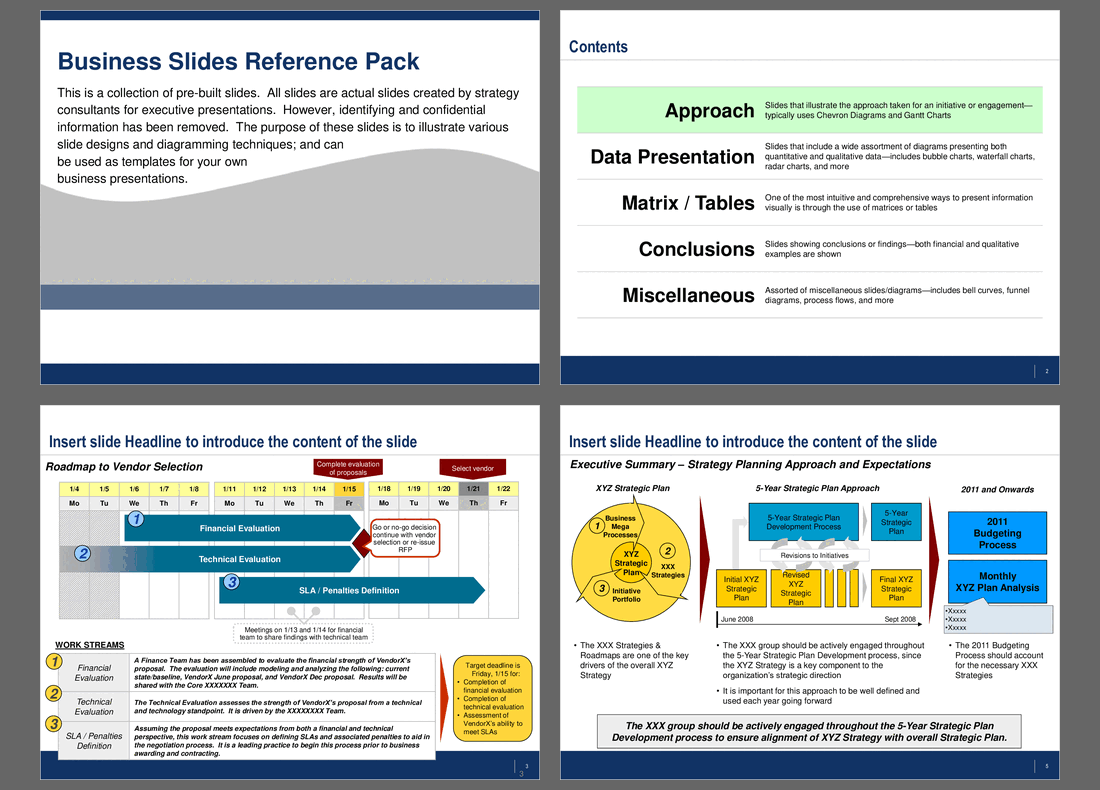
Business Slides Reference Pack – PowerPoint PPT Template
PowerPoint (PPT) 67 Slides
$39.00
These PowerPoint slides were compiled by former McKinsey, BCG, Deloitte, EY, & Capgemini consultants taken from real-world consulting engagements. All slides are fully cleansed.
Elevate your presentations with this Business Slides Reference Pack, crafted by ex-McKinsey, BCG, and Deloitte consultants. Ideal for strategic discussions. Business Slides Reference Pack is a 67-slide PPT PowerPoint presentation template (PPT) available for immediate download upon purchase.
This is a collection of pre-built PowerPoint slides. All slides are actual slides created by strategy consultants for client executive presentations. However, identifying and confidential information has been removed.
The purpose of these PPT slides is to illustrate various slide designs and diagramming techniques; and can be used as templates for your own business presentations.
The Business Slides Reference Pack offers a comprehensive toolkit for executives looking to elevate their presentation game. The slides cover a wide range of strategic and operational topics, providing a robust foundation for any business discussion. Each slide is meticulously crafted to ensure clarity and impact, making it an invaluable resource for high-stakes meetings and presentations.
The pack includes detailed process flows, such as the "Craft, Map, Measure" framework, which guides users through strategic initiative identification and evaluation. This structured approach ensures that all critical aspects are considered, from initial data analysis to final implementation. The slides also feature various fast-track scenarios, allowing for quick decision-making and efficient project execution.
In addition to process flows, the pack includes detailed timelines and milestone charts, such as those outlining subscriber growth and promotional strategies. These visual aids are designed to help executives communicate complex information succinctly and effectively. The inclusion of real-world examples and case studies adds practical value, demonstrating how these templates can be adapted to specific business needs.
The slides also delve into specialized topics like pricing models, sales process flows, and market analysis. Each section is designed to provide actionable insights and facilitate informed decision-making. Whether you're preparing for a board meeting, a client pitch, or an internal strategy session, this reference pack equips you with the tools you need to deliver compelling and persuasive presentations.
Got a question about the product? Email us at support@flevy.com or ask the author directly by using the "Ask the Author a Question" form. If you cannot view the preview above this document description, go here to view the large preview instead.
This PPT slide template outlines a structured vendor selection process with a timeline from January 4 to January 22. Key work streams include Financial Evaluation, where a finance team analyzes VendorX's proposals for financial robustness, and Technical Evaluation, assessing the technical merits of VendorX's offerings. Critical decision points are highlighted, particularly around January 15, when a go/no-go decision will determine whether to proceed with vendor selection or reissue the request for proposals (RFP). Defining service level agreements (SLAs) and penalties is essential for managing vendor performance. Meetings on January 13 and 14 will facilitate collaboration between financial and technical teams to ensure comprehensive evaluation of proposals.
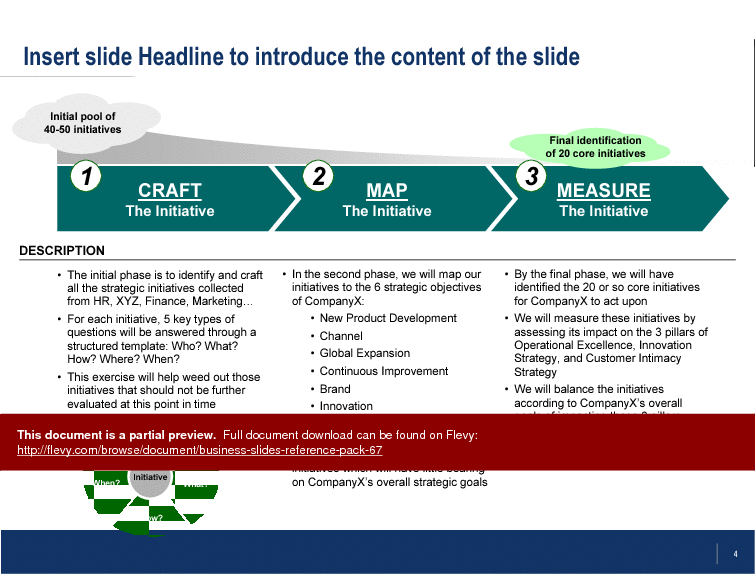
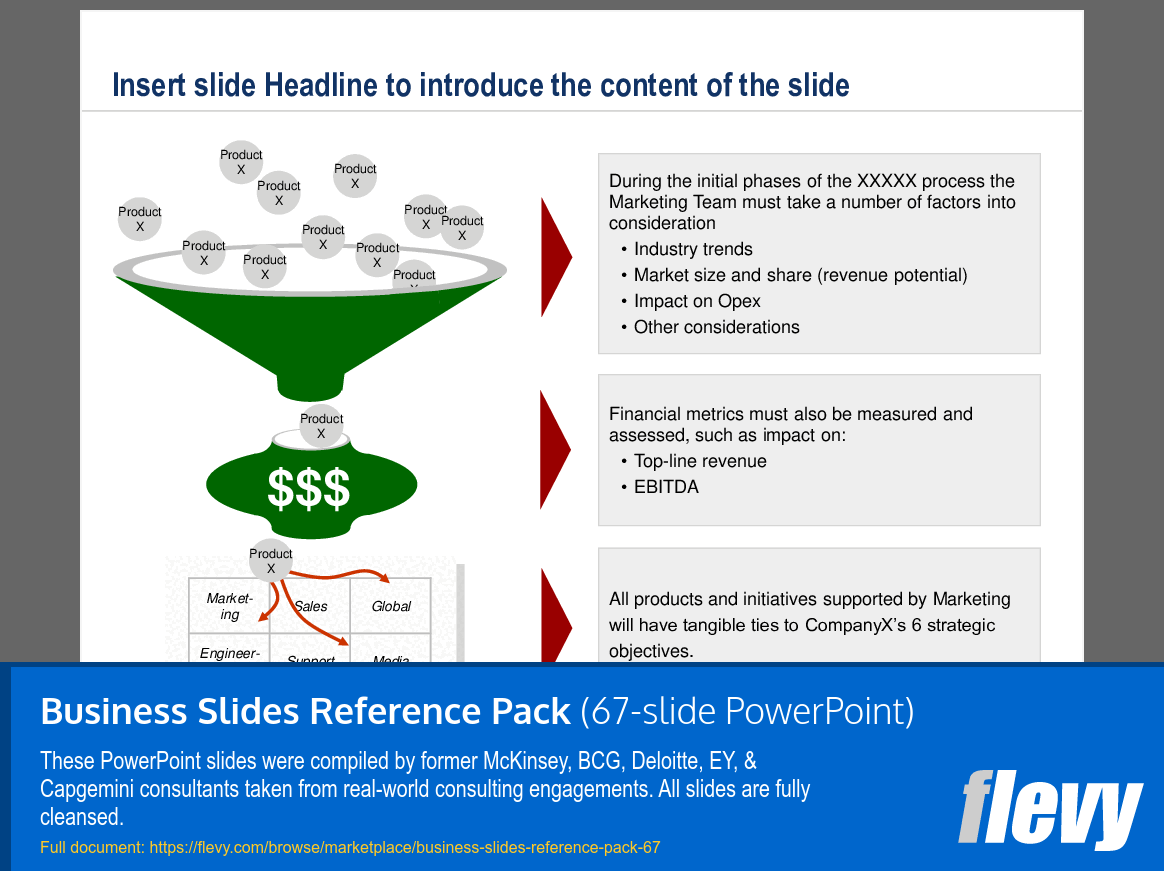
This PPT slide template outlines critical considerations for the Marketing Team during early-stage decision-making. Key focus areas include industry trends, market size and share, operational expenditure implications, and financial metrics such as top-line revenue and EBITDA, essential for assessing financial health and profitability. A funnel visual represents the systematic filtering of products or initiatives, emphasizing that not all options will progress, with a dollar sign indicating that financial outcomes are paramount. All initiatives must align with CompanyX’s 6 strategic objectives to ensure marketing efforts support the overall mission and vision. This comprehensive approach integrates qualitative and quantitative factors, driving informed decision-making and strategic alignment.
This PPT slide template presents a framework for pricing strategies aligned with the product lifecycle, categorizing the market into Early Adopters, Chasm, Early Majority, Late Majority, and Laggards. Early Adopters are less price-sensitive, driven by specific needs in niche markets (e.g., COXX and MetXX), and represent a small segment. The critical transition across the Chasm requires a shift in pricing strategy to attract the Early Majority, who prioritize safety and efficiency and are more price-sensitive. The Late Majority exhibits conservative buying behavior, investing only in well-established products and often choosing “me-too” options. Laggards are the last adopters, resistant to change and motivated by necessity. Developing a pricing strategy that captures early adopters and transitions to the majority market is essential for sustaining revenue growth and maintaining a premium market position.
This PPT slide template analyzes retail product categories and theft prevention strategies using a two-dimensional matrix. The vertical axis represents anticipated sales increase per unit, while the horizontal axis shows expected cost savings per unit. Products are segmented by demand profiles, with color coding for new or catalog items and their theft prevention methods. "Hi-Demand Behind Glass" and "Catalog Keeper" are in the high sales lift quadrant, indicating significant sales potential with effective theft prevention. In contrast, "Low-Demand Keeper" products are in the lower sales lift area. Understanding the demographics experiencing the worst consumer experience is crucial, as they are projected to see the highest sales lift. Further research into theft profiles is needed to assess the effectiveness of various strategies across product types.
The project timeline outlines 3 main modules: Assessment, Design, and Build, focusing on the deployment and management of CDMA and WiMAX technologies. The Assessment phase, starting in February 2008, identifies gaps in strategy, operations, and infrastructure, laying a solid foundation for subsequent phases. The Design module refines the scope and improvement plan, detailing work on channels, operations, and partner/package selection for effective implementation. The Build module, commencing in May 2008, includes a Friendly User Test (FUT) in May, a soft launch in June with subscriber growth restrictions, and a hard launch in July. This iterative approach emphasizes user testing and feedback to address issues before full-scale deployment, ensuring successful customer acquisition campaigns.
The phased approach to launching a new service includes 3 segments: Online Only, Closed STB Platform, and Open XXXX Offering, each aligned with different timeframes—immediate, short to medium term, and long term. The "Online Only" phase provides immediate access for users to stream or download videos, focusing on data collection and user engagement to understand market preferences. The "Closed STB Platform" offers structured access to free and paid on-demand content through proprietary set-top boxes (STBs), though the lack of established standards limits user choice and flexibility. The "Open XXXX Offering" envisions a long-term ecosystem with established standards, allowing users to choose various consumer premises equipment (CPE), enhancing accessibility and user experience. This roadmap balances immediate engagement with long-term flexibility and competition.
This PPT slide template outlines the benefits of ProductX in 3 categories: Revenue Enhancement, Cost Savings, and Future Cost. Revenue Enhancement includes potential additional revenue through CPT reimbursement from noninvasive tests, which improve patient throughput and operational efficiency in emergency departments by expediting diagnosis. Cost Savings highlights financial benefits from reducing invasive tests, lowering laboratory costs, and avoiding unnecessary treatments due to delayed diagnoses. Future Cost considerations emphasize risk mitigation by avoiding invasive procedures, leading to long-term savings by preventing complications and associated costs. These interconnected benefits support immediate and long-term financial goals in healthcare settings.
This PPT slide template outlines a structured approach to developing a management strategy and roadmap, focusing on key objectives and a timeline. Goals include assessing alignment of organizational capabilities with business needs, coordinating management initiatives, and formulating a two-year strategic roadmap for areas like rights management. The timeline features a phased approach: developing a portfolio of initiatives, evaluating and prioritizing them, and creating a detailed roadmap. A gap analysis identifies discrepancies between current and desired states, helping to pinpoint initiatives that bridge these gaps. The preliminary portfolio categorizes initiatives into quick wins, existing, and new initiatives, ensuring a balanced approach. Prioritization evaluates each initiative for value and feasibility, optimizing resource allocation. The "Future-State Roadmap" section provides stakeholders with a visual guide to planned changes and expected outcomes.
This PPT slide template outlines a structured framework for developing a 5-Year Strategic Plan for the XYZ organization, emphasizing the XXX Strategies and Roadmaps as essential components. A circular diagram illustrates the relationship between Business Mega Processes, the XYZ Strategic Plan, and the Initiative Portfolio, suggesting an integrated approach. A timeline details the 5-Year Strategic Plan Development Process, from the Initial XYZ Strategic Plan in June 2008 to the Final XYZ Strategic Plan in September 2008, highlighting an iterative process with "Revisions to Initiatives" for flexibility. Active engagement from the XXX group ensures alignment with strategic direction. The slide also emphasizes the necessity of clearly defining this approach for ongoing use and outlines expectations for the 2011 Budgeting Process and Monthly XYZ Plan Analysis, ensuring financial planning aligns with strategic objectives.
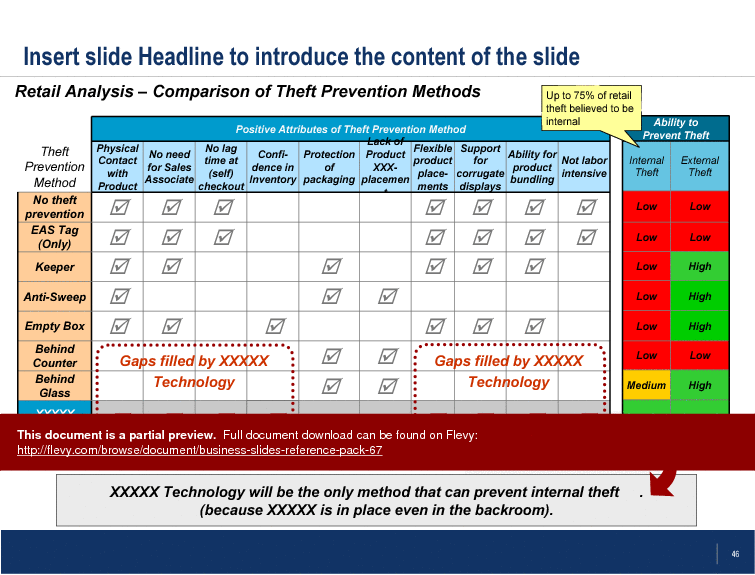
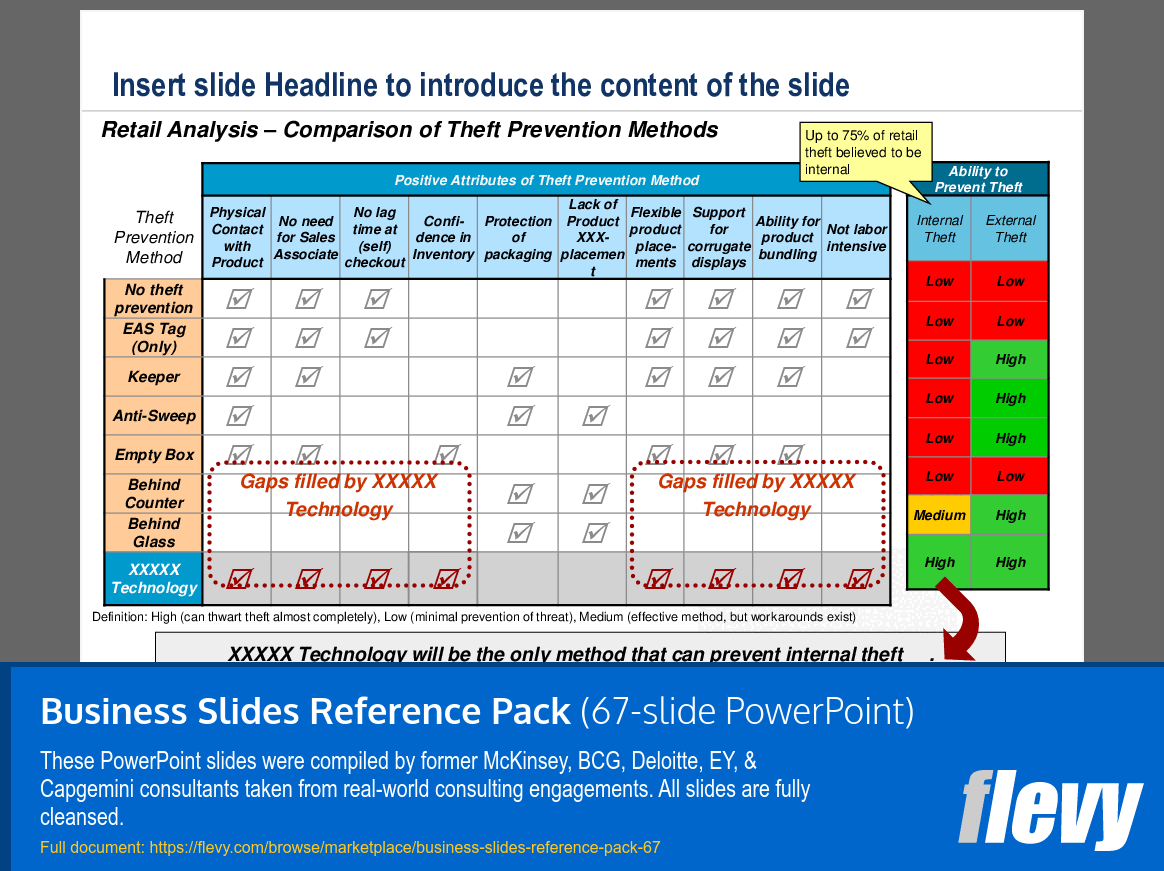
This PPT slide template analyzes theft prevention methods in retail, categorizing them by attributes critical for evaluating effectiveness. Methods include "No theft prevention," "EAS Tag (Only)," "Keeper," "Anti-Sweep," "Empty Box," "Behind Counter," and "Behind Glass." Each method is assessed for physical contact needs, sales associate requirements, self-checkout lag time, inventory confidence, and packaging protection. Notably, "XXXXX Technology" is identified as the only method effectively preventing internal theft, which accounts for up to 75% of retail theft. While many methods address external theft, they often fail against internal incidents. The color-coded comparison illustrates each method's effectiveness against internal and external threats, aiding retailers in enhancing their theft prevention strategies.
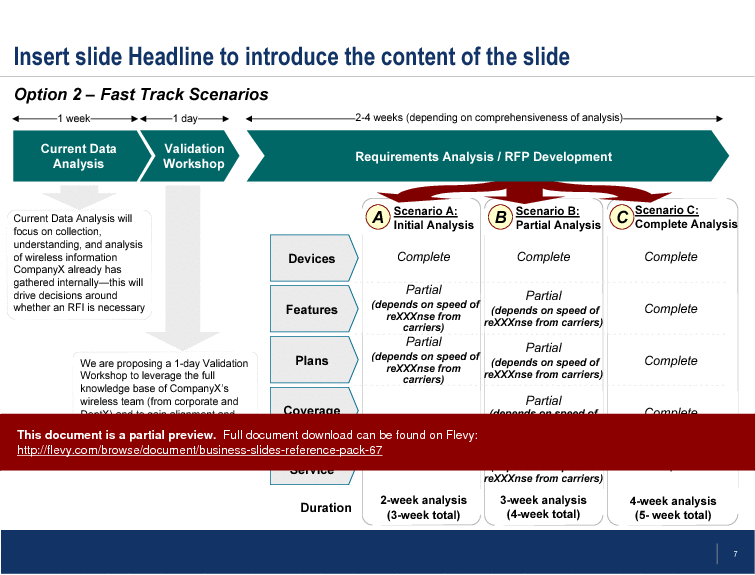
This PPT slide template outlines a structured approach for analyzing wireless information for CompanyX, featuring 3 scenarios: Scenario A (Initial Analysis), Scenario B (Partial Analysis), and Scenario C (Complete Analysis). The timeline progresses from "Current Data Analysis," which focuses on gathering existing wireless data to determine the necessity of a Request for Information (RFI), to a one-day "Validation Workshop" for stakeholder alignment on objectives and requirements. Each scenario evaluates key components such as devices, features, plans, coverage, and quality of service, categorized as complete or partial based on carrier response speed. This framework enables stakeholders to assess analysis depth and its implications for decision-making in wireless sourcing strategy.
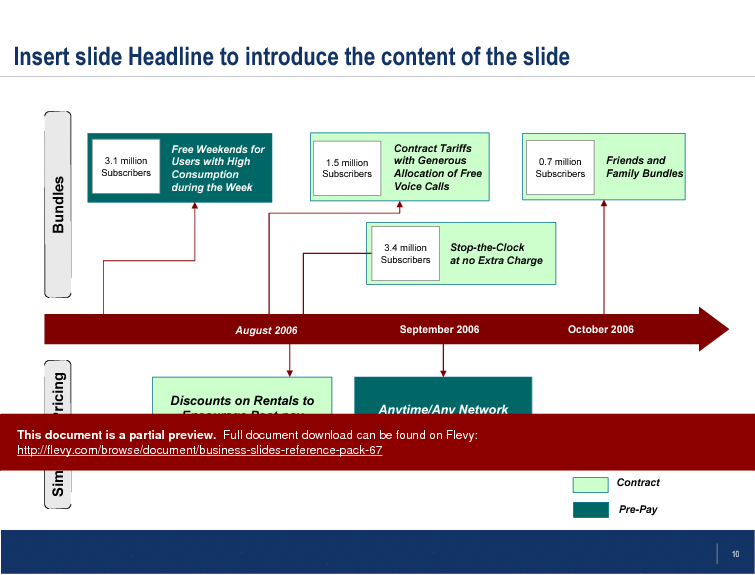
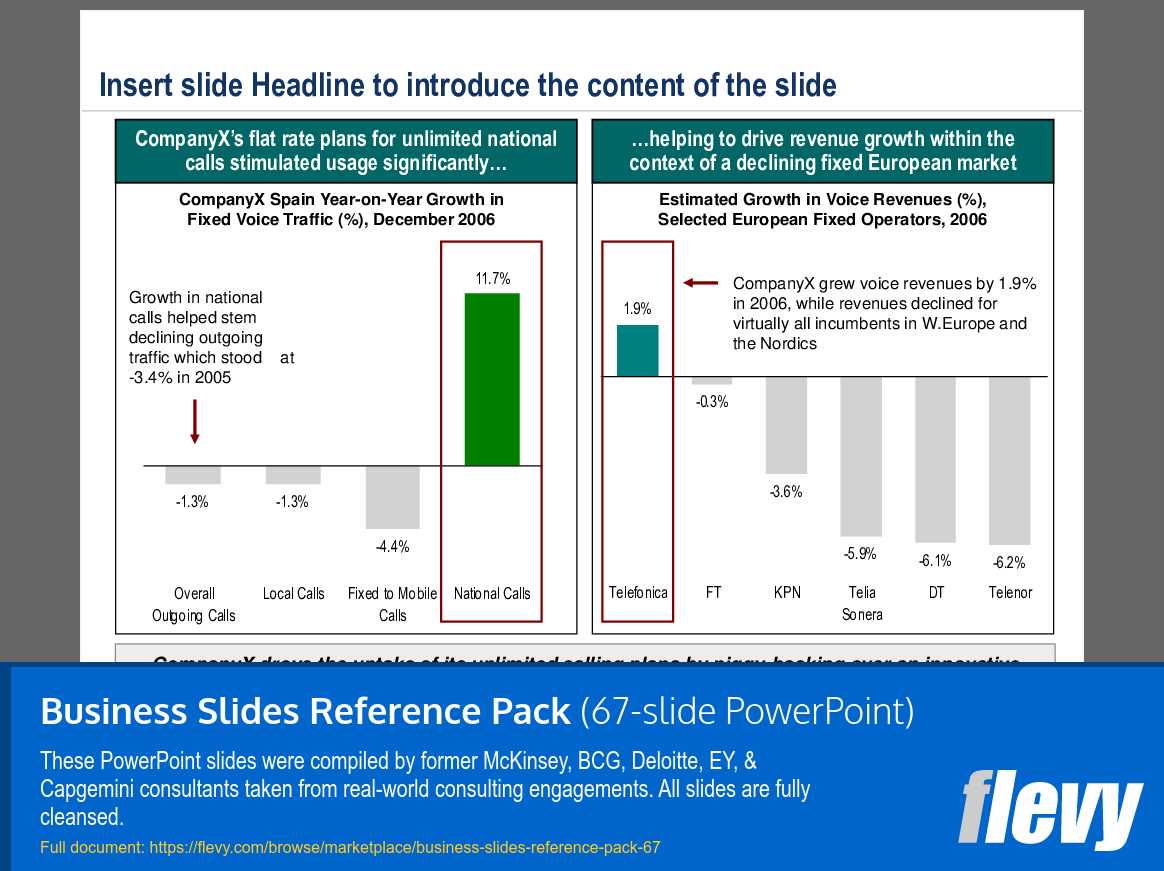
This PPT slide template analyzes CompanyX's performance in the fixed voice traffic market for December 2006, highlighting the impact of flat rate plans for unlimited national calls. Year-on-year growth percentages reveal an 11.7% increase in national calls, contrasting with declines in local calls (-1.3%) and fixed to mobile calls (-4.4%). The introduction of unlimited national calling plans reversed a previous downward trend of -3.4% in 2005. Additionally, CompanyX's voice revenue growth of 1.9% stands out in a market where competitors like Telefónica and FT faced revenue declines. This analysis illustrates how innovative pricing strategies can drive customer engagement and enhance financial performance.
This PPT slide template analyzes the UK market potential for a specific service, focusing on household penetration and subscriber growth over 5 years. It features a funnel graphic showing an initial total of 26 million households in 2008, narrowing to 13.5 million interested households, 6.3 million likely to engage, and an estimated 230,000 subscribers by the end of Year 1. A bar graph tracks subscriber growth from 234 in Year 1 to 1,538 by Year 5, with penetration reaching 6% of total TV households. Key assumptions include an average annual growth rate of 60%, driven by improved delivery and on-demand premium content at lower costs. The Year 5 penetration estimate is slightly conservative compared to analyst predictions, indicating a cautious yet optimistic outlook for market entry or expansion.
This PPT slide template presents a high-level break-even analysis for "XXXXXX Technology," featuring a graph with unit break-even price on the x-axis and total retail sales in billions on the y-axis. The diagonal line represents the break-even unit cost, defined as the incremental variable cost of integrating the technology. The yellow band indicates the break-even range where total sales intersect with unit costs. Key data points include total retail sales of $21.6 billion for "XXXXXs" and $14.4 billion for "Games." The analysis provides a step-by-step approach to determine the break-even point, emphasizing total retail sales, annual retail theft costs, and the intersection on the graph. This analysis is applicable beyond retail, addressing costs related to retail theft and aiding decision-makers in evaluating the financial implications of technology investments.
This PPT slide template outlines a structured vendor selection process with a timeline from January 4 to January 22. Key work streams include Financial Evaluation, where a finance team analyzes VendorX's proposals for financial robustness, and Technical Evaluation, assessing the technical merits of VendorX's offerings. Critical decision points are highlighted, particularly around January 15, when a go/no-go decision will determine whether to proceed with vendor selection or reissue the request for proposals (RFP). Defining service level agreements (SLAs) and penalties is essential for managing vendor performance. Meetings on January 13 and 14 will facilitate collaboration between financial and technical teams to ensure comprehensive evaluation of proposals.
This PPT slide template outlines critical considerations for the Marketing Team during early-stage decision-making. Key focus areas include industry trends, market size and share, operational expenditure implications, and financial metrics such as top-line revenue and EBITDA, essential for assessing financial health and profitability. A funnel visual represents the systematic filtering of products or initiatives, emphasizing that not all options will progress, with a dollar sign indicating that financial outcomes are paramount. All initiatives must align with CompanyX’s 6 strategic objectives to ensure marketing efforts support the overall mission and vision. This comprehensive approach integrates qualitative and quantitative factors, driving informed decision-making and strategic alignment.
This PPT slide template presents a framework for pricing strategies aligned with the product lifecycle, categorizing the market into Early Adopters, Chasm, Early Majority, Late Majority, and Laggards. Early Adopters are less price-sensitive, driven by specific needs in niche markets (e.g., COXX and MetXX), and represent a small segment. The critical transition across the Chasm requires a shift in pricing strategy to attract the Early Majority, who prioritize safety and efficiency and are more price-sensitive. The Late Majority exhibits conservative buying behavior, investing only in well-established products and often choosing “me-too” options. Laggards are the last adopters, resistant to change and motivated by necessity. Developing a pricing strategy that captures early adopters and transitions to the majority market is essential for sustaining revenue growth and maintaining a premium market position.
This PPT slide template analyzes retail product categories and theft prevention strategies using a two-dimensional matrix. The vertical axis represents anticipated sales increase per unit, while the horizontal axis shows expected cost savings per unit. Products are segmented by demand profiles, with color coding for new or catalog items and their theft prevention methods. "Hi-Demand Behind Glass" and "Catalog Keeper" are in the high sales lift quadrant, indicating significant sales potential with effective theft prevention. In contrast, "Low-Demand Keeper" products are in the lower sales lift area. Understanding the demographics experiencing the worst consumer experience is crucial, as they are projected to see the highest sales lift. Further research into theft profiles is needed to assess the effectiveness of various strategies across product types.
The project timeline outlines 3 main modules: Assessment, Design, and Build, focusing on the deployment and management of CDMA and WiMAX technologies. The Assessment phase, starting in February 2008, identifies gaps in strategy, operations, and infrastructure, laying a solid foundation for subsequent phases. The Design module refines the scope and improvement plan, detailing work on channels, operations, and partner/package selection for effective implementation. The Build module, commencing in May 2008, includes a Friendly User Test (FUT) in May, a soft launch in June with subscriber growth restrictions, and a hard launch in July. This iterative approach emphasizes user testing and feedback to address issues before full-scale deployment, ensuring successful customer acquisition campaigns.
The phased approach to launching a new service includes 3 segments: Online Only, Closed STB Platform, and Open XXXX Offering, each aligned with different timeframes—immediate, short to medium term, and long term. The "Online Only" phase provides immediate access for users to stream or download videos, focusing on data collection and user engagement to understand market preferences. The "Closed STB Platform" offers structured access to free and paid on-demand content through proprietary set-top boxes (STBs), though the lack of established standards limits user choice and flexibility. The "Open XXXX Offering" envisions a long-term ecosystem with established standards, allowing users to choose various consumer premises equipment (CPE), enhancing accessibility and user experience. This roadmap balances immediate engagement with long-term flexibility and competition.
This PPT slide template outlines the benefits of ProductX in 3 categories: Revenue Enhancement, Cost Savings, and Future Cost. Revenue Enhancement includes potential additional revenue through CPT reimbursement from noninvasive tests, which improve patient throughput and operational efficiency in emergency departments by expediting diagnosis. Cost Savings highlights financial benefits from reducing invasive tests, lowering laboratory costs, and avoiding unnecessary treatments due to delayed diagnoses. Future Cost considerations emphasize risk mitigation by avoiding invasive procedures, leading to long-term savings by preventing complications and associated costs. These interconnected benefits support immediate and long-term financial goals in healthcare settings.
This PPT slide template outlines a structured approach to developing a management strategy and roadmap, focusing on key objectives and a timeline. Goals include assessing alignment of organizational capabilities with business needs, coordinating management initiatives, and formulating a two-year strategic roadmap for areas like rights management. The timeline features a phased approach: developing a portfolio of initiatives, evaluating and prioritizing them, and creating a detailed roadmap. A gap analysis identifies discrepancies between current and desired states, helping to pinpoint initiatives that bridge these gaps. The preliminary portfolio categorizes initiatives into quick wins, existing, and new initiatives, ensuring a balanced approach. Prioritization evaluates each initiative for value and feasibility, optimizing resource allocation. The "Future-State Roadmap" section provides stakeholders with a visual guide to planned changes and expected outcomes.
This PPT slide template outlines a structured framework for developing a 5-Year Strategic Plan for the XYZ organization, emphasizing the XXX Strategies and Roadmaps as essential components. A circular diagram illustrates the relationship between Business Mega Processes, the XYZ Strategic Plan, and the Initiative Portfolio, suggesting an integrated approach. A timeline details the 5-Year Strategic Plan Development Process, from the Initial XYZ Strategic Plan in June 2008 to the Final XYZ Strategic Plan in September 2008, highlighting an iterative process with "Revisions to Initiatives" for flexibility. Active engagement from the XXX group ensures alignment with strategic direction. The slide also emphasizes the necessity of clearly defining this approach for ongoing use and outlines expectations for the 2011 Budgeting Process and Monthly XYZ Plan Analysis, ensuring financial planning aligns with strategic objectives.
This PPT slide template analyzes theft prevention methods in retail, categorizing them by attributes critical for evaluating effectiveness. Methods include "No theft prevention," "EAS Tag (Only)," "Keeper," "Anti-Sweep," "Empty Box," "Behind Counter," and "Behind Glass." Each method is assessed for physical contact needs, sales associate requirements, self-checkout lag time, inventory confidence, and packaging protection. Notably, "XXXXX Technology" is identified as the only method effectively preventing internal theft, which accounts for up to 75% of retail theft. While many methods address external theft, they often fail against internal incidents. The color-coded comparison illustrates each method's effectiveness against internal and external threats, aiding retailers in enhancing their theft prevention strategies.
This PPT slide template outlines a structured approach for analyzing wireless information for CompanyX, featuring 3 scenarios: Scenario A (Initial Analysis), Scenario B (Partial Analysis), and Scenario C (Complete Analysis). The timeline progresses from "Current Data Analysis," which focuses on gathering existing wireless data to determine the necessity of a Request for Information (RFI), to a one-day "Validation Workshop" for stakeholder alignment on objectives and requirements. Each scenario evaluates key components such as devices, features, plans, coverage, and quality of service, categorized as complete or partial based on carrier response speed. This framework enables stakeholders to assess analysis depth and its implications for decision-making in wireless sourcing strategy.
This PPT slide template analyzes CompanyX's performance in the fixed voice traffic market for December 2006, highlighting the impact of flat rate plans for unlimited national calls. Year-on-year growth percentages reveal an 11.7% increase in national calls, contrasting with declines in local calls (-1.3%) and fixed to mobile calls (-4.4%). The introduction of unlimited national calling plans reversed a previous downward trend of -3.4% in 2005. Additionally, CompanyX's voice revenue growth of 1.9% stands out in a market where competitors like Telefónica and FT faced revenue declines. This analysis illustrates how innovative pricing strategies can drive customer engagement and enhance financial performance.
This PPT slide template analyzes the UK market potential for a specific service, focusing on household penetration and subscriber growth over 5 years. It features a funnel graphic showing an initial total of 26 million households in 2008, narrowing to 13.5 million interested households, 6.3 million likely to engage, and an estimated 230,000 subscribers by the end of Year 1. A bar graph tracks subscriber growth from 234 in Year 1 to 1,538 by Year 5, with penetration reaching 6% of total TV households. Key assumptions include an average annual growth rate of 60%, driven by improved delivery and on-demand premium content at lower costs. The Year 5 penetration estimate is slightly conservative compared to analyst predictions, indicating a cautious yet optimistic outlook for market entry or expansion.
This PPT slide template presents a high-level break-even analysis for "XXXXXX Technology," featuring a graph with unit break-even price on the x-axis and total retail sales in billions on the y-axis. The diagonal line represents the break-even unit cost, defined as the incremental variable cost of integrating the technology. The yellow band indicates the break-even range where total sales intersect with unit costs. Key data points include total retail sales of $21.6 billion for "XXXXXs" and $14.4 billion for "Games." The analysis provides a step-by-step approach to determine the break-even point, emphasizing total retail sales, annual retail theft costs, and the intersection on the graph. This analysis is applicable beyond retail, addressing costs related to retail theft and aiding decision-makers in evaluating the financial implications of technology investments.
Source: Best Practices in PowerPoint Diagrams Compilation PowerPoint Slides: Business Slides Reference Pack PowerPoint (PPT) Presentation Slide Deck, LearnPPT Consulting
These PowerPoint slides were compiled by former McKinsey, BCG, Deloitte, EY, & Capgemini consultants taken from real-world consulting engagements. All slides are fully cleansed.
We are a team of management consultants trained by top tier global consulting firms (including McKinsey, BCG, Deloitte, EY, Capgemini) with a collective experience of several decades. We specialize in business frameworks based on real-life consulting engagements.
We have served 100s of clients that range from Fortune 500 companies to tech startups to
... [read more] $1B+ private companies.
Utilize our consulting frameworks to apply structured thinking & analysis to address your business challenges, uncover strategic insights, and implement workable solutions. Our PowerPoint presentations follow traditional consulting slide design formats, starting with a clear slide headline. Easily customize and repurpose our slides for your own business presentations.
Beyond business frameworks & methodologies, we also offer PowerPoint templates and other business templates. Our templates are professionally designed and have been used in thousands of deliverables & work products across hundreds of clients.
The average daily rate of a McKinsey consultant is $6,625 (not including expenses). The average price of a Flevy document is $65.
Trusted by over 10,000+ Client Organizations
Since 2012, we have provided business templates to over 10,000 businesses and organizations of all sizes, from startups and small businesses to the Fortune 100, in over 130 countries.
"If you are looking for great resources to save time with your business presentations, Flevy is truly a value-added resource. Flevy has done all the work for you and we will continue to utilize Flevy as a source to extract up-to-date information and data for our virtual and onsite presentations!"
– Debbi Saffo, President at The NiKhar Group
"[Flevy] produces some great work that has been/continues to be of immense help not only to myself, but as I seek to provide professional services to my clients, it gives me a large "tool box" of resources that are critical to provide them with the quality of service and outcomes they are expecting."
– Royston Knowles, Executive with 50+ Years of Board Level Experience
"FlevyPro has been a brilliant resource for me, as an independent growth consultant, to access a vast knowledge bank of presentations to support my work with clients. In terms of RoI, the value I received from the very first presentation I downloaded paid for my subscription many times over! The
quality of the decks available allows me to punch way above my weight – it's like having the resources of a Big 4 consultancy at your fingertips at a microscopic fraction of the overhead.
"
– Roderick Cameron, Founding Partner at SGFE Ltd
"As a small business owner, the resource material available from FlevyPro has proven to be invaluable. The ability to search for material on demand based our project events and client requirements was great for me and proved very beneficial to my clients. Importantly, being able to easily edit and tailor
the material for specific purposes helped us to make presentations, knowledge sharing, and toolkit development, which formed part of the overall program collateral. While FlevyPro contains resource material that any consultancy, project or delivery firm must have, it is an essential part of a small firm or independent consultant's toolbox.
"
– Michael Duff, Managing Director at Change Strategy (UK)
"One of the great discoveries that I have made for my business is the Flevy library of training materials.
As a Lean Transformation Expert, I am always making presentations to clients on a variety of topics: Training, Transformation, Total Productive Maintenance, Culture, Coaching, Tools, Leadership Behavior, etc. Flevy
It is well worth the money to purchase these presentations. Sure, I have the knowledge and information to make my point. It is another thing to create a presentation that captures what I want to say. Flevy has saved me countless hours of preparation time that is much better spent with implementation that will actually save money for my clients.
"
– Ed Kemmerling, Senior Lean Transformation Expert at PMG
"Flevy is now a part of my business routine. I visit Flevy at least 3 times each month.
Flevy has become my preferred learning source, because what it provides is practical, current, and useful in this era where the business world is being rewritten.
many challenges and there is the need to make the right decisions in a short time, with so much scattered information, we are fortunate to have Flevy. Flevy investigates, selects, and puts at our disposal the best of the best to help us be successful in our work.
"
– Omar Hernán Montes Parra, CEO at Quantum SFE
"My FlevyPro subscription provides me with the most popular frameworks and decks in demand in today’s market. They not only augment my existing consulting and coaching offerings and delivery, but also keep me abreast of the latest trends, inspire new products and service offerings for my practice, and educate me
in a fraction of the time and money of other solutions. I strongly recommend FlevyPro to any consultant serious about success.
"
– Bill Branson, Founder at Strategic Business Architects
"FlevyPro provides business frameworks from many of the global giants in management consulting that allow you to provide best in class solutions for your clients."
– David Harris, Managing Director at Futures Strategy
Receive our FREE whitepaper on the Top 101 Consulting Frameworks
Download our 200+ page guide summarizing the Top 101 Management Consulting Frameworks. Each framework provides a structured approach to analyzing and solving a common business problem.
Receive our FREE whitepaper on the Top 101 Consulting Frameworks
Get Our FREE Product.
Download our 200+ page guide summarizing the Top 101 Management Consulting Frameworks. Each framework provides a structured approach to analyzing and solving a common business problem.