
 Click main image to view in full screen. Unlock all 12 preview images:
Bond Duration and Convexity: Interest Rate Risk Blueprint – PowerPoint PPTX Template
PowerPoint (PPTX) + Excel (XLSX) 84 Slides


BENEFITS OF THIS DOWNLOADABLE POWERPOINT DOCUMENT
- Answer the three questions a governing body actually asks. How much rate risk are we carrying, in dollars. Is it sitting where we intended it to sit. And what would have to happen to hurt us. The framework produces all three with the assumptions printed a
- Deploy it, do not just read it. Fourteen named frameworks, templates and checklists, a forty position live model, a board ready shock report that prints its own caveats, and a twenty four item review checklist you can run on any bond or portfolio the day
- Show your work to a reviewer. Both analytics engines are open and laid out period by period, key rate durations sum to portfolio duration as a built in check, and every estimate is reconciled to a full revaluation rather than trusted.
FINANCIAL RISK PPT TEMPLATE DESCRIPTION
Most fixed income portfolios cannot answer three basic questions with a number anyone would defend in a meeting: how much do we lose if rates move, where in the portfolio does that risk actually sit, and what would have to happen to really hurt us. This product answers all three, and shows the arithmetic behind every answer.
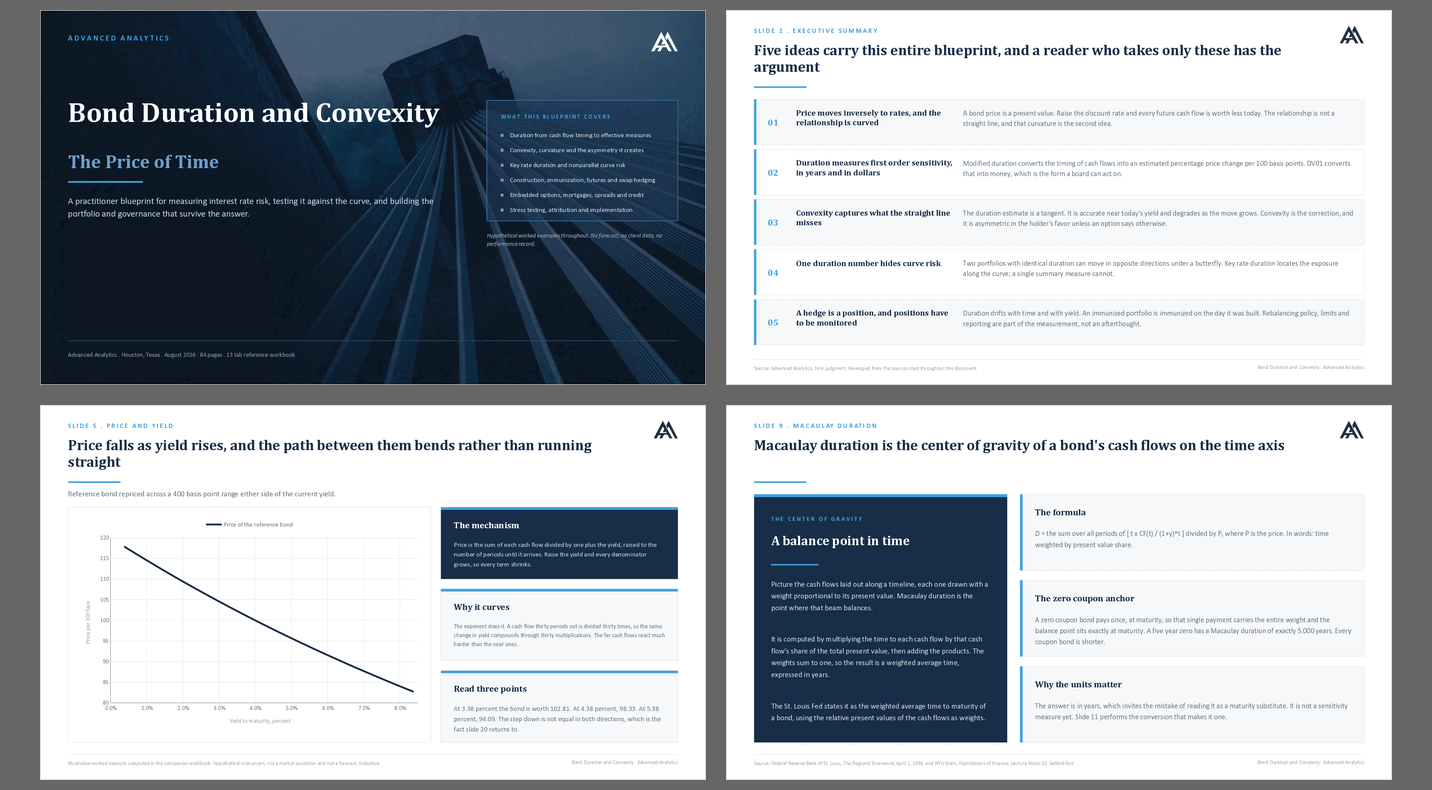
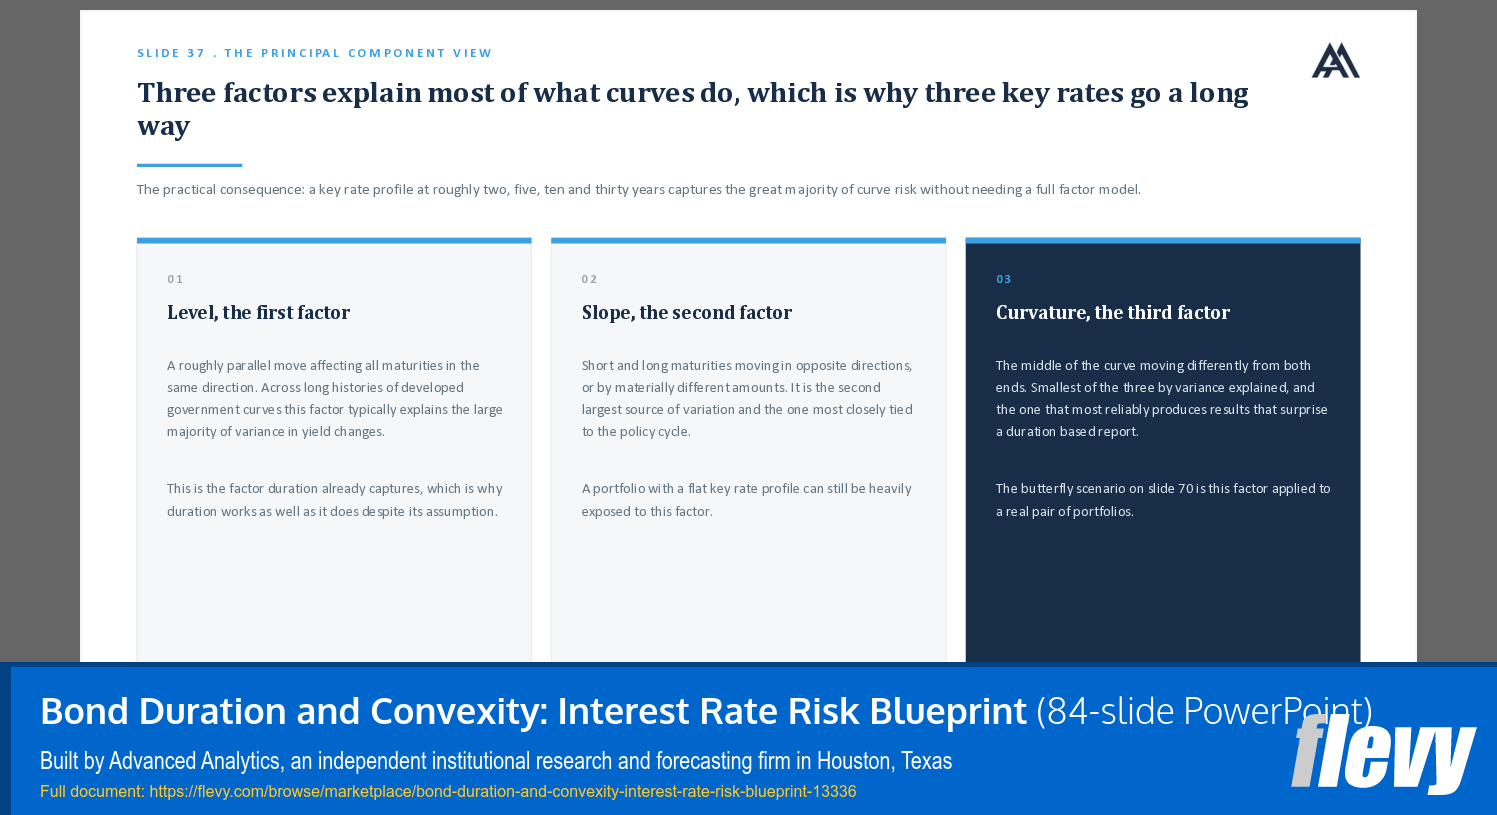
You get an 84-slide framework deck and a 13-tab Excel model with 2,337 live formulas. Drop your own holdings into the model, up to 40 positions, and it returns price, market value, modified duration, convexity, DV01, contribution to duration and share of risk for every line, then rolls them into portfolio totals. It shocks the curve at seven sizes and prints a board-ready page with the dollar loss at each one. It breaks the portfolio into key rate buckets at two, five, ten and thirty years, compares each bucket against limits you set, and flags a breach in red. Nothing is hidden, locked, protected or macro-driven. Every formula is visible and every cell is yours to change.
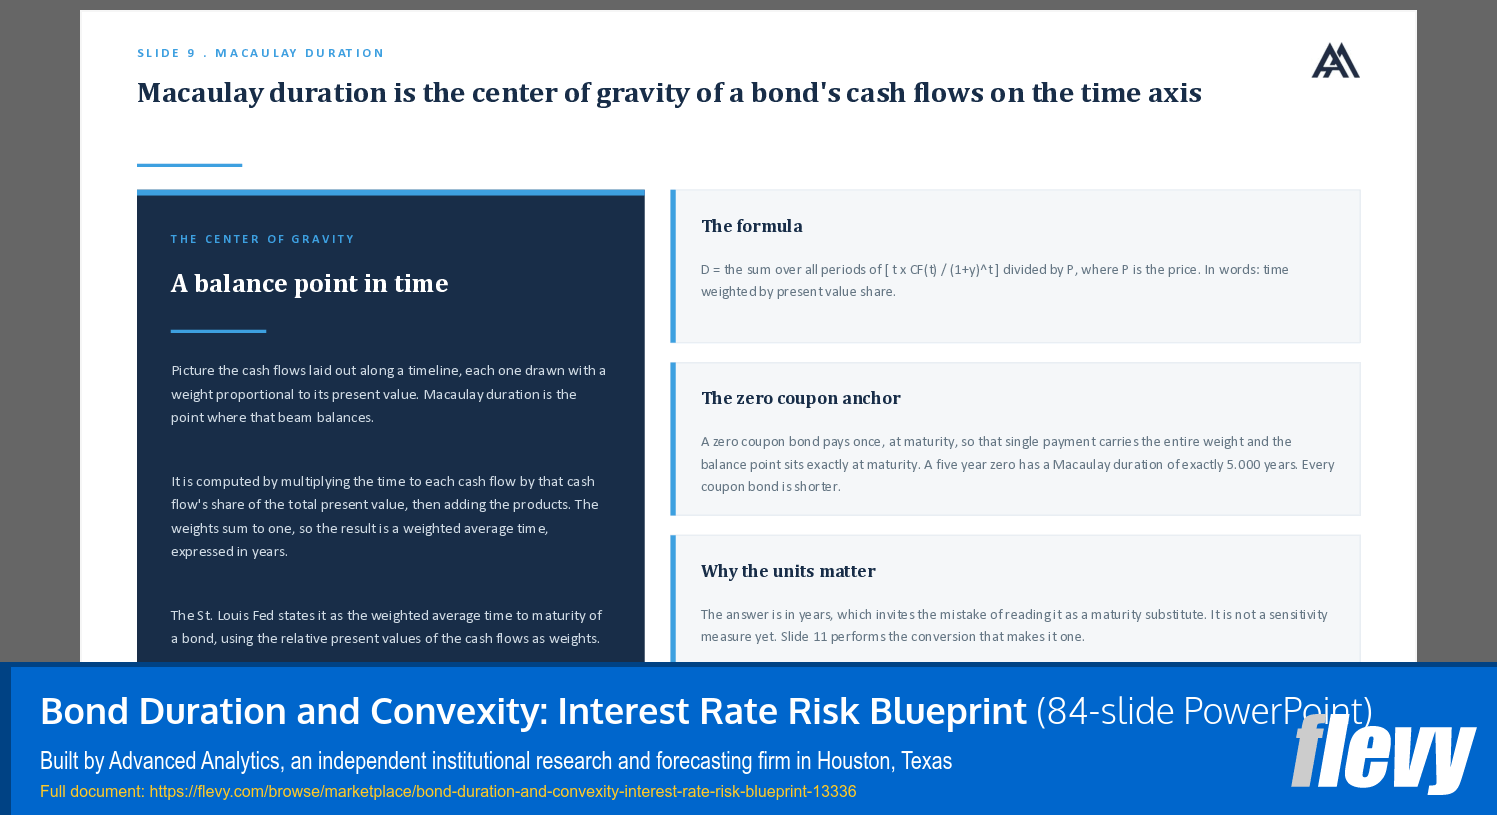
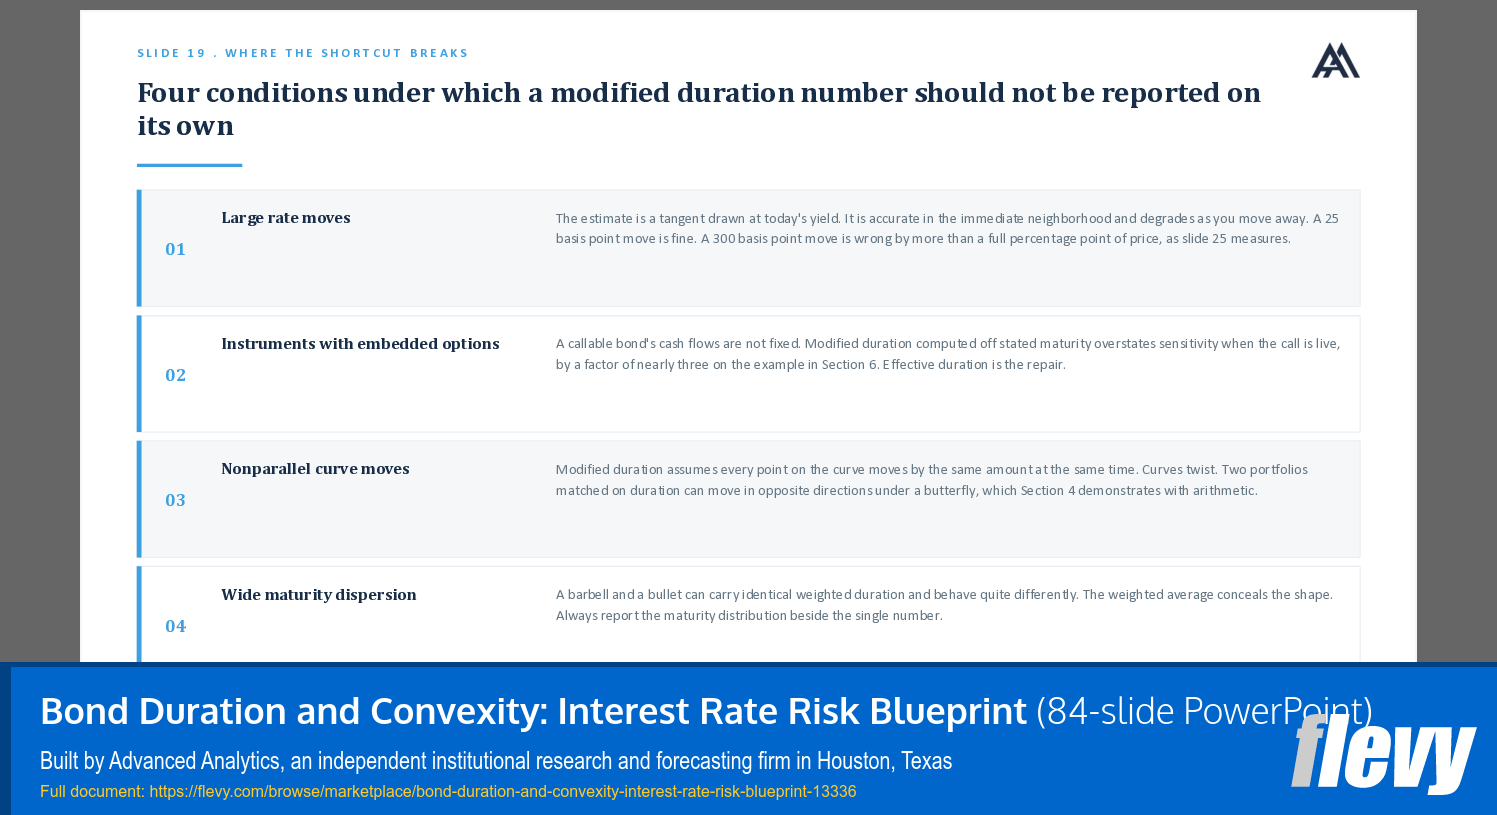
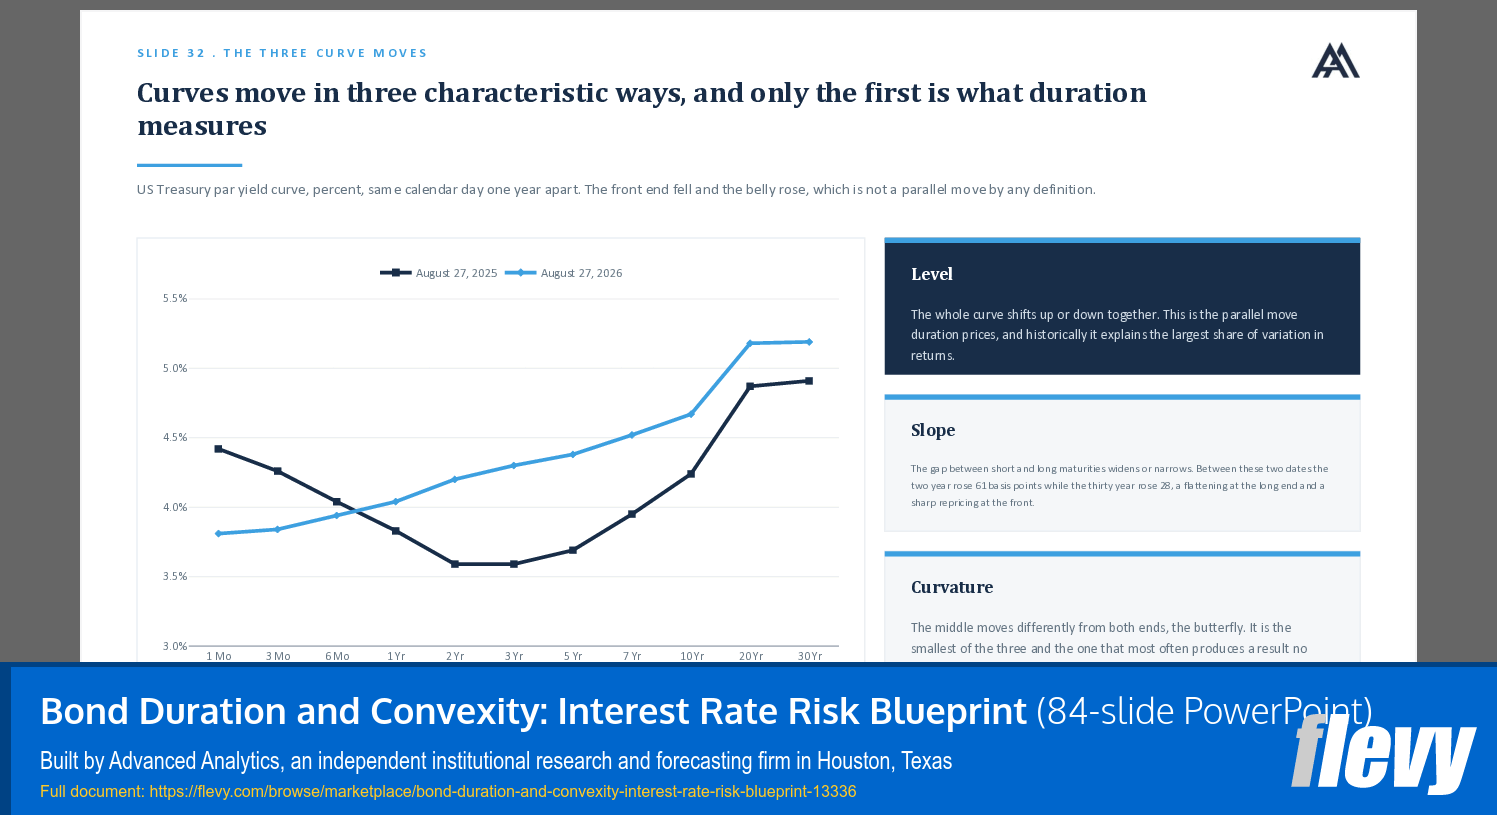
The deck is the method behind the model, in eight modules: bond mechanics, duration, convexity, curve risk, portfolio construction and hedging, embedded options and credit, stress testing and implementation, and a closing toolkit. Fourteen named frameworks, templates and checklists, including a 24-item review checklist you can run on any bond or portfolio the day you download it.
The argument at the center is one worked comparison. Two portfolios are built to identical duration and identical market value, so a standard duration report cannot tell them apart. Under one curve scenario, one gains 1.34 percent while the other loses 2.17. That is the gap between a number that looks fine and a position that is not, and the whole framework exists to close it.
Built for treasurers, investment officers, risk officers, trustees and the consultants who advise them. Every worked example is hypothetical and labeled, every external figure carries its source, and nothing in it is a forecast.
Got a question about the product? Email us at support@flevy.com or ask the author directly by using the "Ask the Author a Question" form. If you cannot view the preview above this document description, go here to view the large preview instead.
Source: Best Practices in Financial Risk PowerPoint Slides: Bond Duration and Convexity: Interest Rate Risk Blueprint PowerPoint (PPTX) Presentation Slide Deck, Advanced Analytics
ABOUT THE AUTHOR

Advanced Analytics is an independent institutional research and forecasting firm in Houston, Texas, founded in 2016. We build market forecasts and decision models for the industries powering the AI buildout -- grid equipment, data centre infrastructure, nuclear, semiconductors and industrial capital goods -- for institutional investors, private equity, manufacturers and utilities. The documents ... [read more]
Ask the Author a Question
You must be logged in to contact the author.




























