
 Click main image to view in full screen. Unlock all 10 preview images:
Working Capital Release Model: Nine Levers in Excel – Excel XLSX
Excel (XLSX) + Zip archive file (ZIP)


BENEFITS OF THIS DOWNLOADABLE EXCEL DOCUMENT
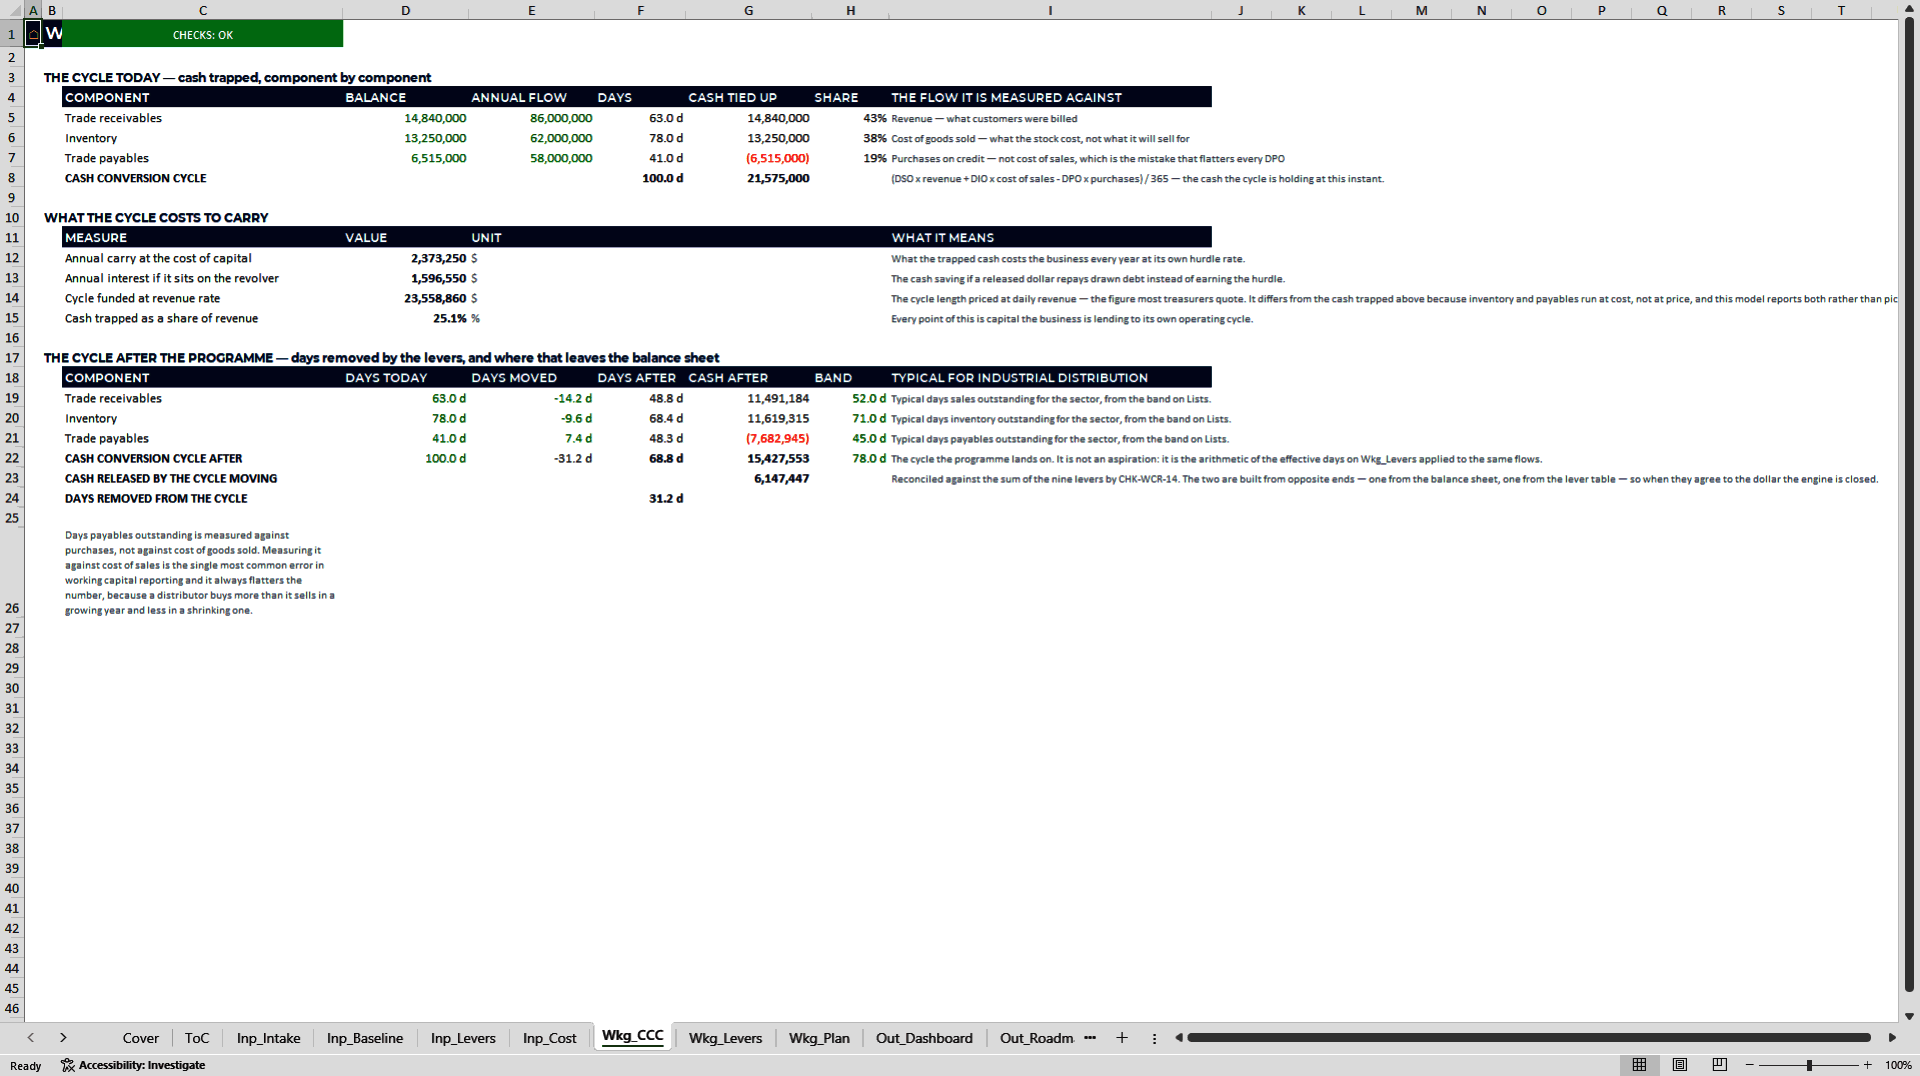
- Measure receivables, payables and inventory against payment behaviour and target cover before setting a cash-release target.
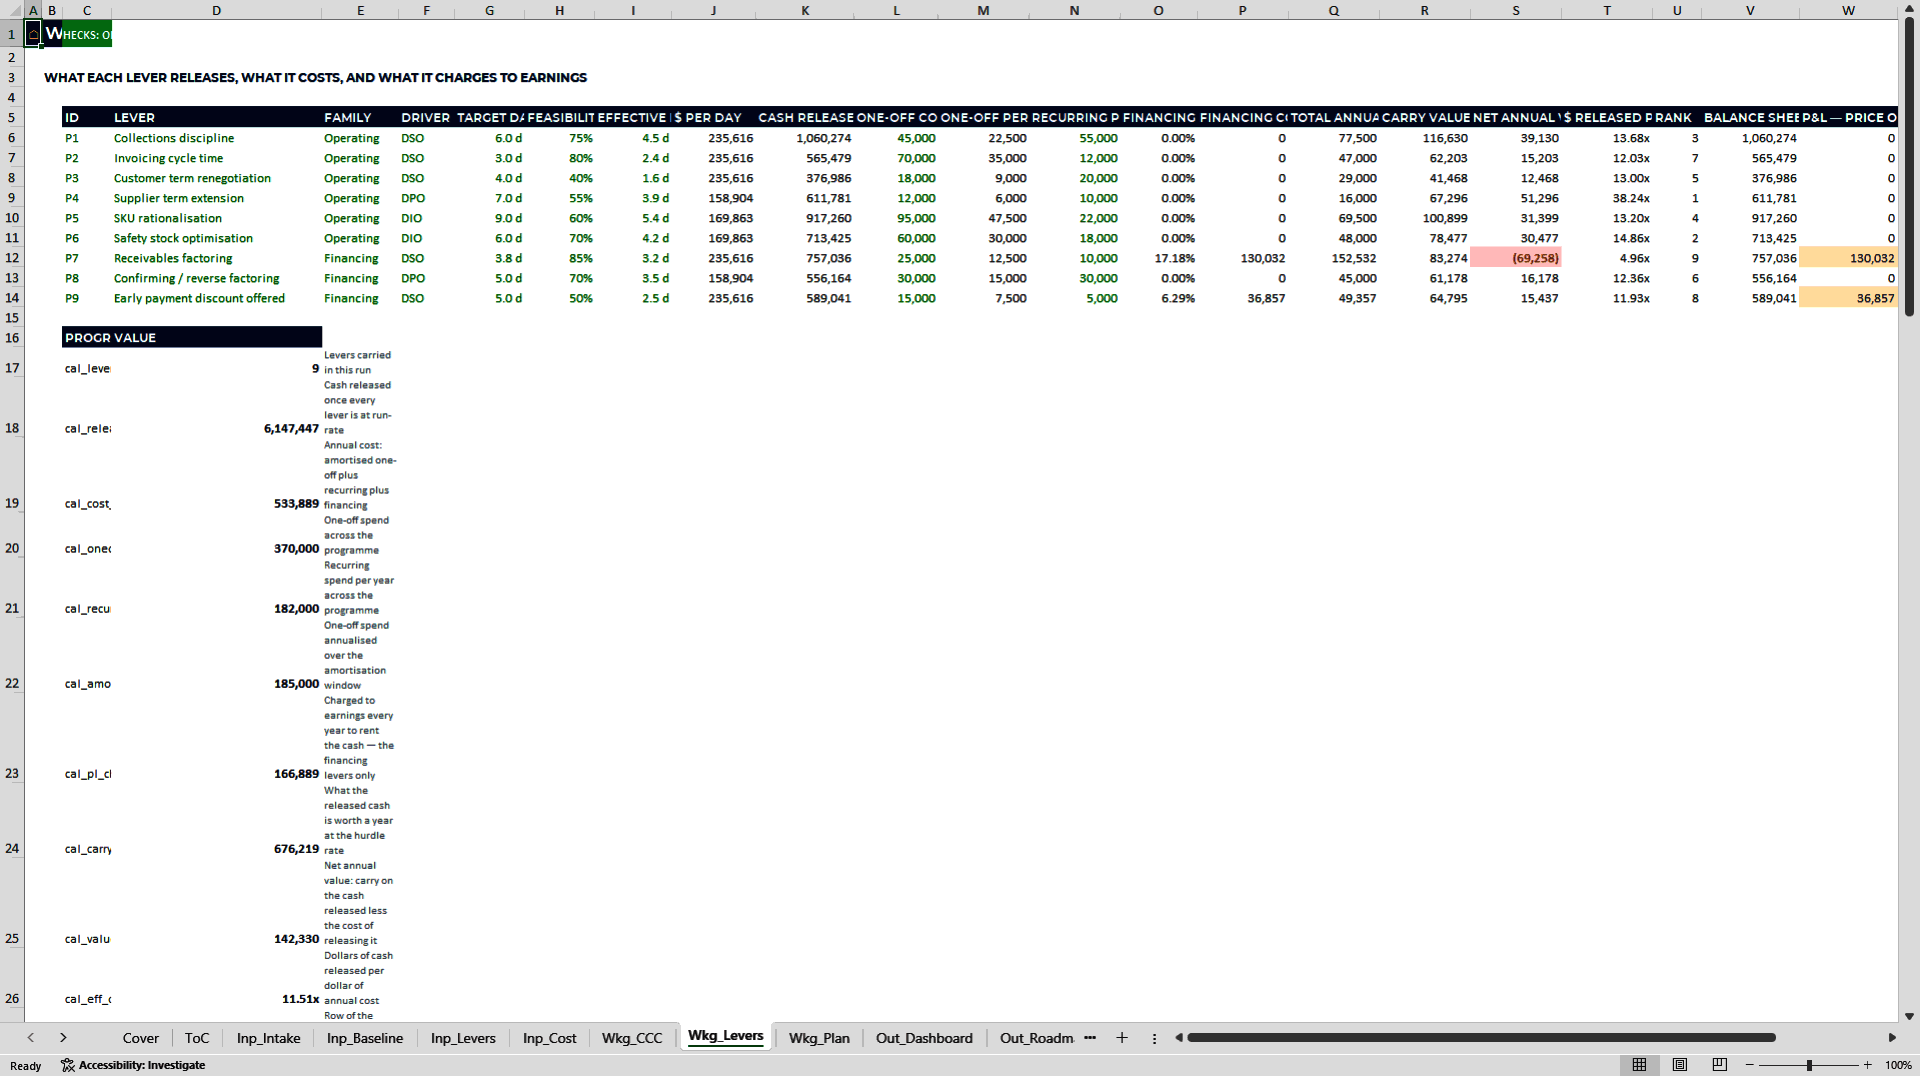
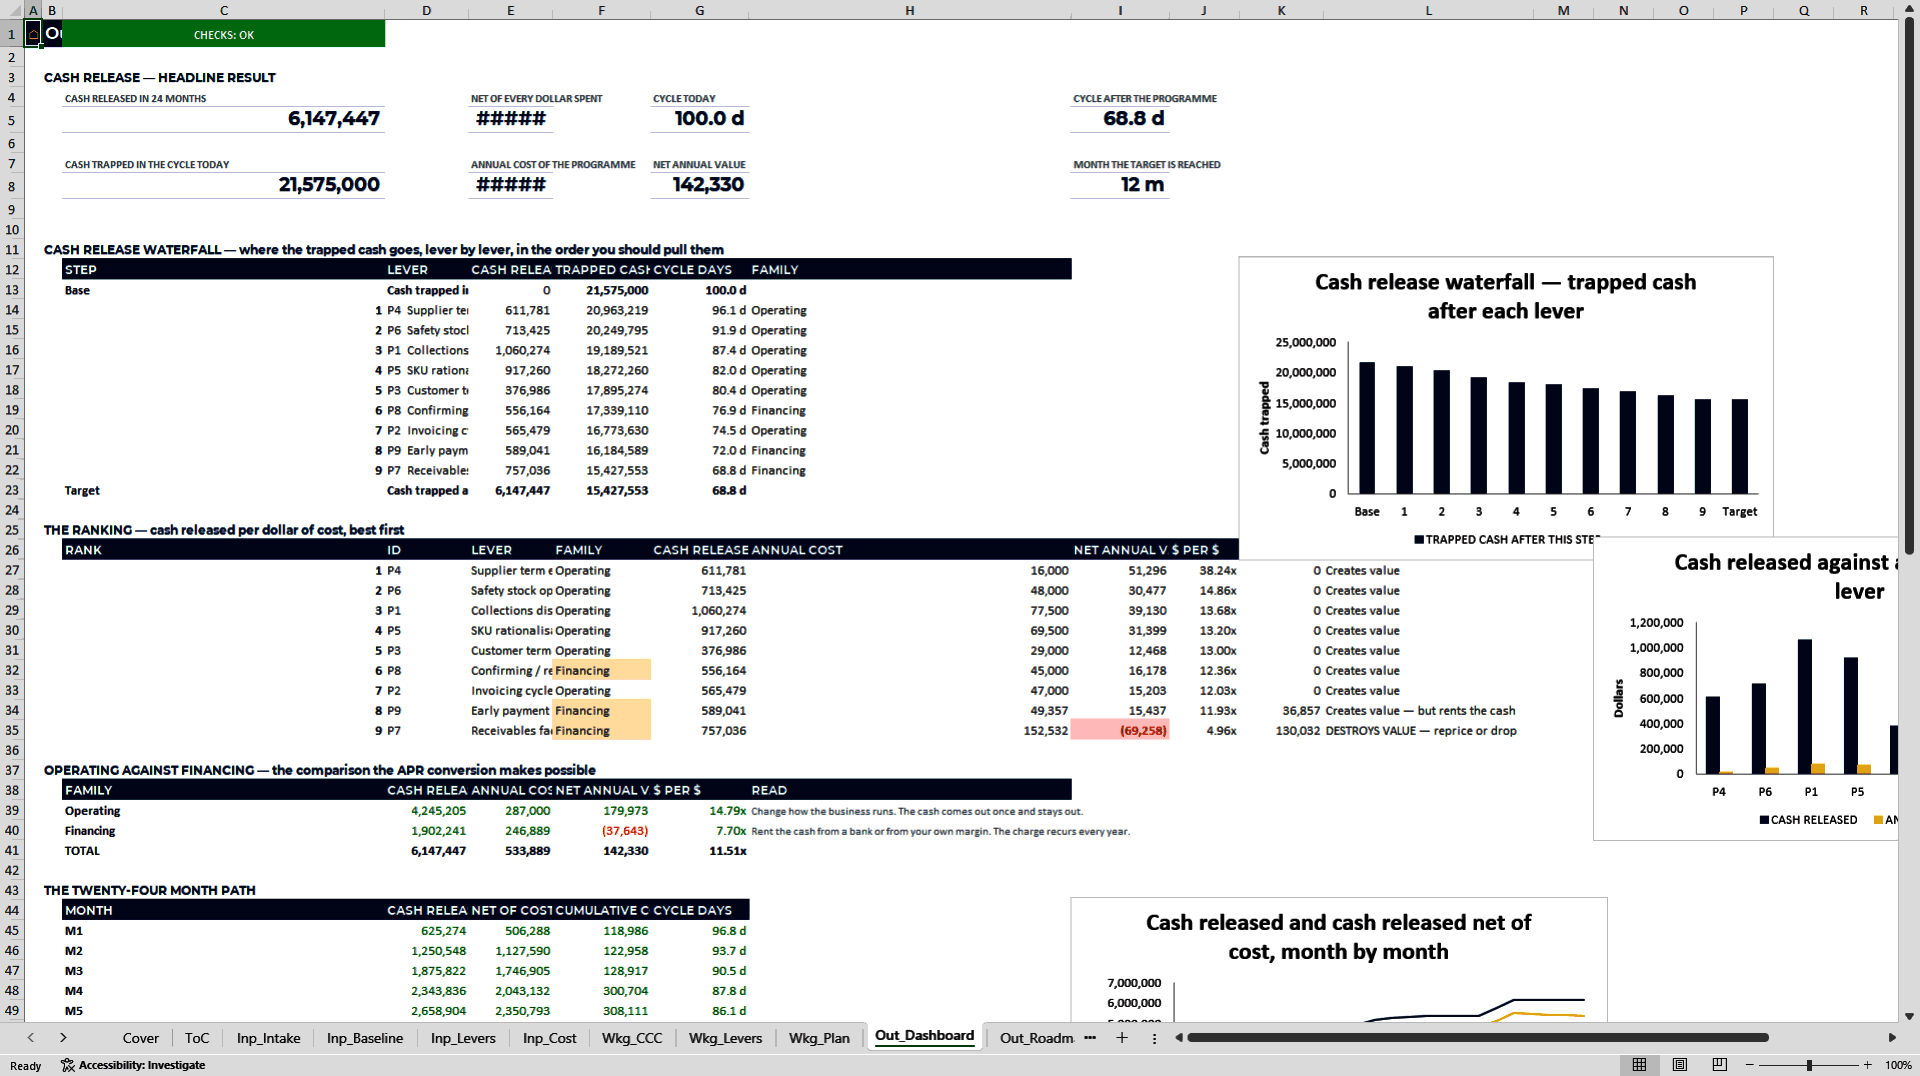
- Compare nine operating and financing levers by expected cash release, costs and economic value using your own assumptions.
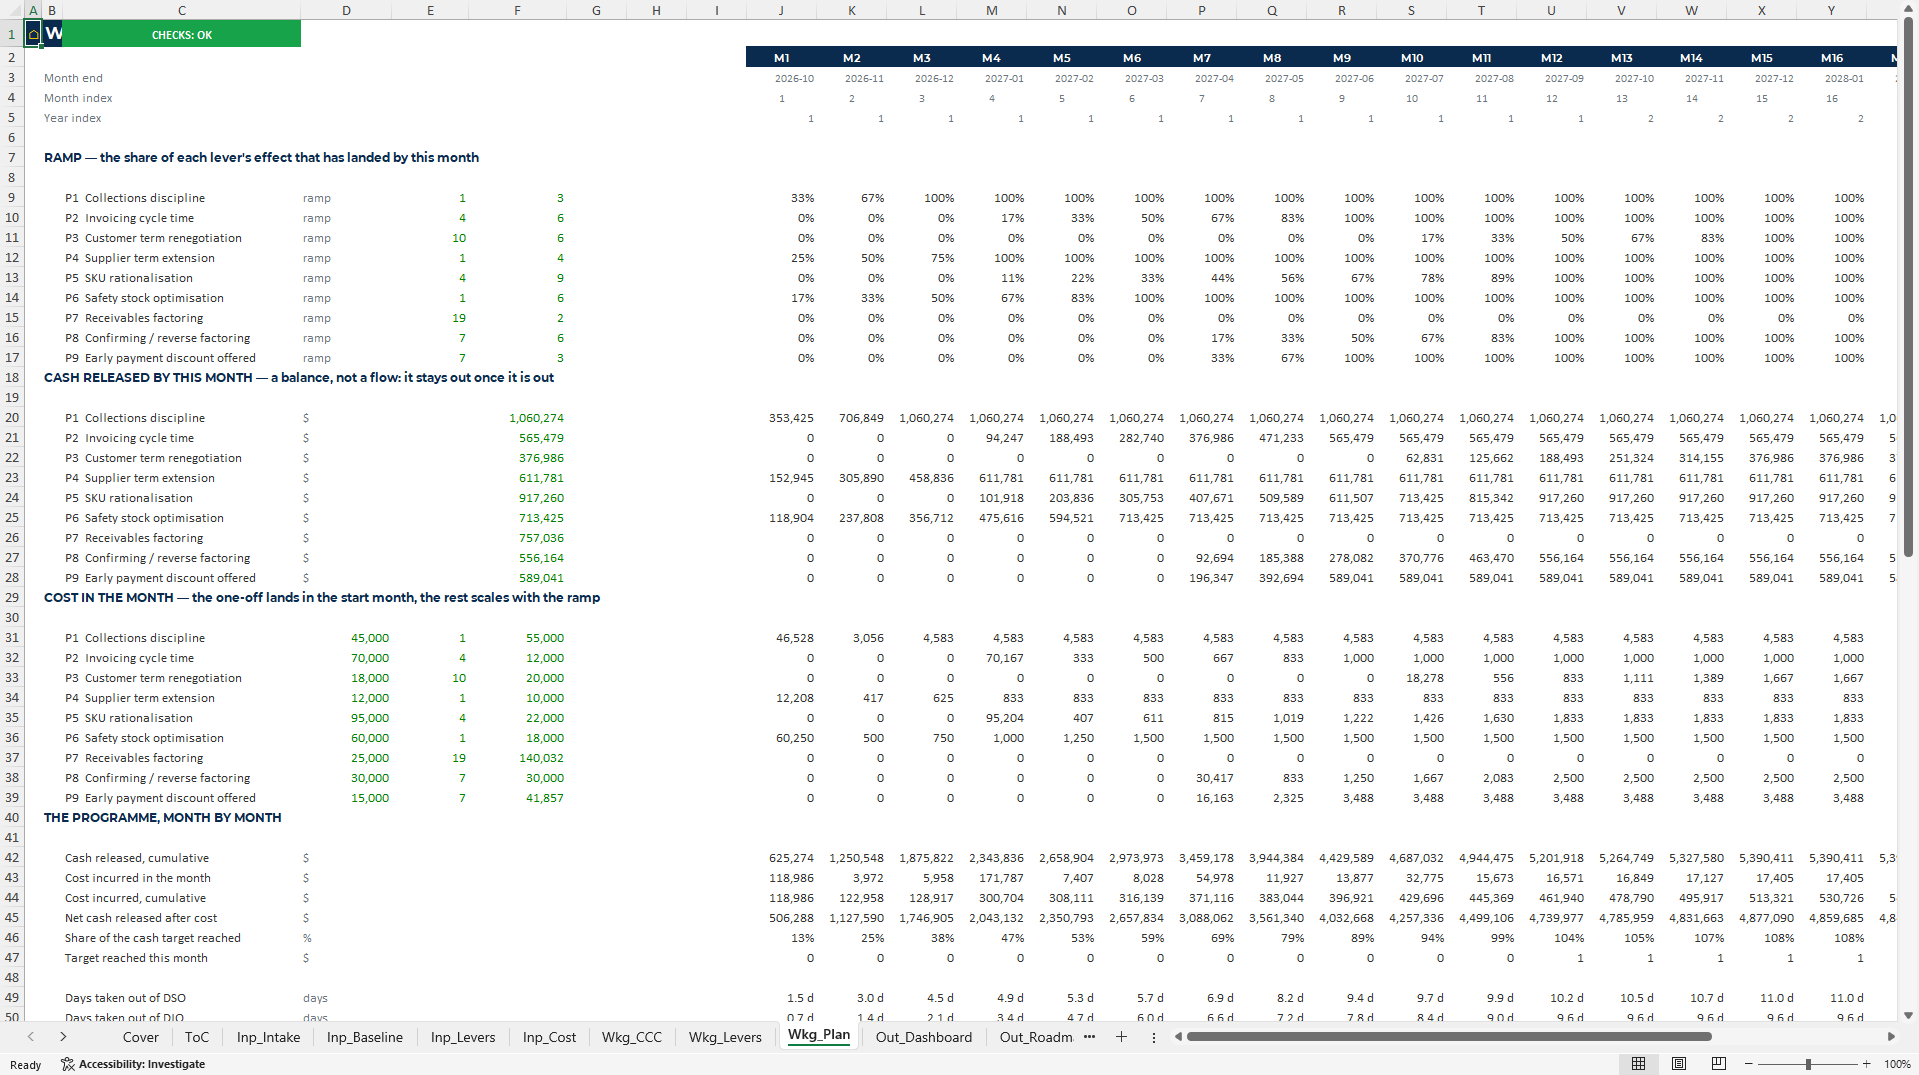
- Build a monthly delivery plan of up to 24 months with owners, timing and milestones for a management review.
WORKING CAPITAL MANAGEMENT EXCEL DESCRIPTION
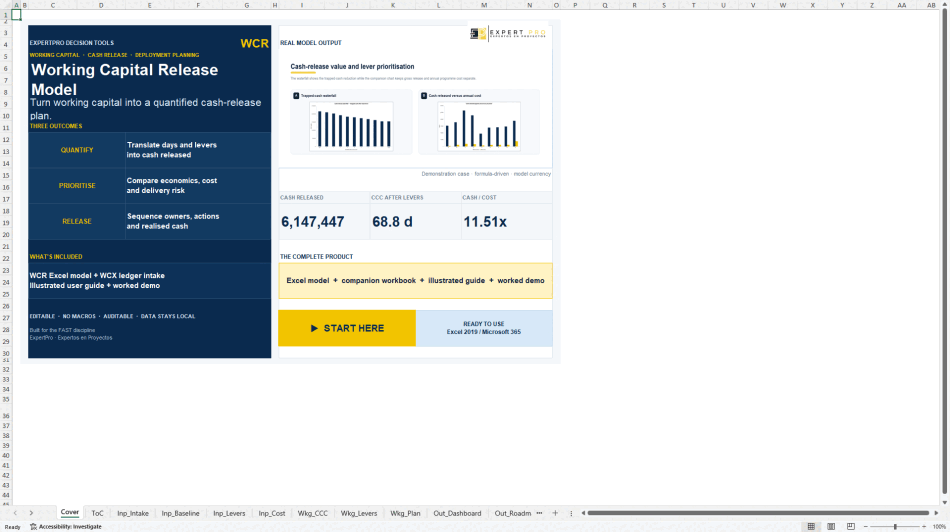
Compare nine working-capital levers before committing to a cash-release plan.
The Working Capital Release Model helps finance and operations teams measure cash tied up in receivables, payables and inventory, compare improvement options, and set out a delivery sequence. It connects a diagnostic intake with the economics of nine operating and financing levers and a monthly plan covering up to 24 months. The package includes two editable Excel workbooks, a populated example and an illustrated user manual.
WHAT YOU RECEIVE
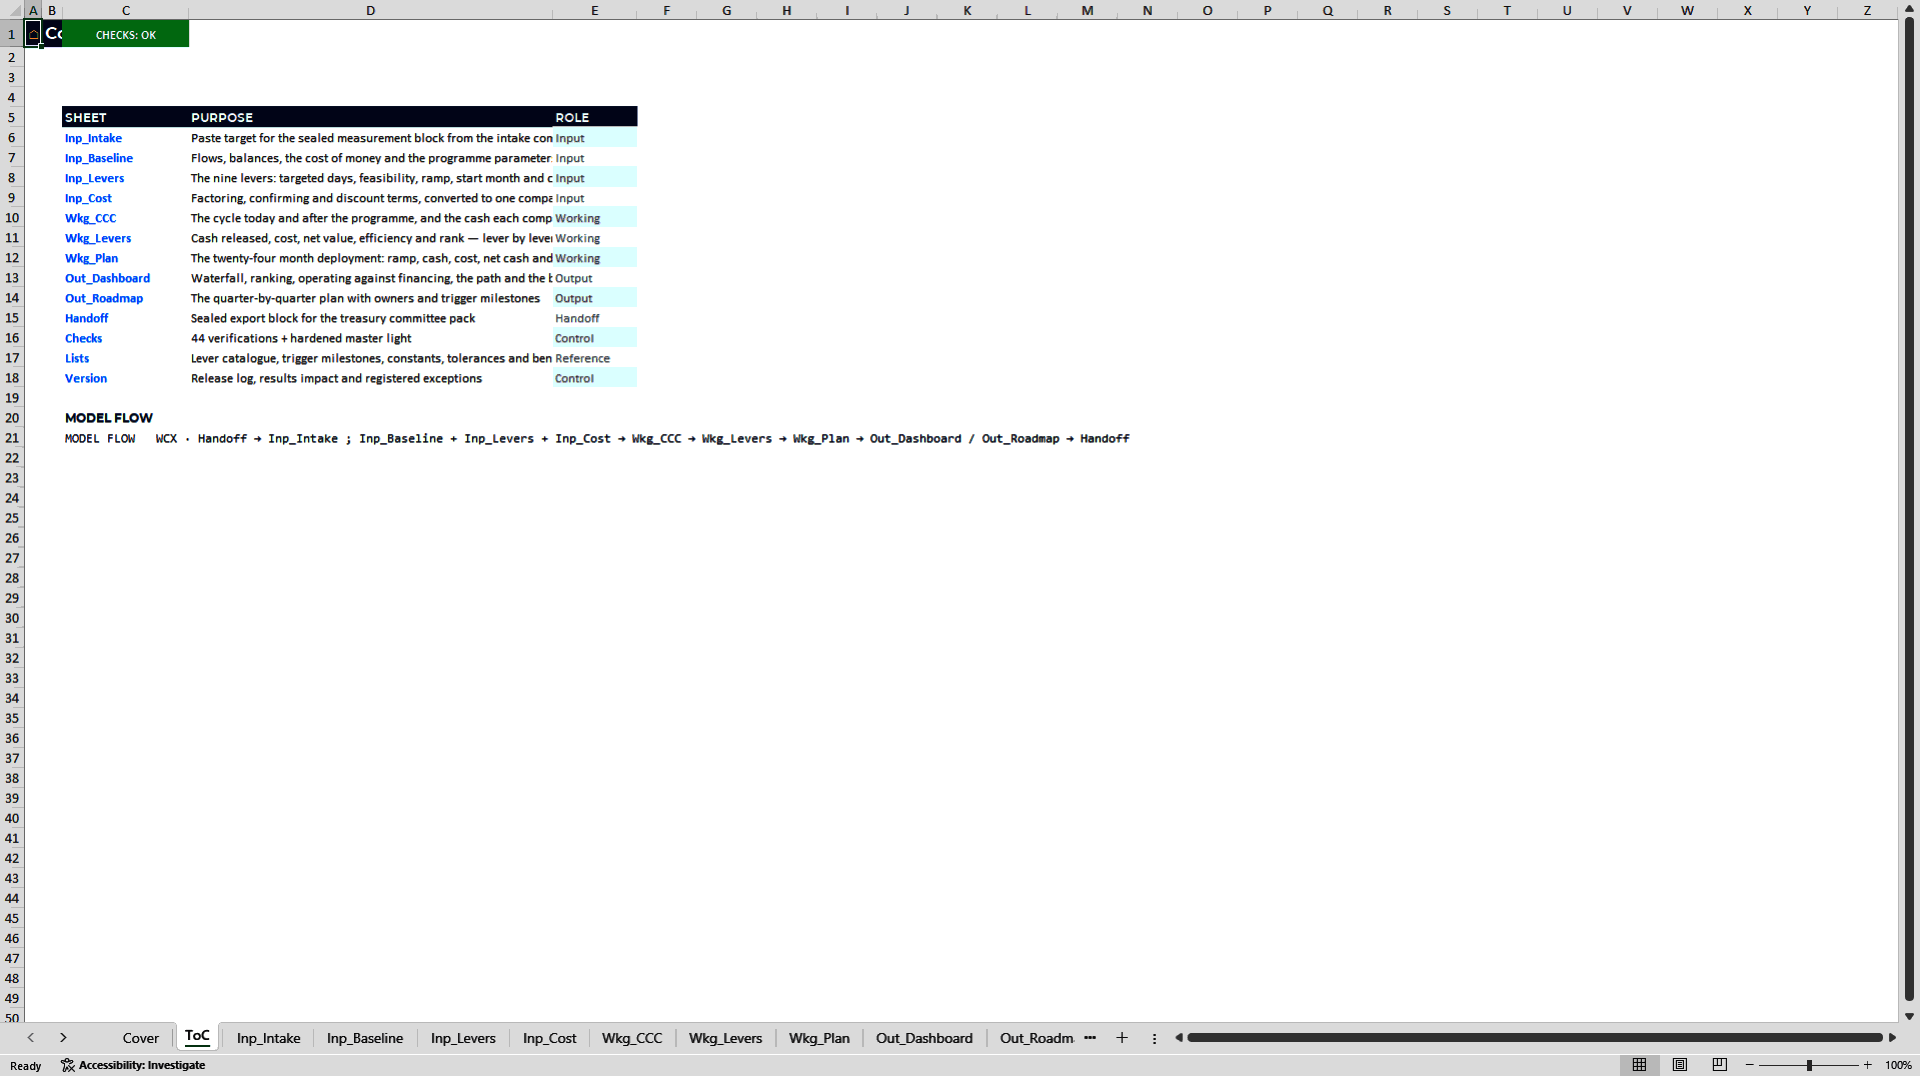
Working Capital Release Model: 15 sheets covering the baseline, lever assumptions, financing quotes, cash-conversion-cycle calculations, ranking, dashboard and roadmap.
Receivables, Payables and Inventory Intake: a 15-sheet companion for organising customer balances and payment behaviour, supplier terms, inventory cover and the measured starting position.
A 70-page PDF user manual explaining the inputs, calculations, transfer between workbooks, controls and interpretation. Both workbooks open with a populated industrial-distribution example so you can follow the sequence before replacing the inputs.
WHO THIS IS FOR
CFOs, controllers, treasurers and working-capital programme leads can use the package to prepare a quantified programme for management review. Receivables, procurement and inventory owners can contribute their own evidence, costs and delivery assumptions. Advisers can adapt the files for a client's planning process.
HOW TO USE THE PACKAGE
1. Prepare the intake. Enter annual sales, cost of goods sold, purchases, balance-sheet positions and twelve months of revenue. Add customer ageing, contractual terms and actual payment days; supplier balances and terms; and inventory values, annual cost flows and target cover by family.
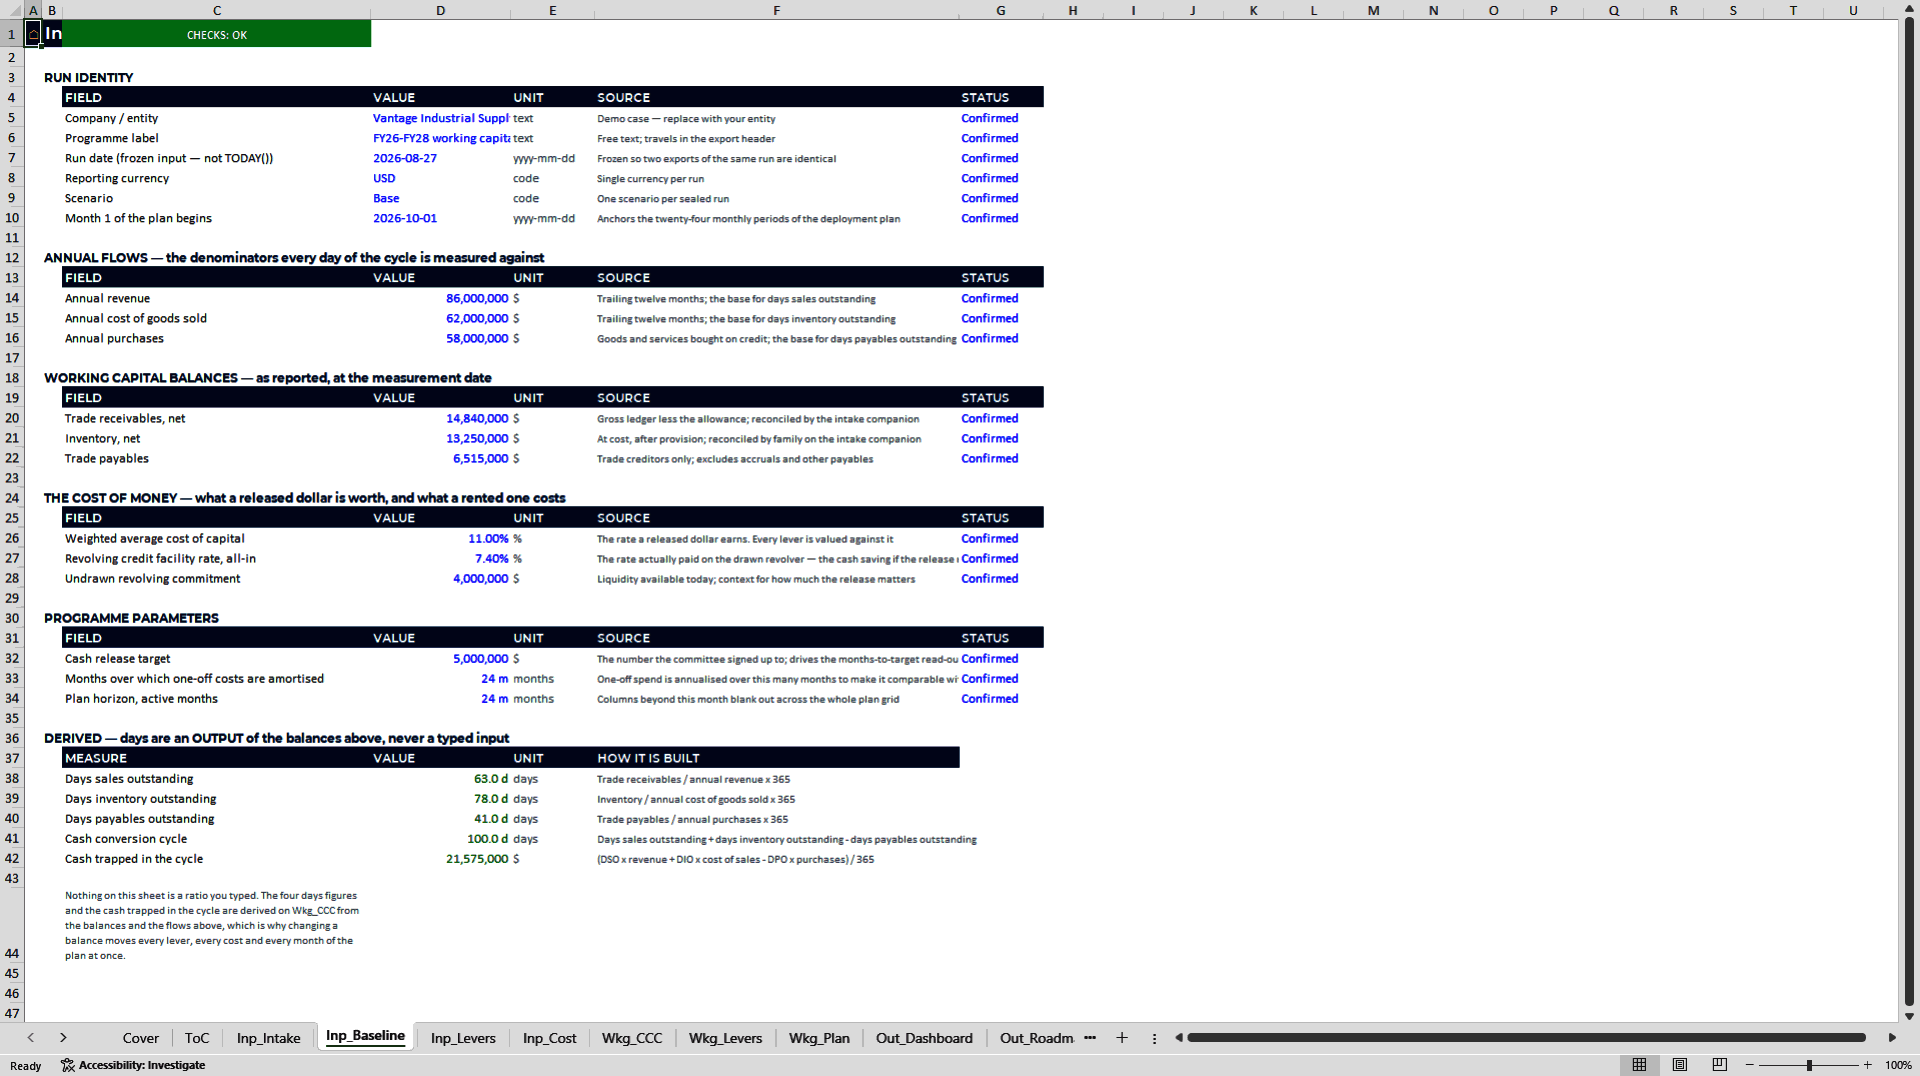
2. Review the measured position. Compare simple and countback days sales outstanding, overdue balances, supplier-term headroom and inventory above the entered cover targets. Check that the intake reconciles to the balances and annual flows.
3. Transfer the measurement block into the release model using paste as values. Set the reporting currency, cash target, financing assumptions and plan dates. This is a documented manual transfer between local files.
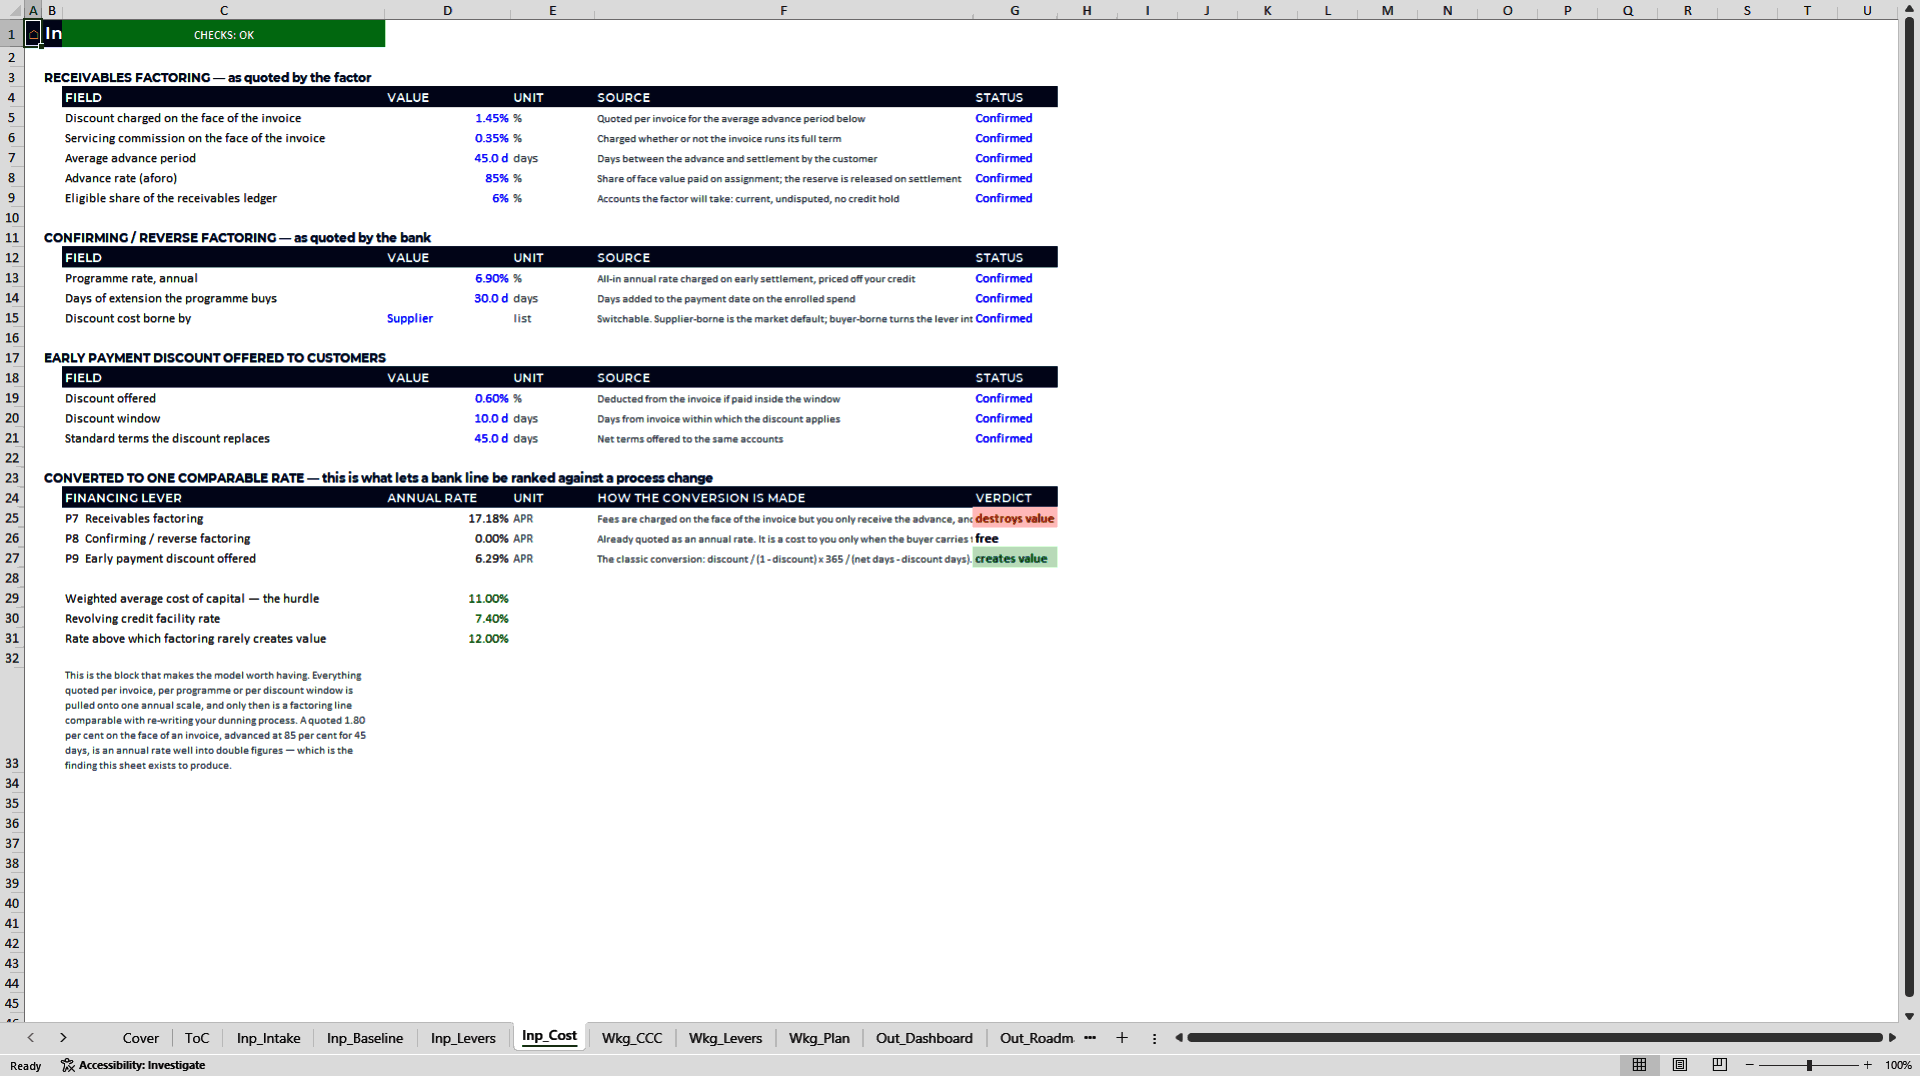
4. Compare the nine levers. Enter target days, feasibility, implementation costs, recurring costs, owners, start months and ramp periods. Financing quotes are entered in their quoted form and converted into annual rates for comparison.
5. Review the checks, ranking and monthly plan. Use the dashboard and roadmap to discuss expected cash release, costs, economic value, timing and the assumptions that need further work before approval.
THE NINE LEVERS
The operating levers cover collections discipline, invoicing cycle time, customer-term renegotiation, supplier-term extension, SKU rationalisation and safety-stock optimisation. The financing levers cover receivables factoring, confirming or reverse factoring, and early-payment discounts offered to customers.
CAPACITY AND COMPATIBILITY
The supplied intake has 13 customer rows and 13 supplier rows, intended for the twelve largest accounts plus an aggregated remainder, and ten inventory-family rows. The release model contains nine lever rows and a plan of up to 24 months. Larger datasets require aggregation or extending the relevant ranges and checking the calculations again.
The package is designed for Microsoft Excel 2019 and Microsoft 365 desktop. Both files have visible sheets, editable assumptions, no macros and no external workbook links.
SCOPE AND LIMITATIONS
This is a working-capital planning model, not a weekly cash-flow forecast or a live accounting system. Users enter and validate the data; there is no automatic ERP connection. Checks flag inconsistencies and selected opportunity limits, but do not negotiate terms or implement actions. The example illustrates the model's operation; it is not a customer result or a promise of cash release. Review the previews to check the scope before purchasing.
Got a question about the product? Email us at support@flevy.com or ask the author directly by using the "Ask the Author a Question" form. If you cannot view the preview above this document description, go here to view the large preview instead.
Source: Best Practices in Working Capital Management Excel: Working Capital Release Model: Nine Levers in Excel Excel (XLSX) Spreadsheet, ExpertPro Consulting
ABOUT THE AUTHOR

ExpertPro is an advisory firm that builds the financial and decision infrastructure behind capital projects. Our work sits at the intersection of project finance, engineering economics and data: we model, stress-test and document infrastructure investments so that sponsors, lenders and investment committees can decide on evidence rather than intuition.
The practice is led by Eduard Kofman, .
... [read more]
Ask the Author a Question
You must be logged in to contact the author.