
Veterinary Imaging Center Financial Model – Excel XLSX
Excel (XLSX)
BENEFITS OF THIS DOWNLOADABLE EXCEL DOCUMENT
- Enables thorough financial forecasting and performance analysis for veterinary imaging centers, facilitating precise budgeting and strategic planning.
- Features a robust tool with specialized tabs for data entry, detailed calculations, and visual representations of financial metrics, making financial evaluations more efficient.
- Includes diverse revenue sources from veterinary imaging services, image archiving, and consultation fees, supporting business growth and long-term viability.
INTEGRATED FINANCIAL MODEL EXCEL DESCRIPTION
This financial model is meticulously designed to analyze and forecast the financial performance of veterinary imaging centers, specializing in diagnostic imaging services for animals. It focuses exclusively on veterinary diagnostic imaging services, including common modalities such as X-rays, ultrasounds, CT scans, and MRIs.
The model delivers a 5-year forecast horizon (60 months) starting from the first forecast month defined in the assumptions tab and includes placeholders for up to 36 months of historical financial data. Designed specifically for veterinary imaging centers, the model accommodates revenue streams of diagnostic imaging services and consultation & interpretation fees.
This financial model is an essential resource for internal planning, pricing strategies, investor presentations, and financing applications tailored to veterinary practices.
This Pro version of the financial model focuses on core financial planning and analysis needs, organized into six sections:
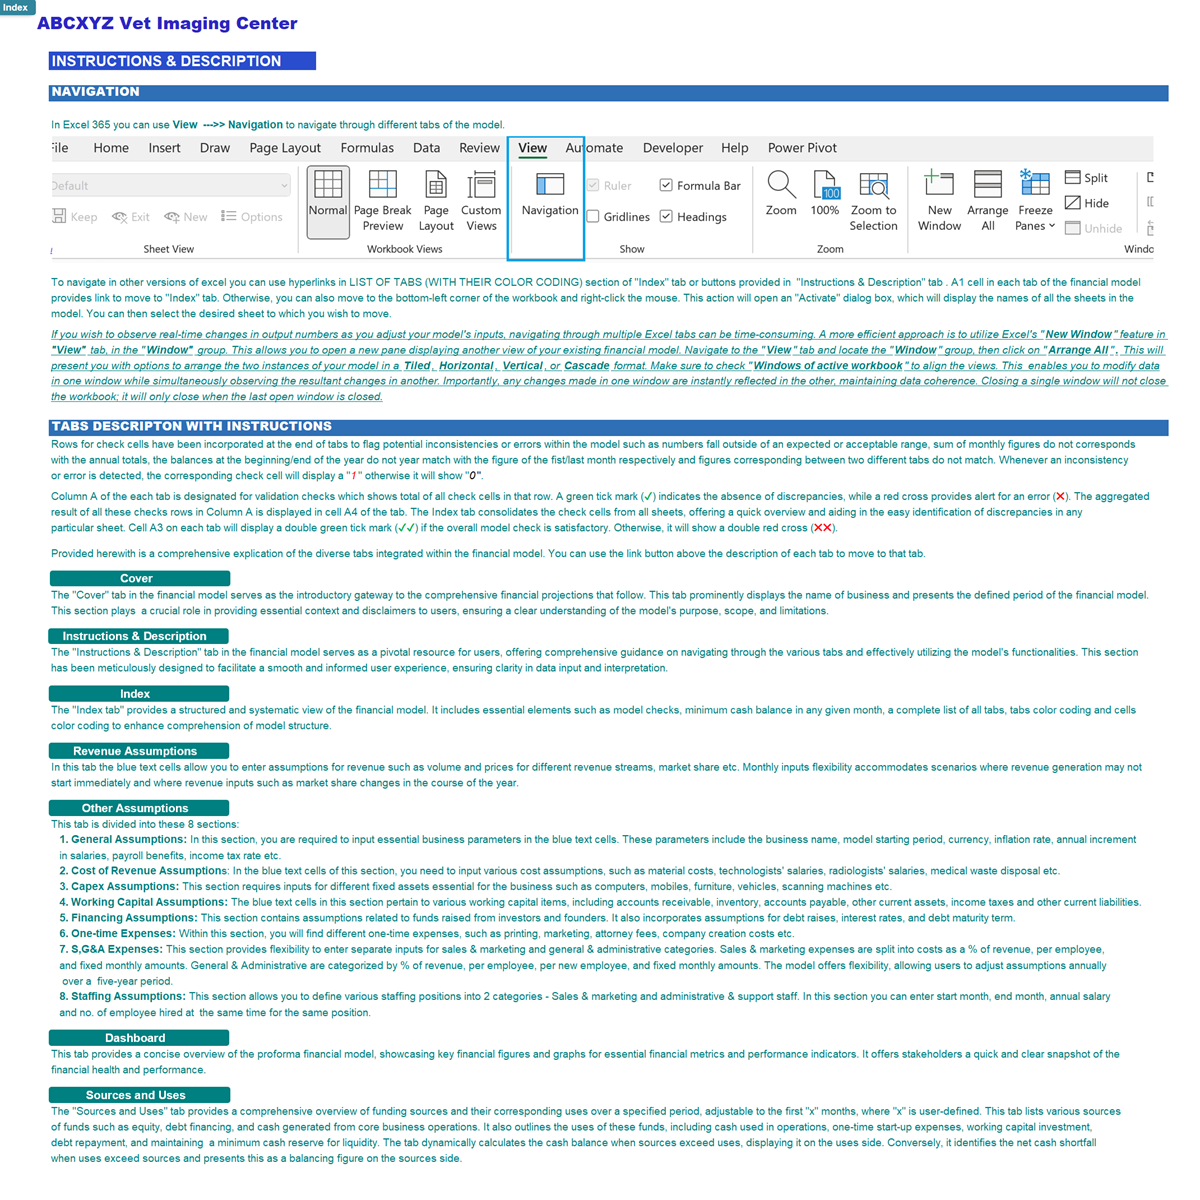
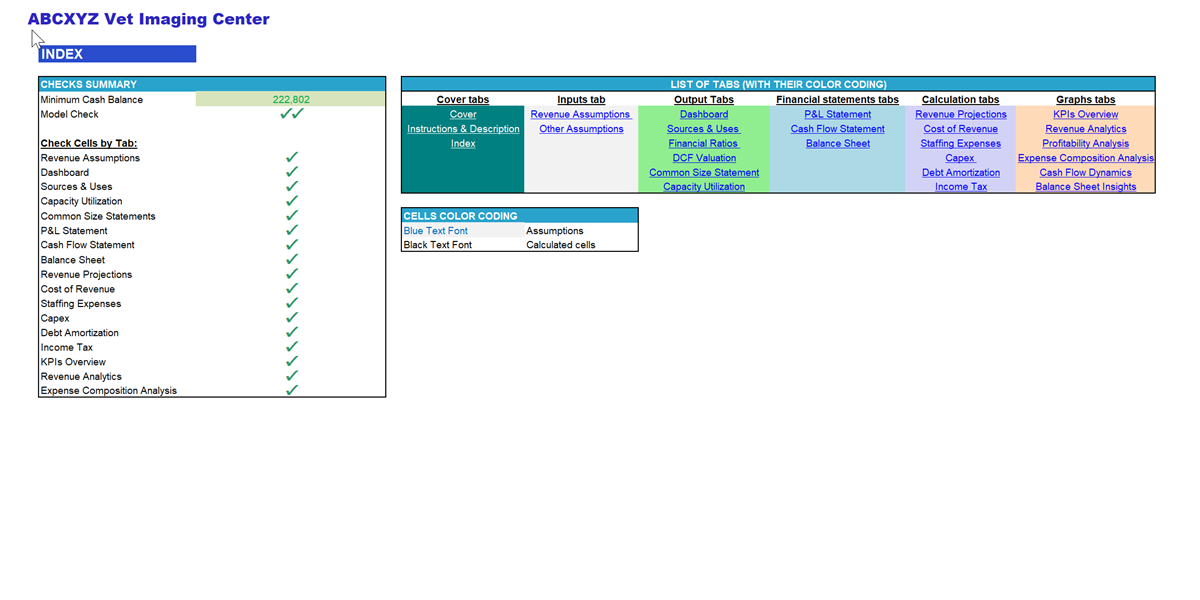
Cover Tabs: Navigation and instructions to guide users through the model.
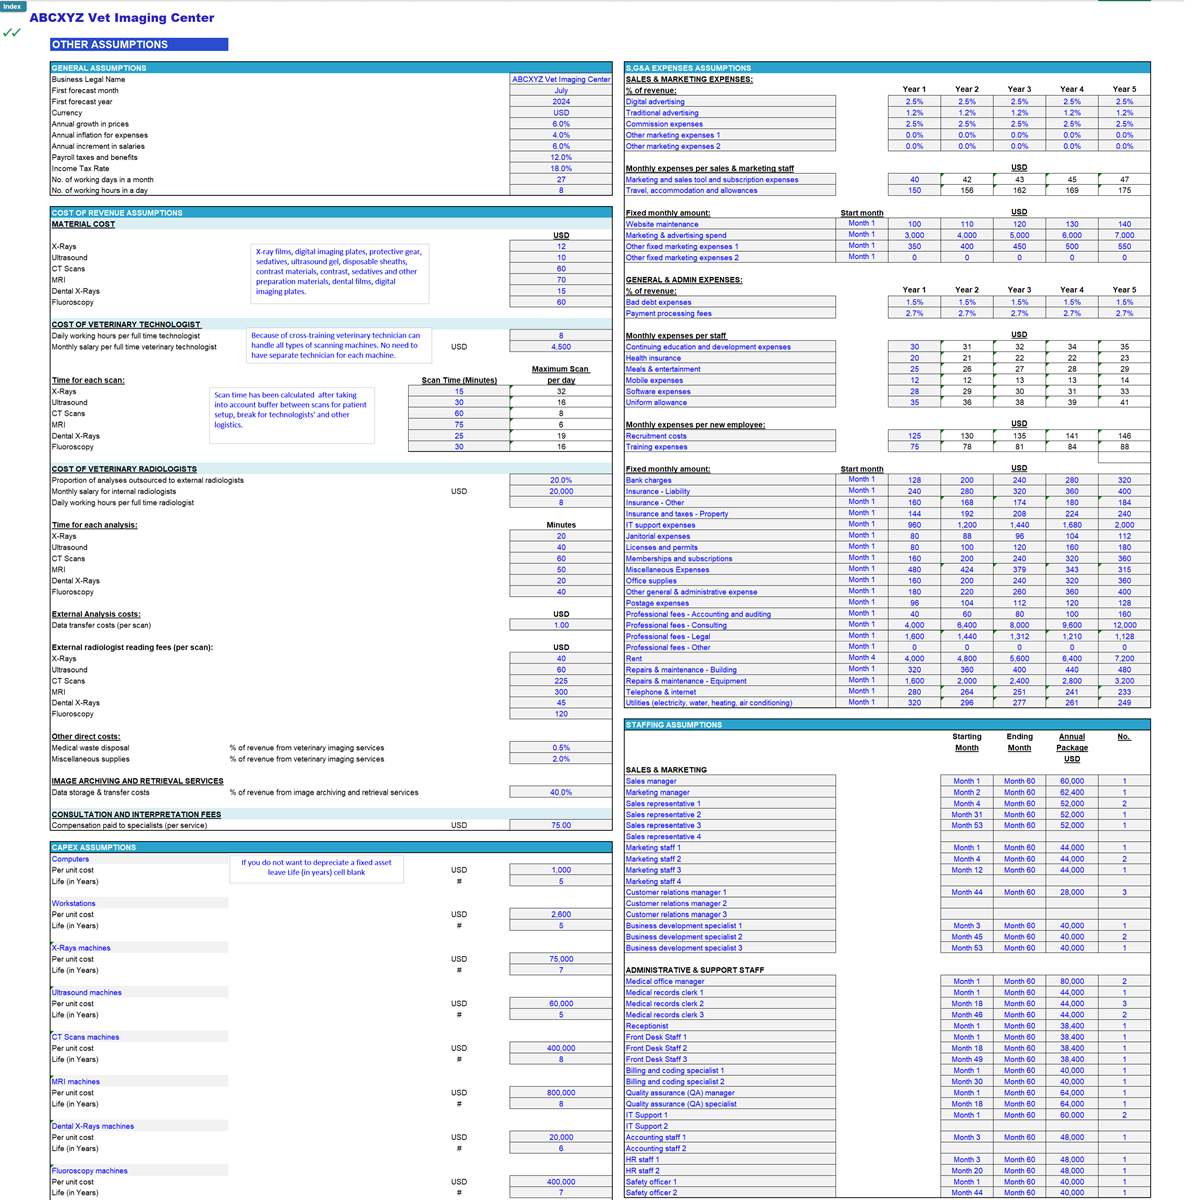
• Input Tab: Customizable assumptions, including:
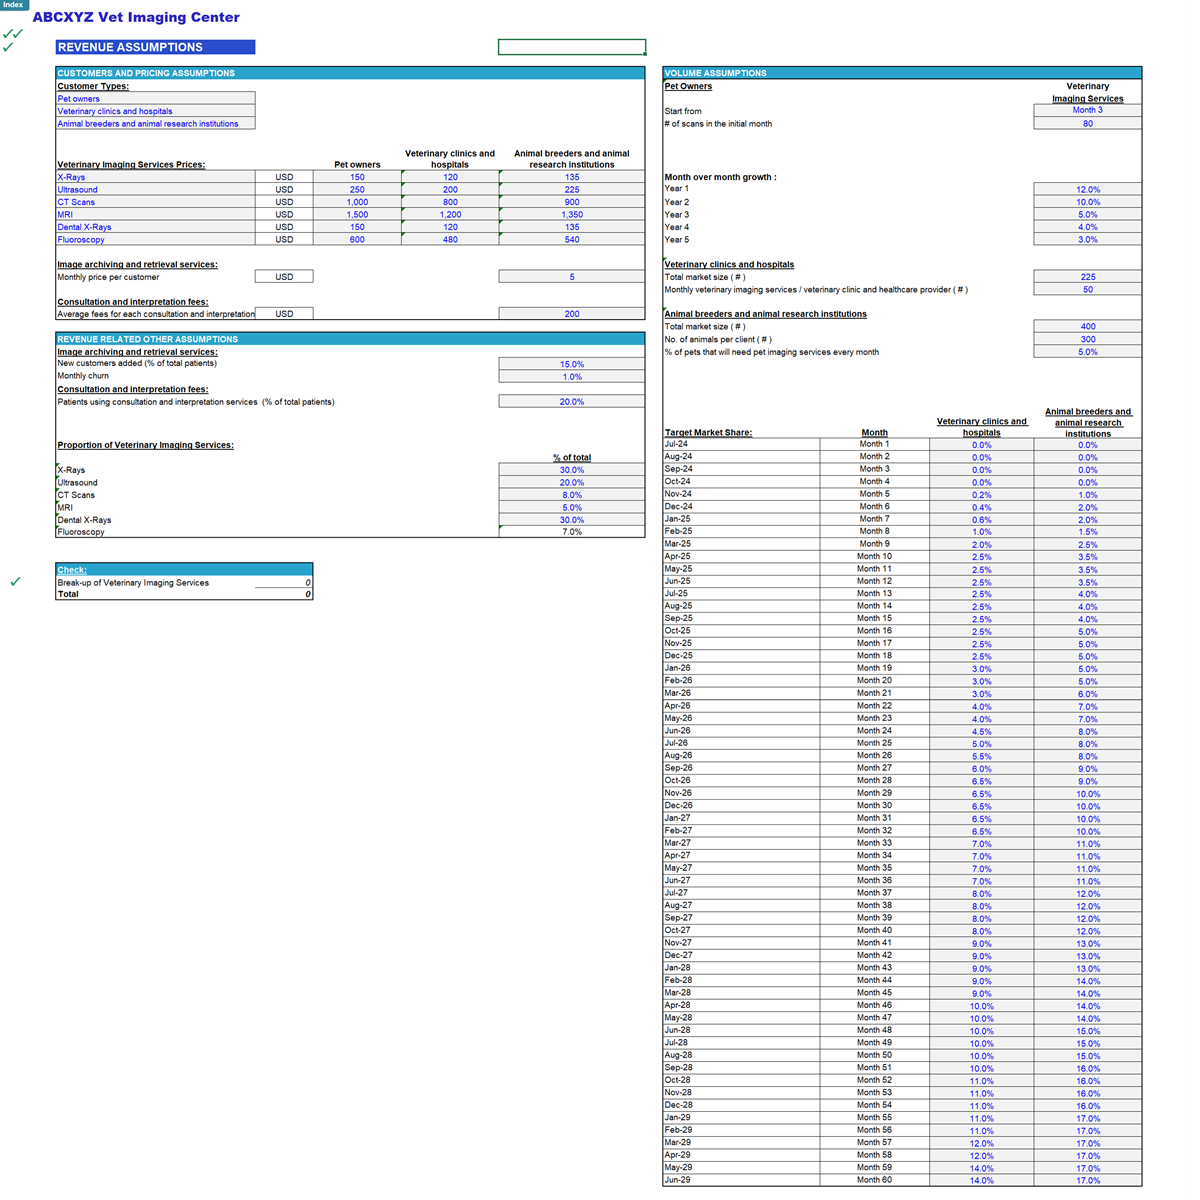
1. Revenue Assumptions: Key drivers for revenue streams (e.g., imaging scans and consultation & interpretation fees), volume, growth, number of different types of scanning machines installed, capacity utilization etc.
2. General Assumptions: Foundational parameters such as business name, start date, currency, inflation rates, payroll taxes, and income tax.
3. Cost of Revenue Assumptions: Direct costs, including material costs, veterinary technologists' salaries, radiologists' fees, and external veterinary consultant fees.
4. S,G&A Expenses: Administrative and sales/marketing expenses (e.g., rent, utilities, employee salaries), with flexible inputs as fixed amounts or percentages of revenue.
5. CapEx Assumptions: Inputs for capital expenditures on diagnostic machines (e.g., ultrasound, X-ray, CT, MRI) and other equipment, along with depreciation schedules.
6. Working Capital Assumptions: Parameters for managing short-term financial health, such as accounts receivable/payable, minimum cash reserves, and inventory turnover.
7. Financing & One-Time Expenses: Inputs for loan terms, interest rates, and fundraising activities, as well as start-up costs like legal fees, initial marketing, and equipment installation expenses.
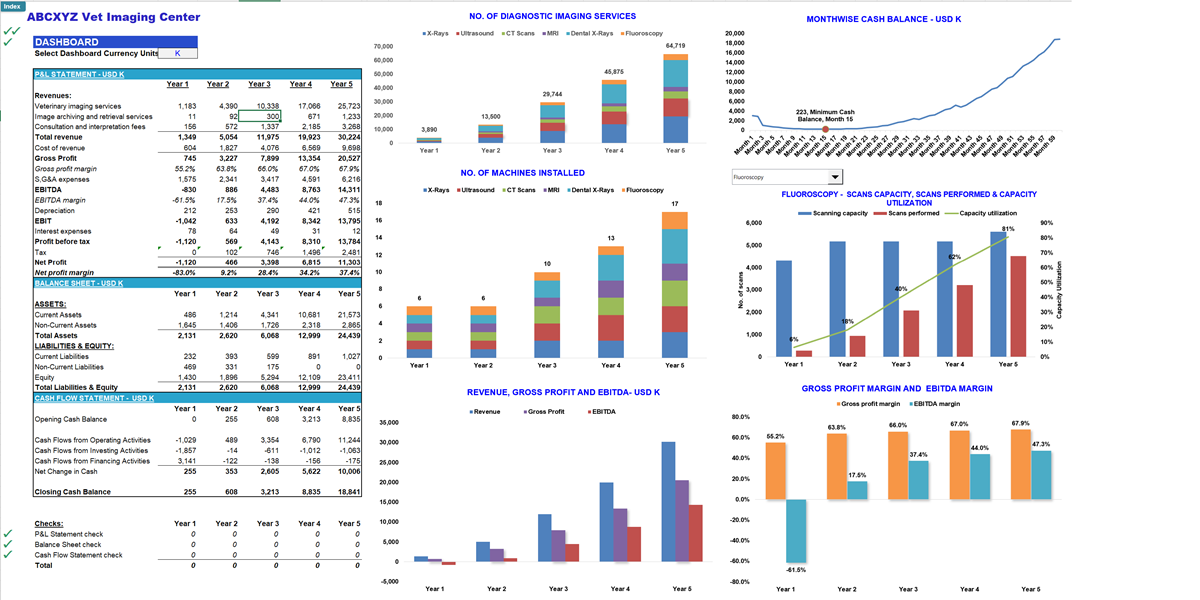
• Output Tabs: Summarizes key financial metrics, including:
• Dashboard
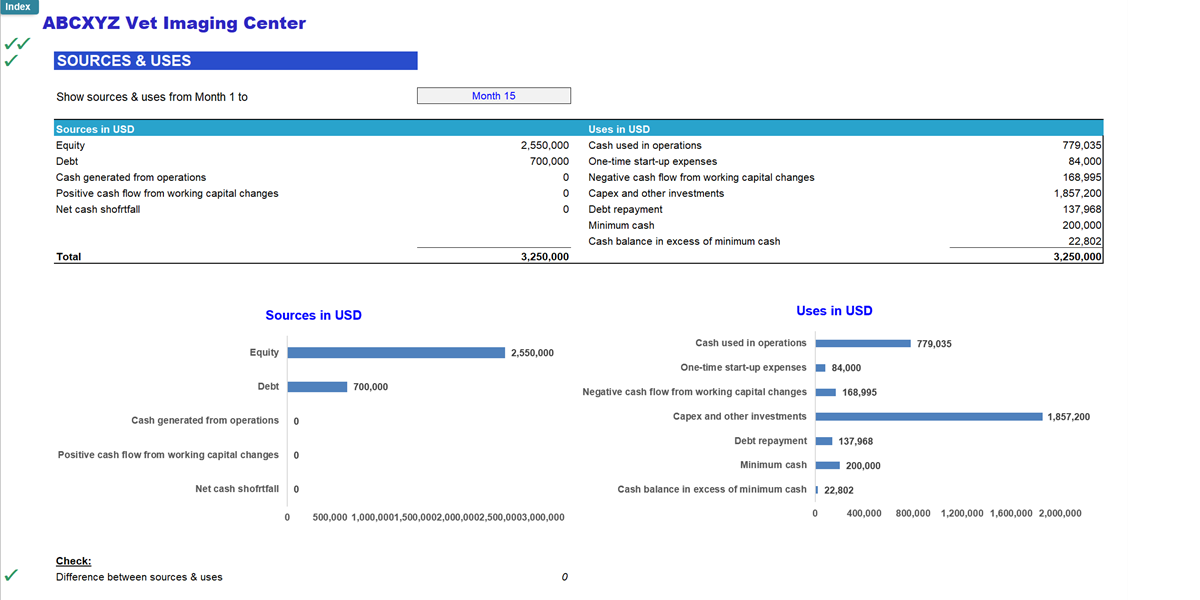
• Sources & Uses
• Financial Ratios
• Profitability Analysis
• Cash Flow Analysis
• Financial Statements Tabs: Provides detailed monthly and annual views of:
• Profit & Loss Statement
• Cash Flow Statement
• Balance Sheet
• Calculation Tabs: The backbone of the model, containing detailed projections for:
• Revenue and Cost of Revenue
• Staffing Expenses
• CapEx
• Financing
• Advanced Analysis Tabs:
• Valuation calculations
• Extended insights into key performance indicators (KPIs)
• Detailed revenue analytics
• Expense breakdowns
• Common Size P&L
For users seeking straightforward financial planning, the Lite version of the model, available on this platform, provides all essential features and is fully capable of meeting core financial modeling needs. By excluding the Advanced Analysis tabs, it is an excellent choice for those who do not require deeper insights into business performance.
Technical Specifications
• No VBA or Macros: Ensures compatibility and ease of use.
• Circular Reference-Free: Reliable calculations without iterative dependencies.
• Excel Compatibility: Fully functional in Microsoft Excel 2010 and later versions.
Validation Checks
The model includes built-in validation checks to ensure accuracy. Validation summaries are displayed in individual tabs and aggregated in the Index tab for a quick overview. Green ticks (✓) indicate no issues, while red crosses (✗) highlight areas requiring attention.
Why Choose This Model?
This model is an all-in-one financial planning tool for veterinary imaging center businesses, offering detailed projections, advanced analysis, and user-friendly functionality. Whether you're presenting to investors, applying for loans, or conducting internal analysis, the Pro version equips you with the tools needed to make informed and strategic decisions. Its flexibility, depth, and accuracy make it an indispensable resource for financial planning and performance evaluation.
For any custom solutions or technical support, our team is available to assist in tailoring the model to your specific requirements
Got a question about the product? Email us at support@flevy.com or ask the author directly by using the "Ask the Author a Question" form. If you cannot view the preview above this document description, go here to view the large preview instead.
Source: Best Practices in Integrated Financial Model Excel: Veterinary Imaging Center Financial Model Excel (XLSX) Spreadsheet, ExcelFinModels
ABOUT THE AUTHOR
I am a finance professional with over 15 years of experience in financial modeling, analysis, planning, budgeting, and forecasting on various freelancing platforms. I have assisted over 500 start-ups and SMBs across diverse industries in securing over $1 billion in funding, internal planning, financial reporting, and strategy formulation. Additionally, I have provided services to numerous ... [read more]
Ask the Author a Question
You must be logged in to contact the author.
