
Scenario Analysis 3-Statement Projection Excel Model – Excel XLSX
Excel (XLSX)
BENEFITS OF THIS DOWNLOADABLE EXCEL DOCUMENT
- Scenario Analysis for 3 Statement Projections.
INTEGRATED FINANCIAL MODEL EXCEL DESCRIPTION
Scenario Analysis (3-Statement) is essential for financial planning. It assesses the impact of various scenarios on a company's income statement, balance sheet, and cash flow statement. This helps in preparing for different economic conditions, optimizing decision-making, and managing risk. Businesses can use it to stress-test their financial resilience and adapt strategies accordingly. Investors gain insights into a company's ability to weather uncertainties. It's a valuable tool for strategic planning, ensuring financial stability, and making informed investment decisions in an ever-changing business environment.
PURPOSE OF MODEL
User-friendly Excel model for the preparation of a 3 statement (Income Statement, Balance Sheet and Cash flow Statement) financial projection for a generic new or existing business across 3 scenarios (e.g. base, optimistic and pessimistic cases). The model follows best practice financial modelling principles and includes instructions, line item explanations, checks and input validations
KEY OUTPUTS
The model is generic and not industry-specific. The key outputs include:
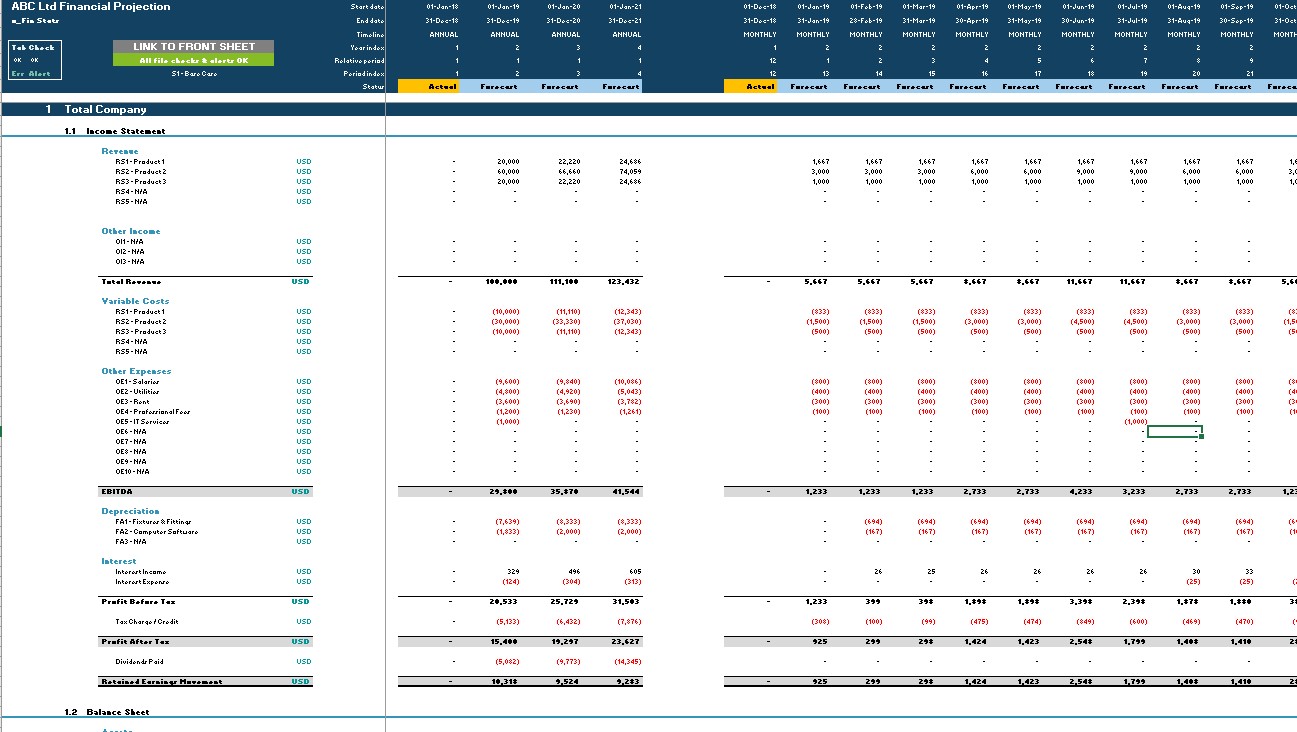
• Projected full financial statements (Income Statement, Balance Sheet and Cash flow Statement) for any of the 3 scenarios, presented on a monthly basis across 3 years and summarised on an annual basis.
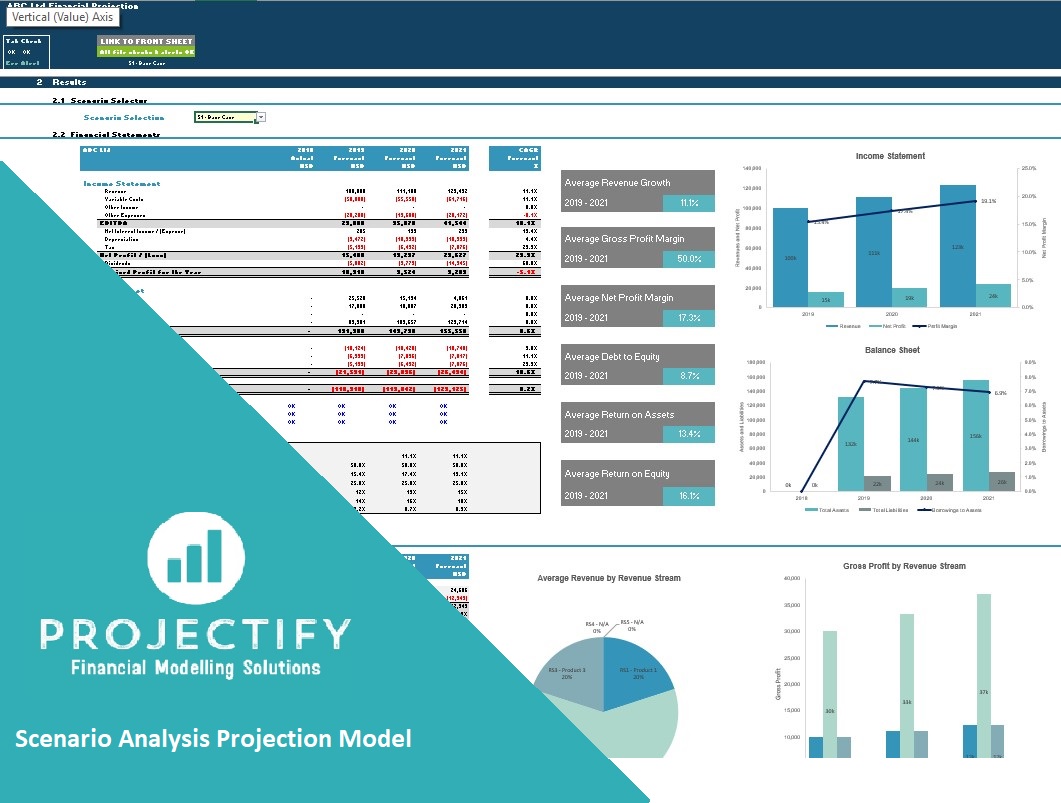
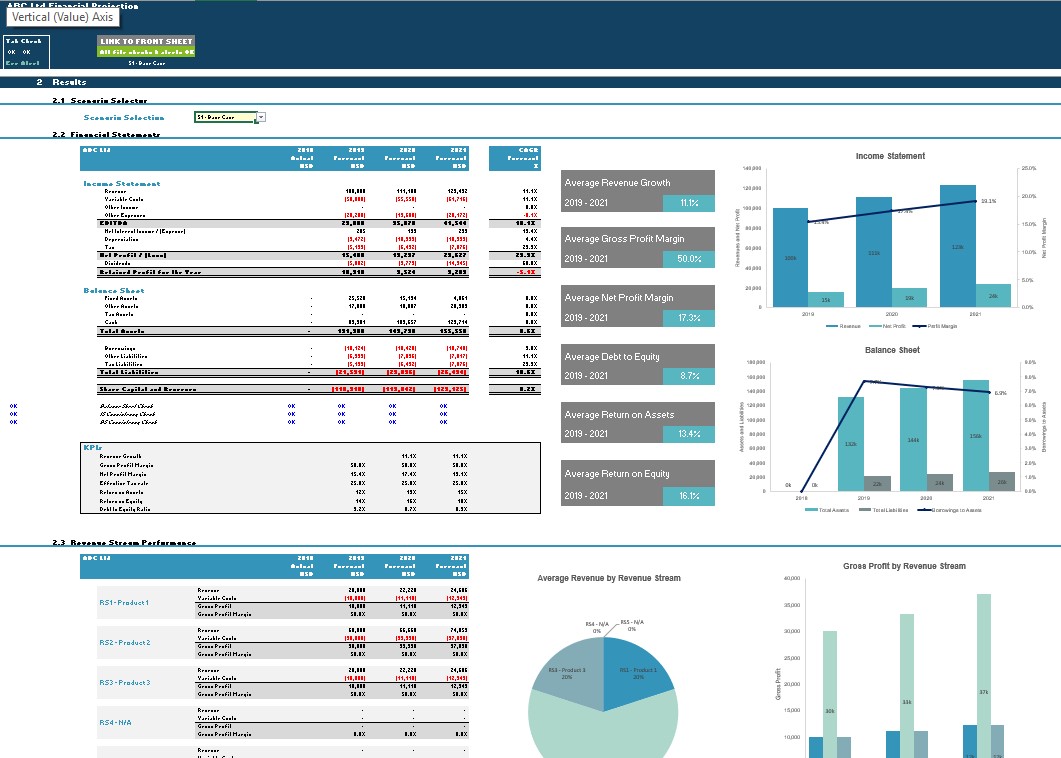
• Dashboard which can be run on any of the 3 scenarios and which includes the following:
Summarised projected Income Statement and Balance Sheet
Compounded Annual Growth rate (CAGR) for each summarised income statement and Balance Sheet line item
List of key metrics including Average revenue growth, Average profit margins, Average return on assets and equity and Average Debt to Equity ratio.
Bar charts summarising income statement and Balance Sheet projections
Gross Profit margin by revenue stream in table and bar-chart format
KEY INPUTS
Inputs are split into Income Statement and Balance Sheet Inputs. All inputs include user-friendly line item explanations and input validations to help users understand what the input is for and populate correctly.
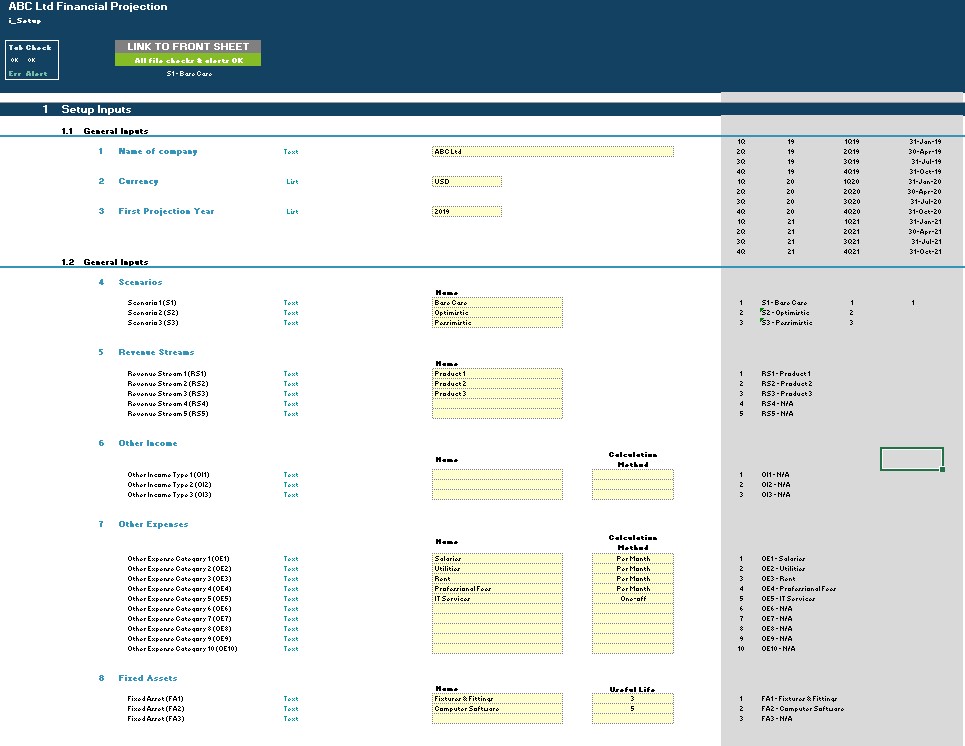
Setup Inputs:
• Name of business
• Currency
• First Projection Year
• Naming for Scenarios, Revenue Streams, Other Income, Other Expenses and Fixed Assets
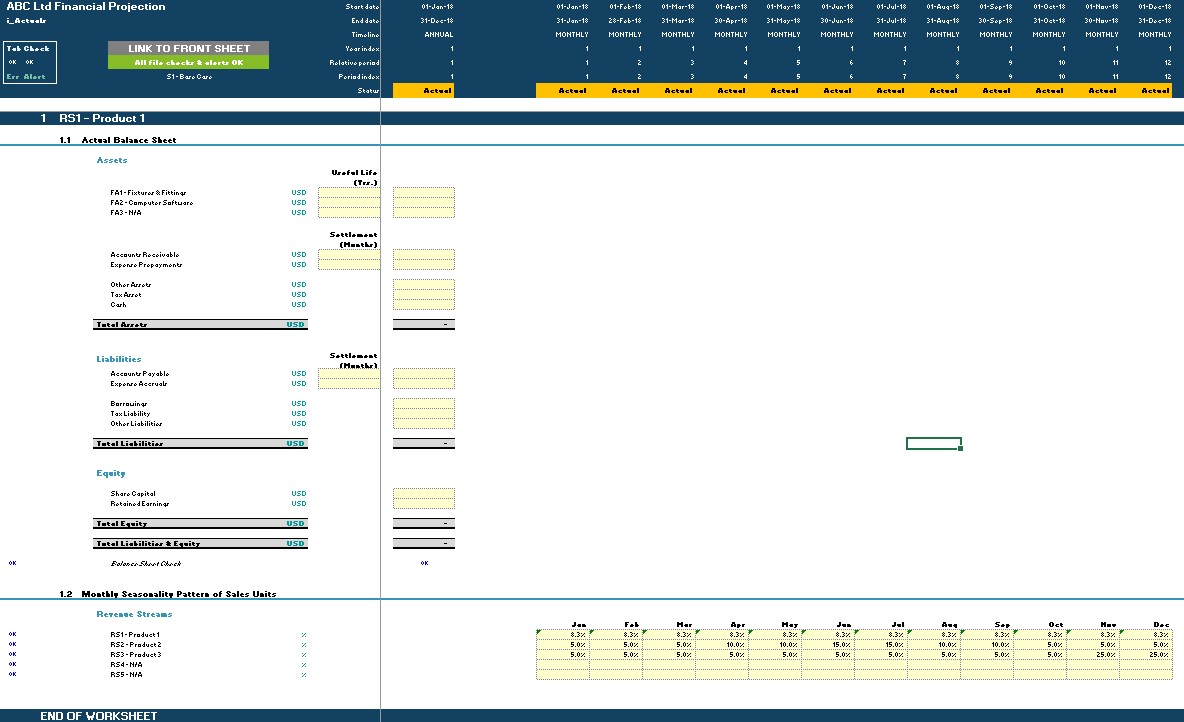
Actuals Inputs:
• Opening Balance Sheet (for existing Businesses)
• Monthly Seasonality patterns for each revenue stream
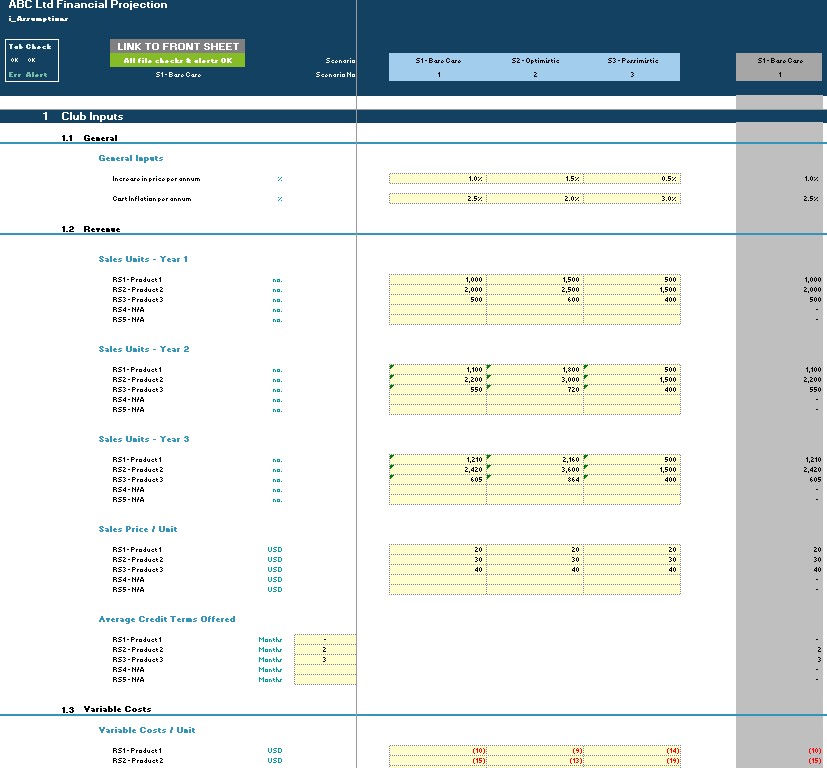
Projection Inputs (for each of the 3 scenarios):
• Revenue inputs including sales volume, sales prices and average credit terms offered;
• Variable cost inputs including variable cost per unit and average credit terms received;
• Other Costs including staff costs, marketing costs and fixed costs;
• Taxation Inputs including rate and payment periods;
• Dividend inputs including amount (percentage of retained earnings) and frequency;
• Cash balance interest rates
• Inflation rates
• Fixed Assets including addition amounts and useful life
• Borrowings including addition amounts and interest rate
• Share Capital additions
MODEL STRUCTURE
The model contains, 8 tabs split into input ('i_'), calculation ('c_'), output ('o_') and system tabs. The tabs to be populated by the user are the input tabs ('i_Setup', ‘i_Actuals' and 'i_Assumptions'). The calculation tab uses the user-defined inputs to calculate and produce the projection outputs which are presented in 'o_Fin Stats' and ‘o_Charts'
System tabs include:
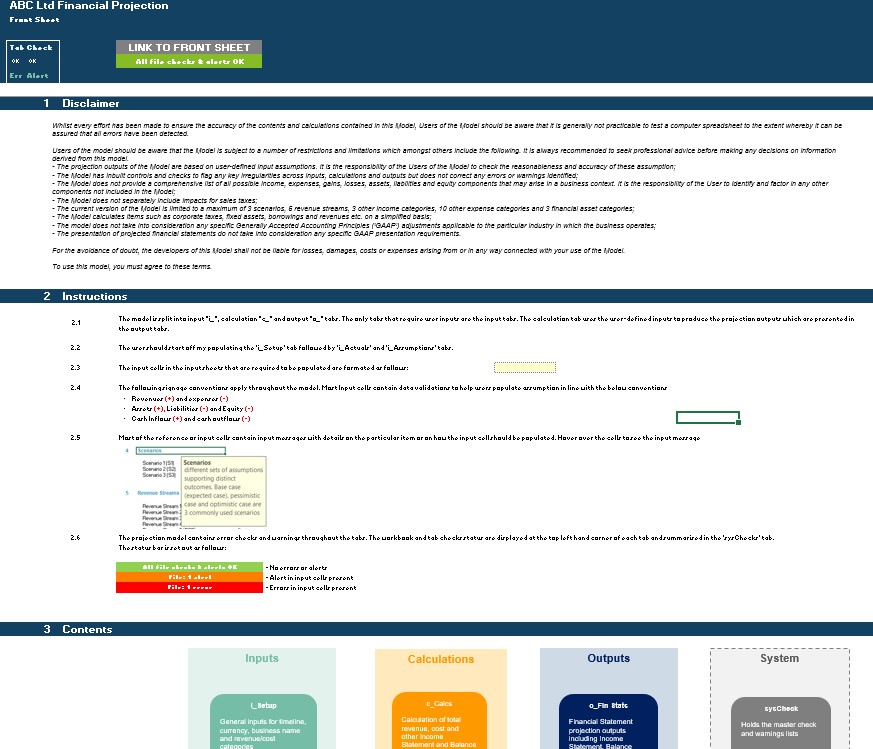
• A 'Front Sheet' containing a disclaimer, instructions and contents;
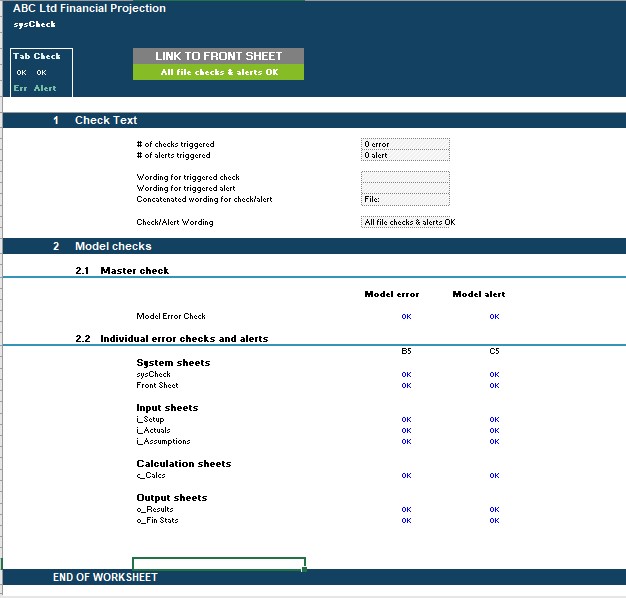
• A Checks dashboard containing a summary of checks by tab.
KEY FEATURES
Other key features of this model include the following:
• The model follows best practice financial modelling guidelines and includes instructions, line item explanations, checks and input validations;
• The model allows for a 3-year projection on a monthly basis and summarised on an annual basis for both new and existing businesses;
• The model allows the user to model 3 separate revenue streams on a Price x Volume basis;
• Costs are split into: variable and other costs. Other costs can be input on a per unit, per month or one-off basis for better driver-based forecasting;
• Apart from projecting revenue and costs the tool includes the possibility to model receivables and payables, fixed assets, borrowings, dividends and corporate tax;
• Business Name, currency, starting projection period are fully customisable
• Revenue, Cost and Fixed Asset descriptions are fully customisable;
• The model includes instructions, line item explanations, checks and input validations to help ensure input fields are populated accurately;
• The model includes a checks dashboard which summarises all the checks included in the various tabs making it easier to identify any errors.
Got a question about the product? Email us at support@flevy.com or ask the author directly by using the "Ask the Author a Question" form. If you cannot view the preview above this document description, go here to view the large preview instead.
Source: Best Practices in Integrated Financial Model Excel: Scenario Analysis 3-Statement Projection Excel Model Excel (XLSX) Spreadsheet, Projectify
ABOUT THE AUTHOR
We are financial modelling professionals, accountants and CFA charterholders with experience working within Deloitte supporting clients with their financial planning and decision support needs. Our aim is to provide robust and easy-to-use financial models that follow good practice financial modelling guidelines and assist individuals and businesses with key financial planning and analysis ... [read more]
Ask the Author a Question
You must be logged in to contact the author.
