
 Click main image to view in full screen.
SaaS & Subscription ARR Bridge, NRR/GRR & Churn Model – Excel XLSX
Excel (XLSX) + supplemental PDF


BENEFITS OF THIS DOWNLOADABLE EXCEL DOCUMENT
- Produces a board-ready ARR walk that reconciles on every month and every quarter, with win-back kept separate from new business.
- Measures net and gross revenue retention three independent ways, including a dollar-weighted cohort curve.
- Computes quick ratio, magic number, Rule of 40, burn multiple and ARR per employee quarter by quarter, with eleven integrity checks behind them.
SAAS EXCEL DESCRIPTION
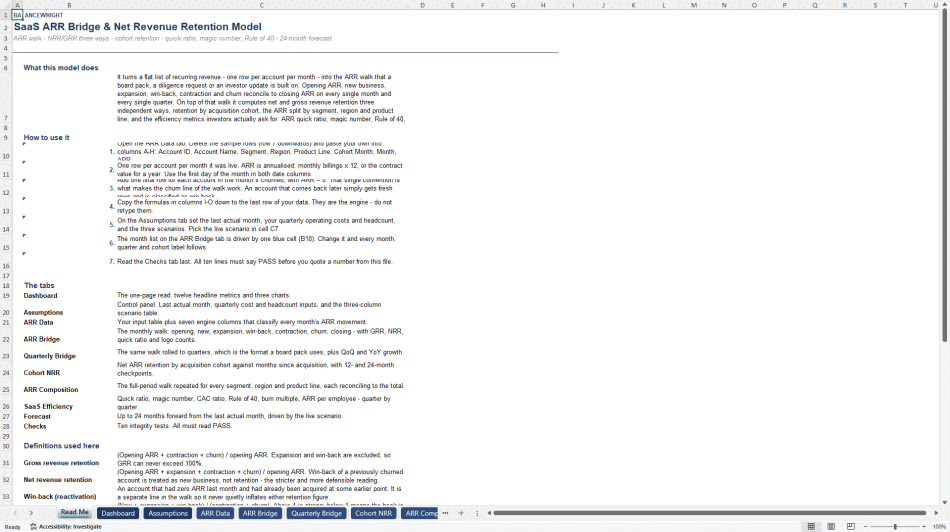
Every board pack, every diligence request and every investor update for a subscription business begins with the same table: where did ARR start the period, what was added, what was lost, and where did it end. Building that table so it actually reconciles – monthly and quarterly, across segments, with expansion and win-back kept apart from new business – is a day of careful work, and the mistakes it hides are quiet ones.
This workbook is that table, built once and built properly. Give it one row per account per month with the account's ARR, and it returns the whole picture.
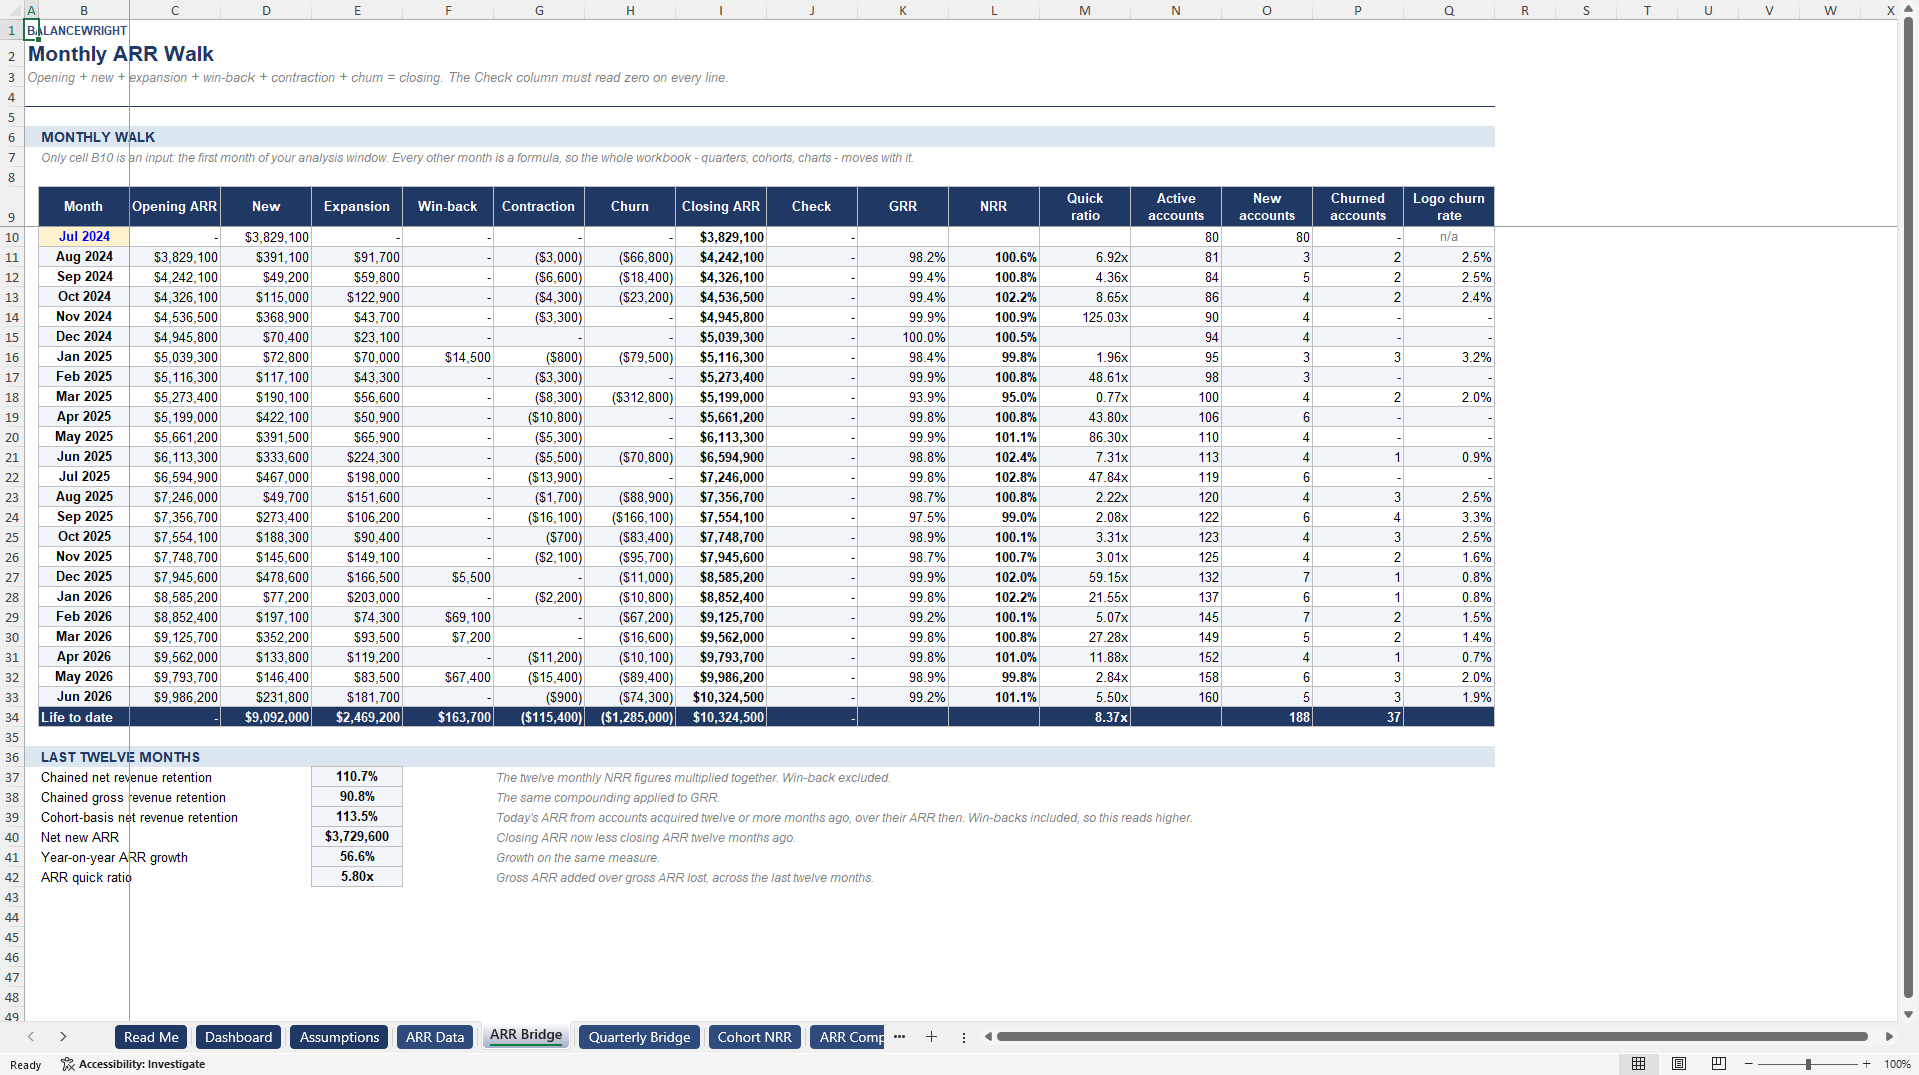
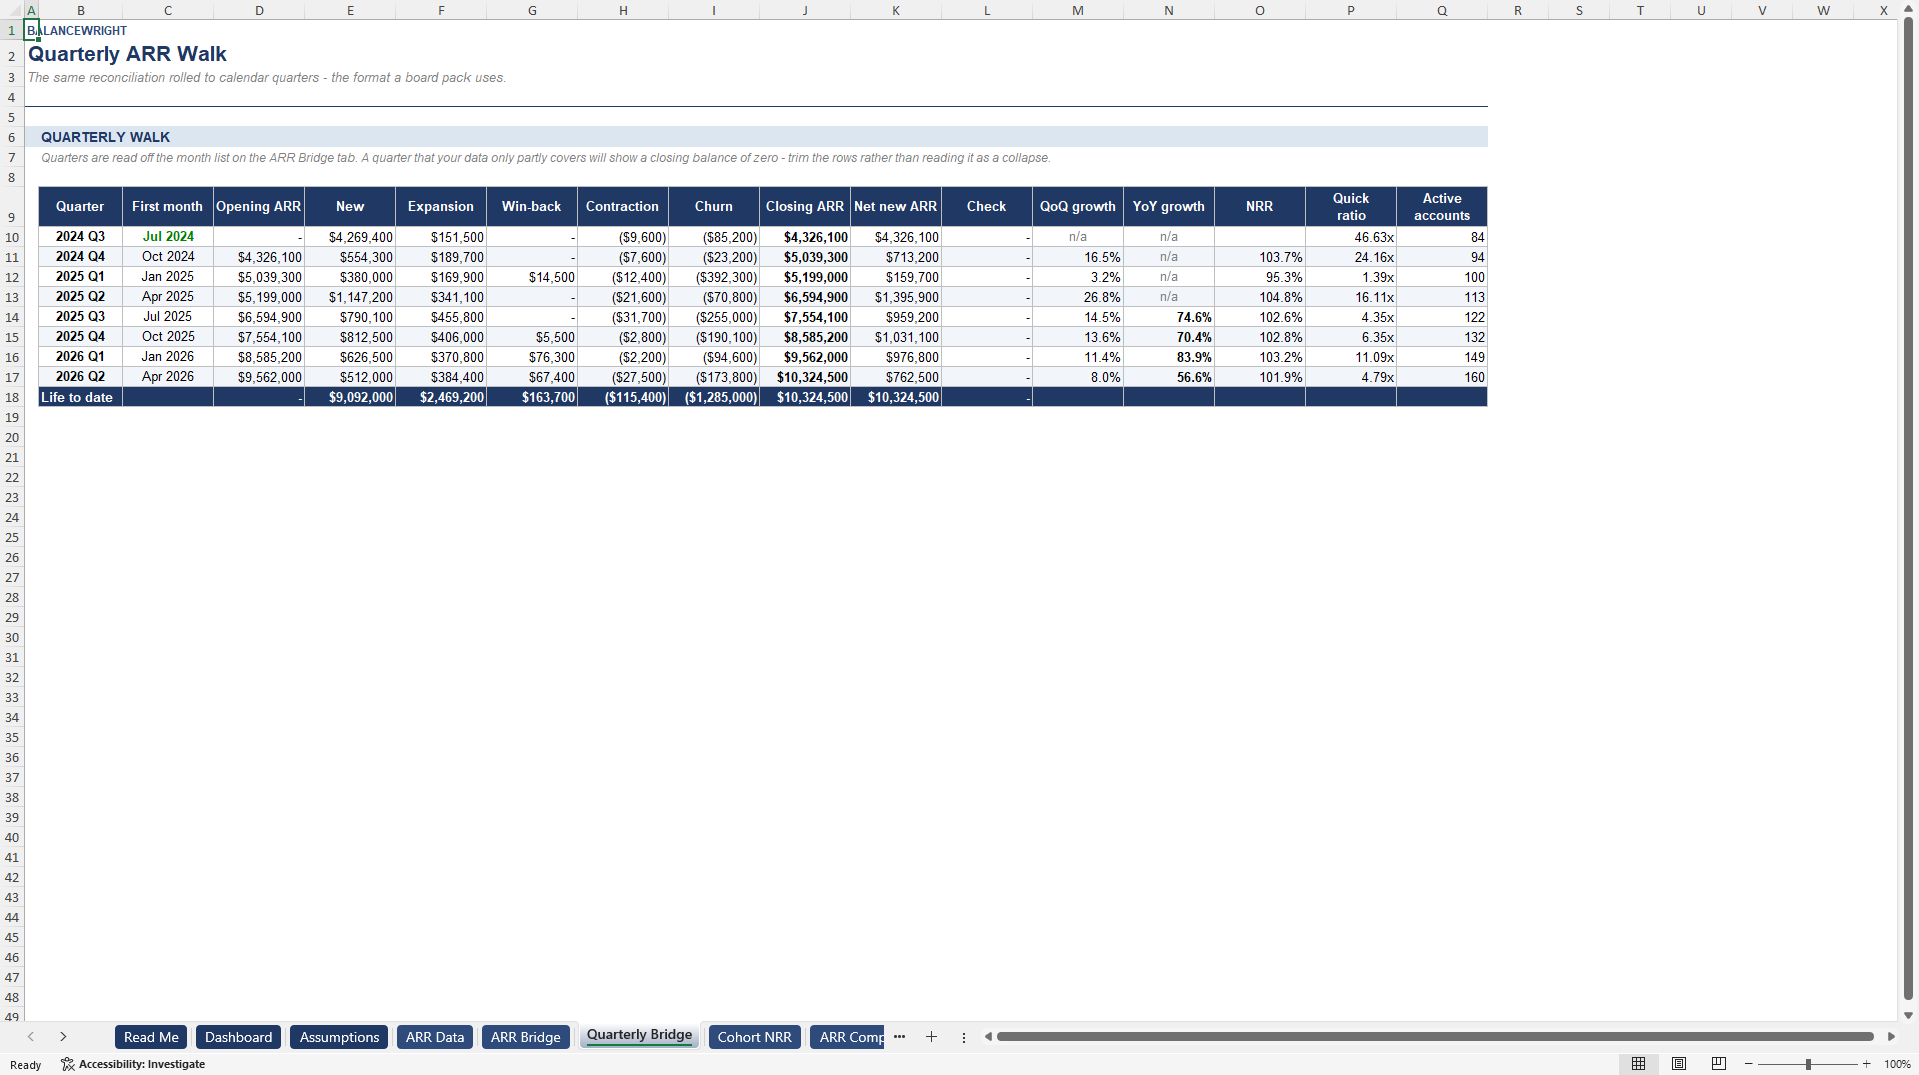
THE ARR WALK, MONTHLY AND QUARTERLY. Opening ARR, new business, expansion, win-back, contraction and churn reconciling to closing ARR on every single month and every single quarter. Six movement lines, not four: win-back is a separate line, so recovering a lapsed account never quietly inflates your retention figures. A dedicated Check column proves each line ties, and the quarterly roll-up is computed independently of the monthly one so an aggregation error cannot hide inside a quarter.
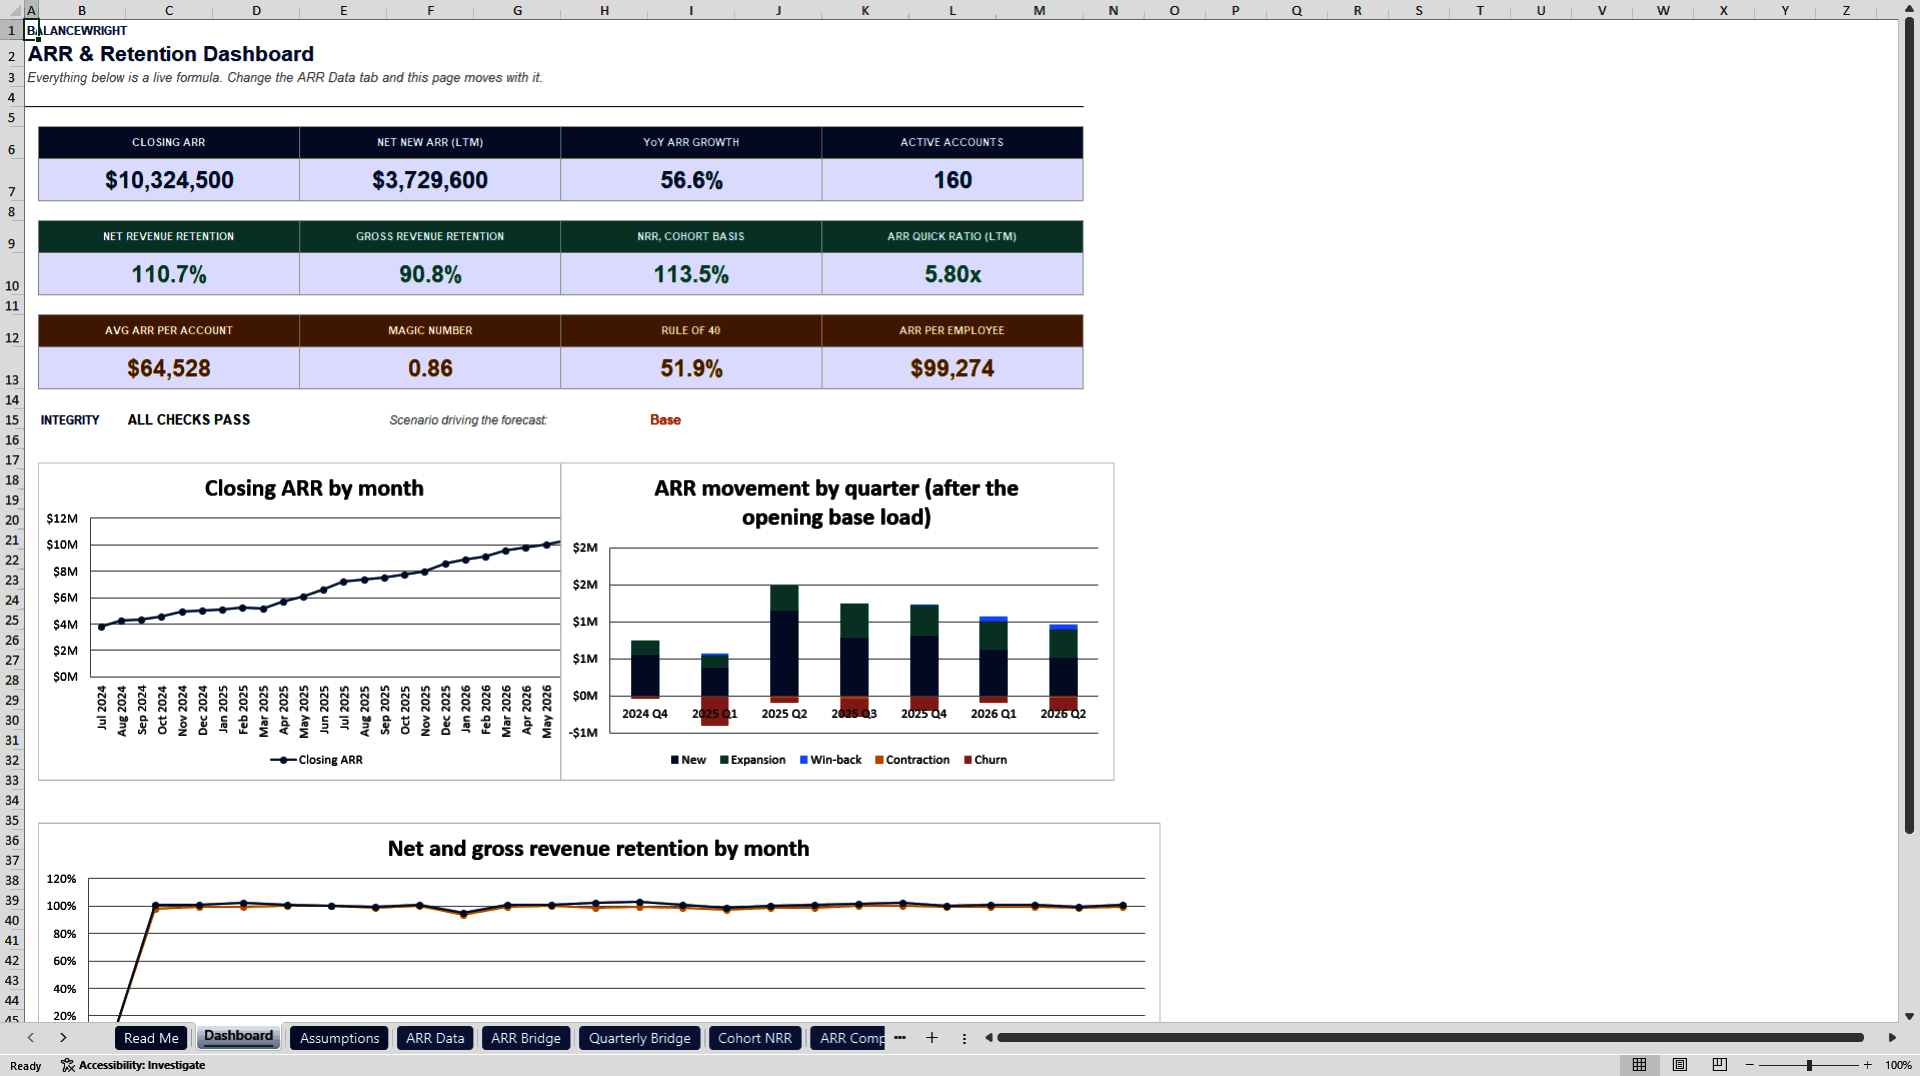
NET AND GROSS REVENUE RETENTION, THREE WAYS. Monthly NRR and GRR chained across twelve months rather than averaged – averaging monthly rates flatters a declining book. Plus a cohort-basis NRR that asks what today's ARR from accounts acquired a year ago is worth against their ARR then. The two readings differ, they differ for a reason, and both sit on the dashboard so you can explain the gap instead of being surprised by it.
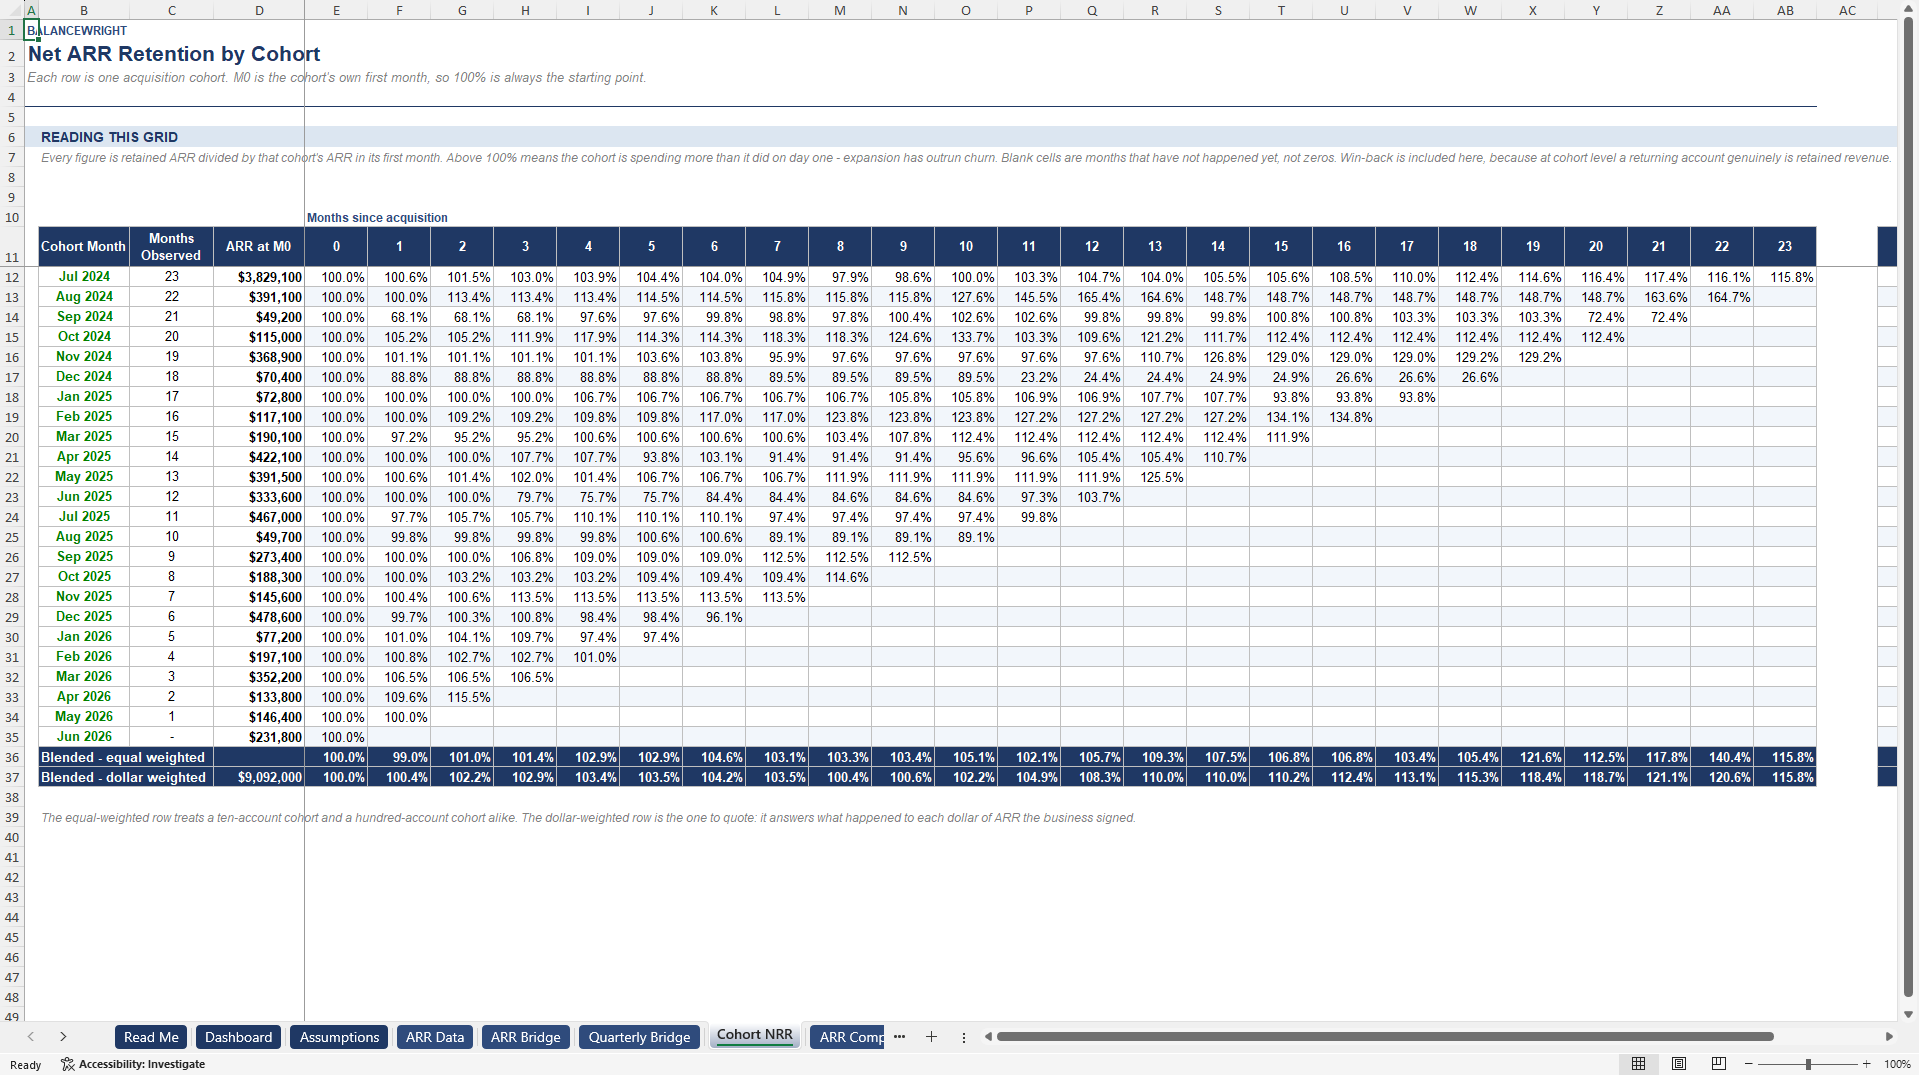
COHORT RETENTION. Net ARR retention by acquisition cohort against months since acquisition, with six- and twelve-month checkpoints and two blended curves: equal-weighted and dollar-weighted. The dollar-weighted row is the one to quote, because it answers what happened to each dollar of ARR the business signed.
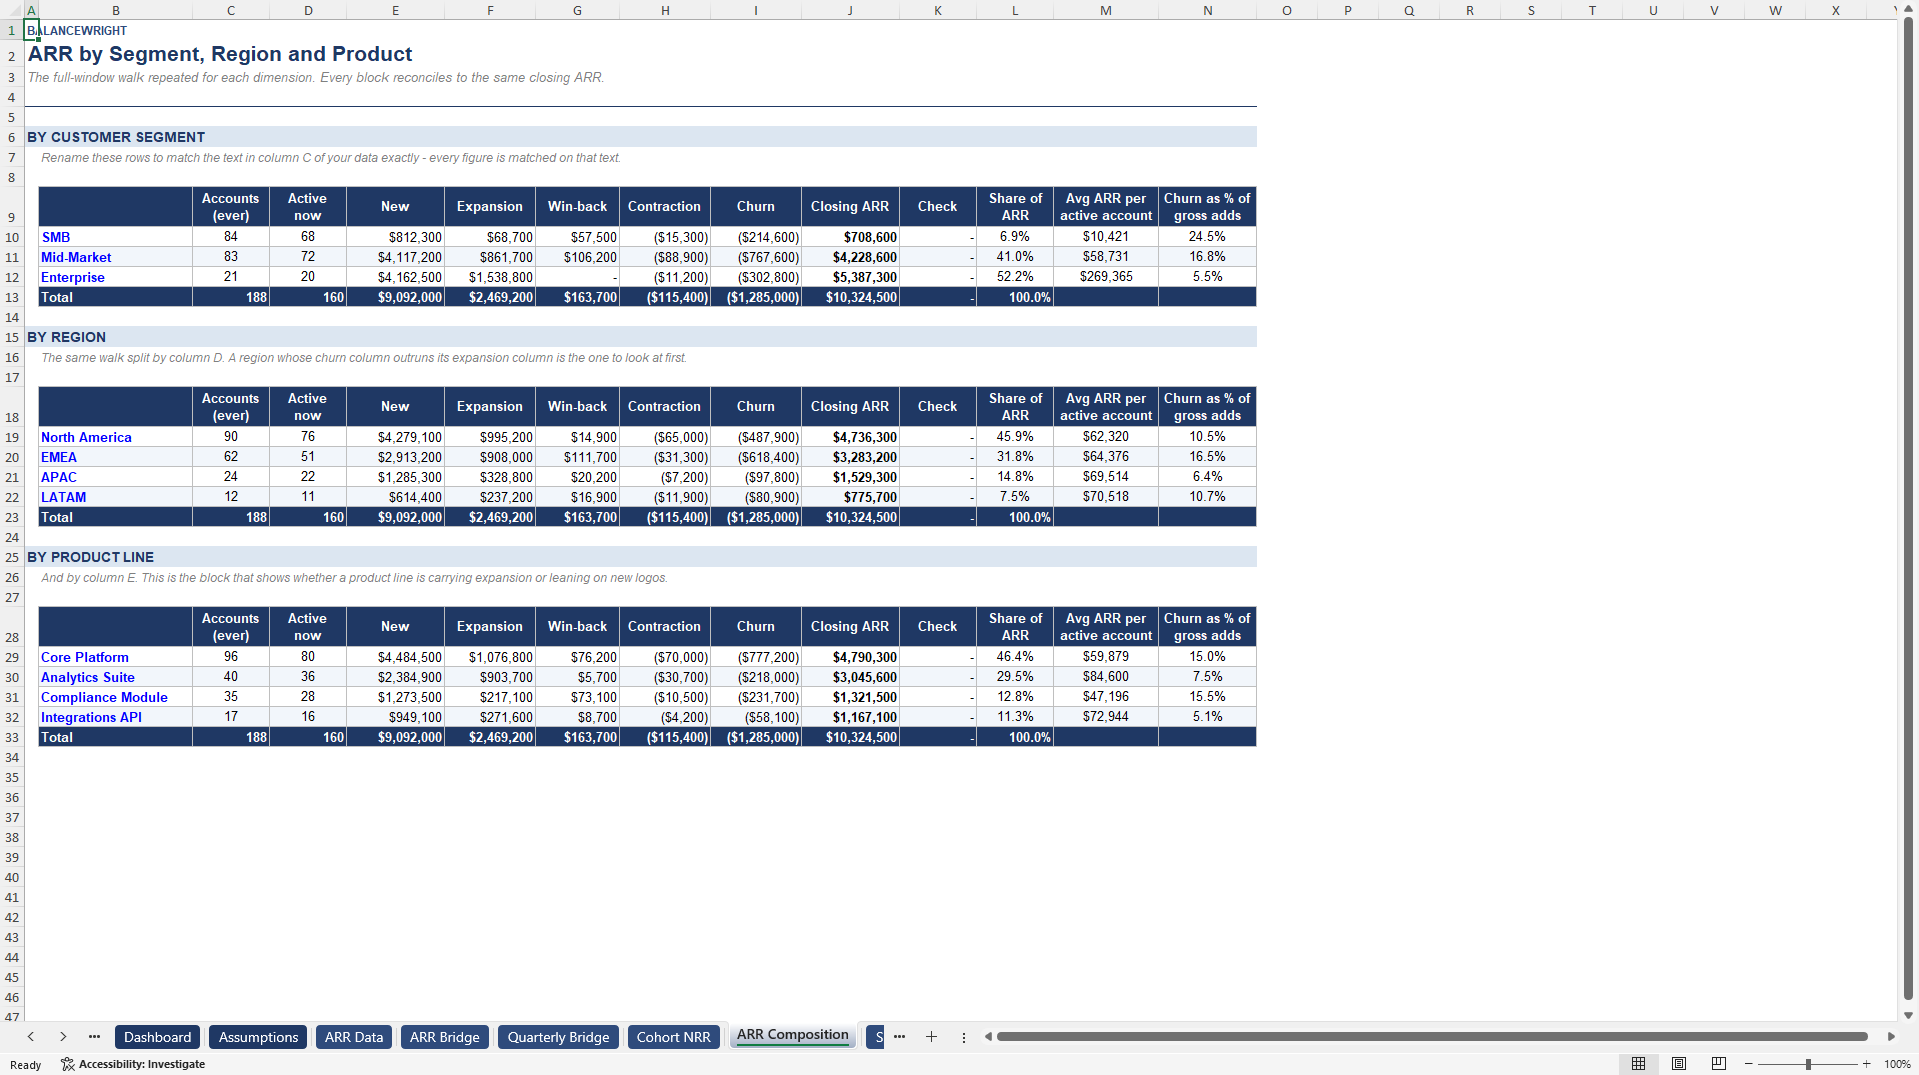
ARR COMPOSITION. The full-window walk repeated for every customer segment, every region and every product line. Each block reconciles independently to the same closing ARR, so a blank or misspelt category shows up as a failed check rather than as a silently missing million.
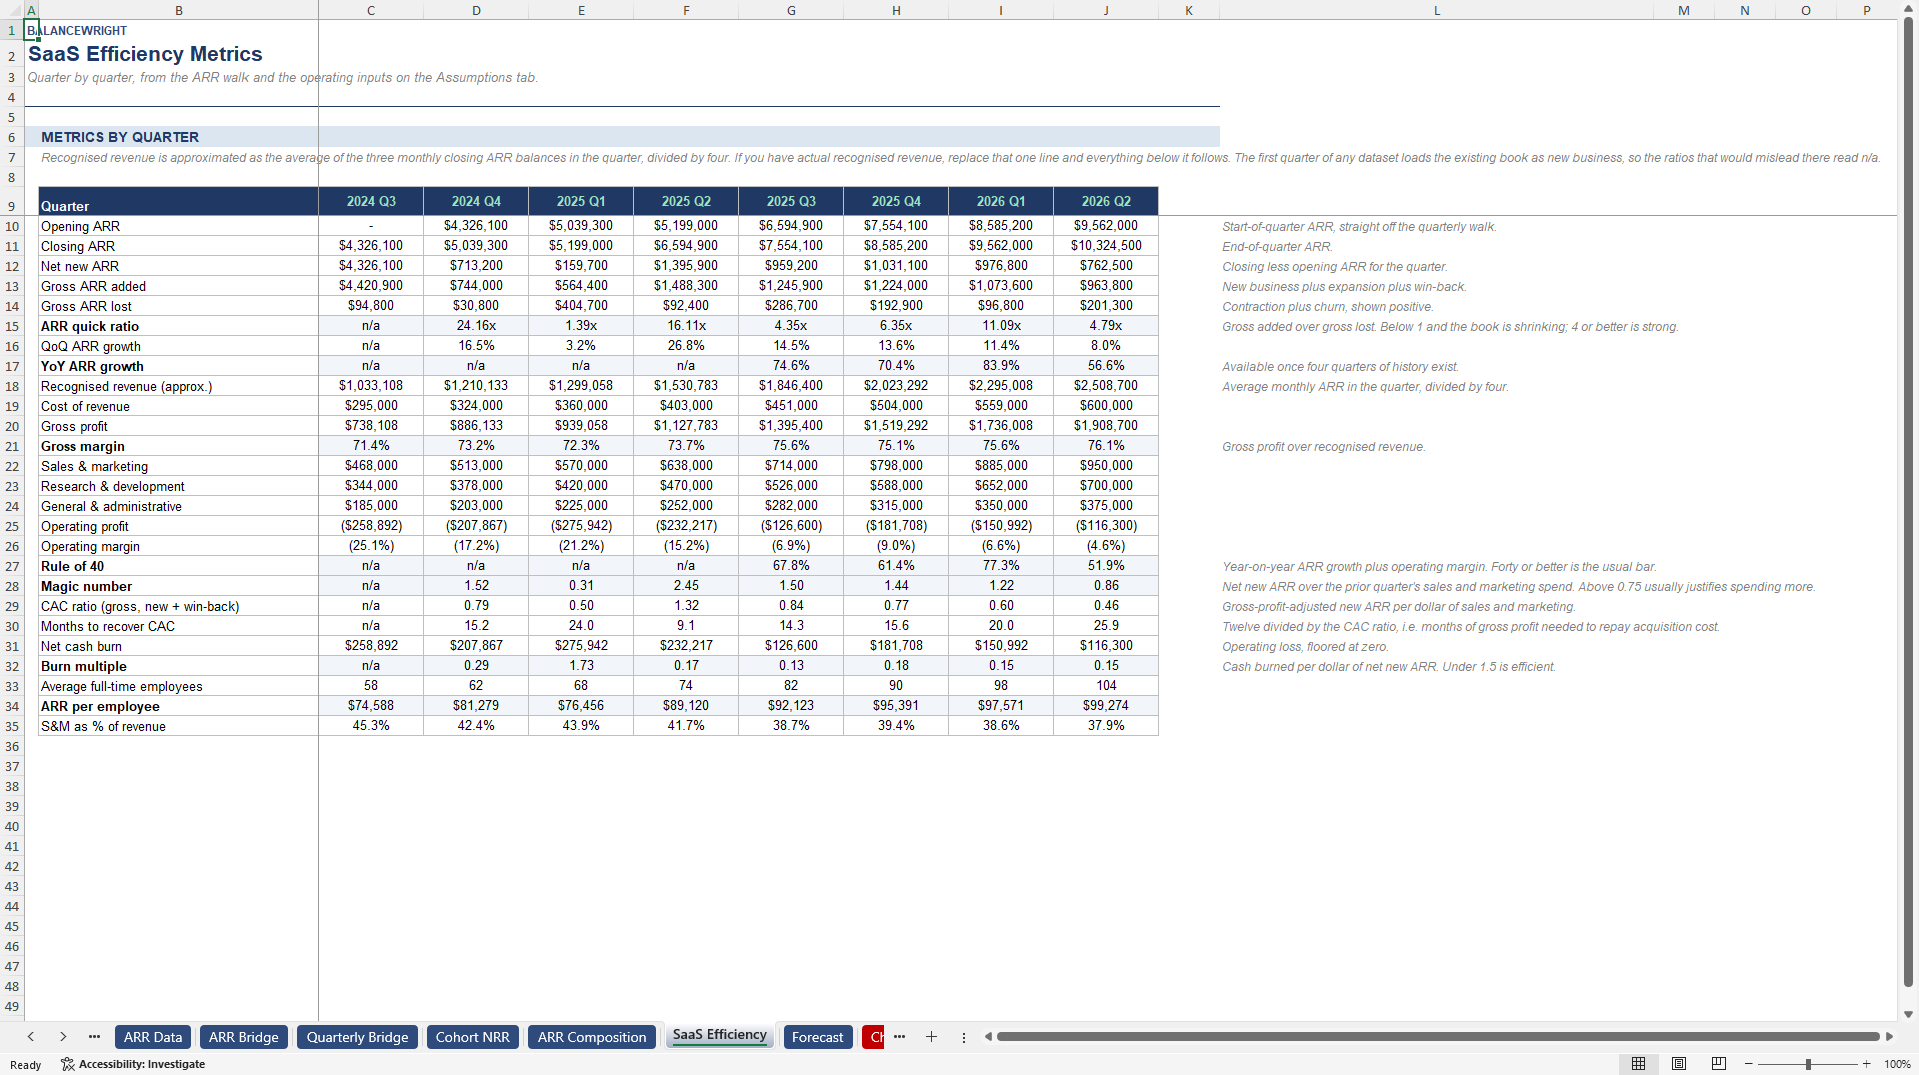
SAAS EFFICIENCY METRICS. Twenty-six lines per quarter: gross margin, operating margin, ARR quick ratio, magic number, CAC ratio, months to recover CAC, Rule of 40, burn multiple, ARR per employee and S&M as a share of revenue. All built from the walk and a handful of operating inputs you enter once per quarter.
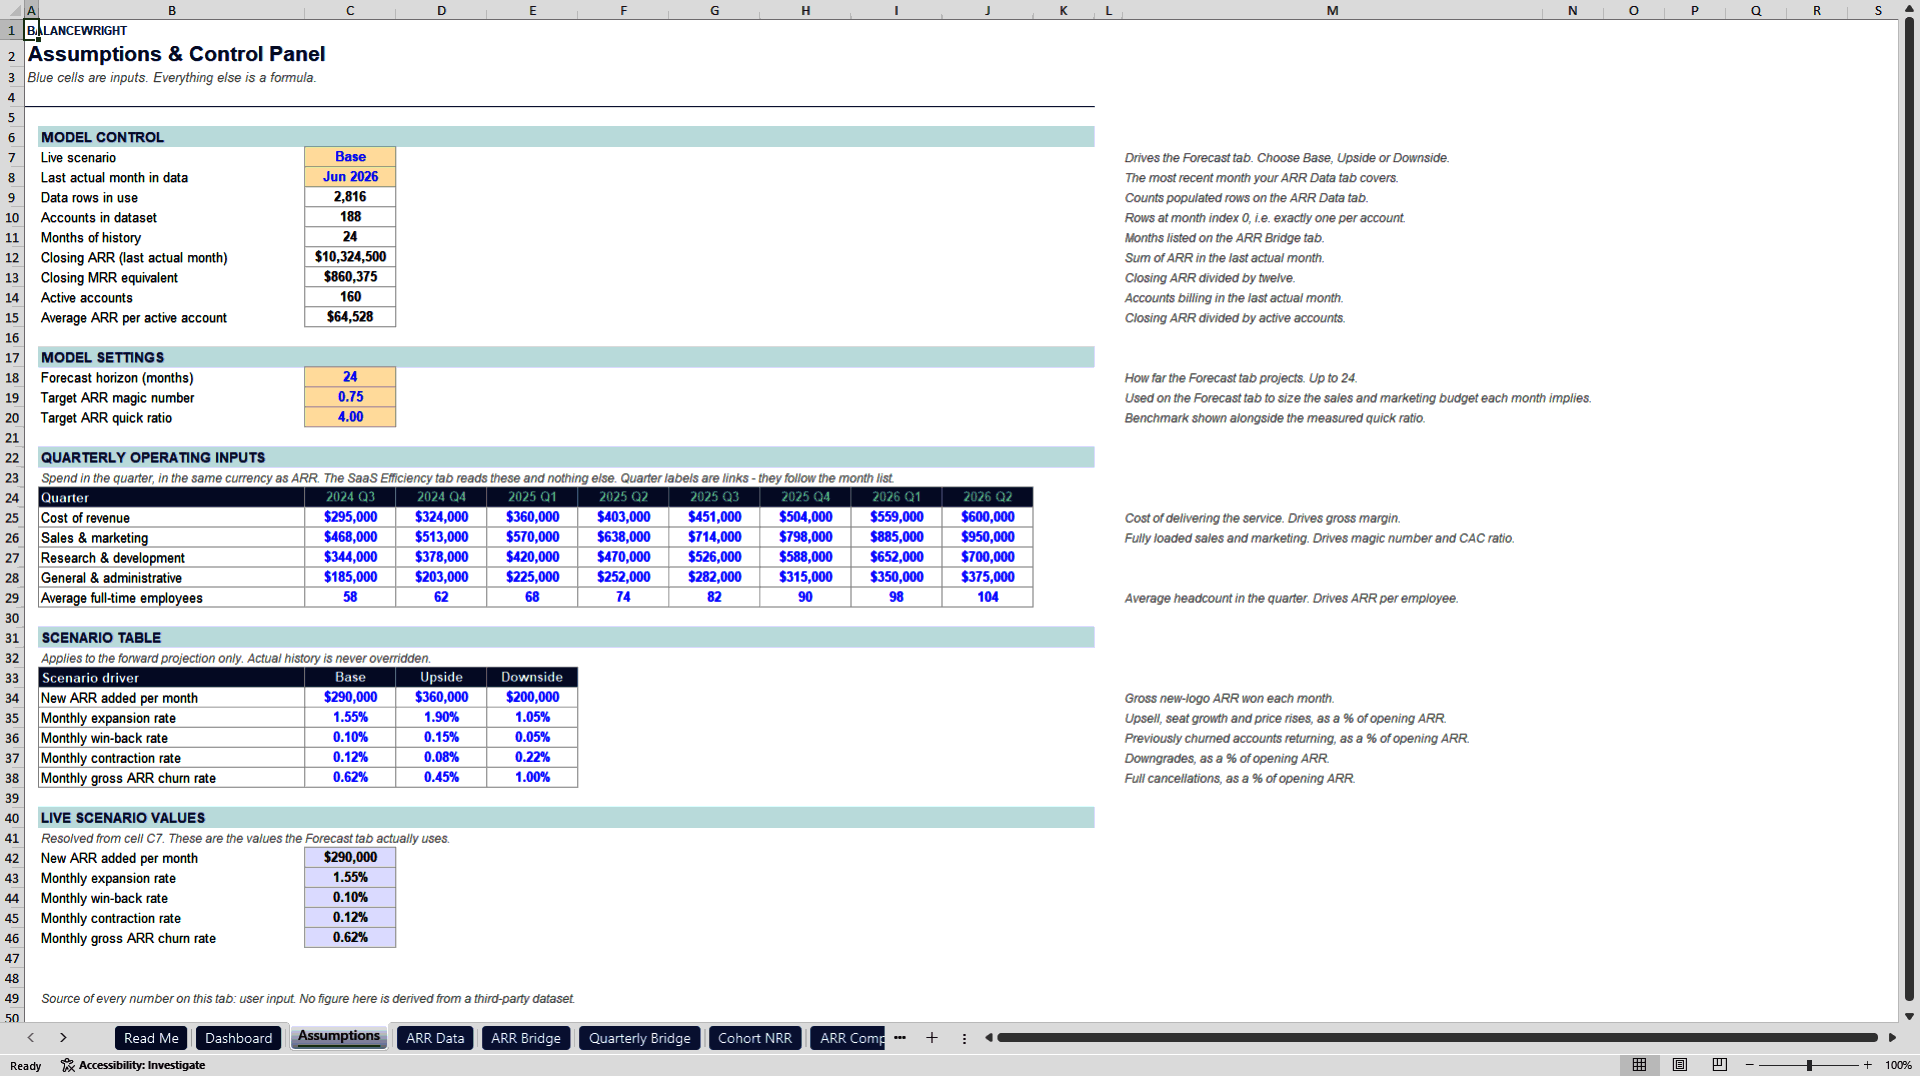
A SCENARIO-DRIVEN FORECAST. Up to 24 months forward from your last actual month, across five drivers, with base, upside and downside switched from a single cell. The final column sizes the sales and marketing budget each month's net new ARR would imply at your target magic number – a sense-check on whether a growth plan is affordable before anyone commits to it.
ELEVEN INTEGRITY CHECKS. A separate tab that tests the monthly walk, the quarterly walk, agreement between the two, all three composition splits, cohort assignment and four more things that are easy to get wrong. Every line must read PASS before you quote a number. Most templates ask you to trust them; this one shows its working.
One detail that matters and that most models get wrong: the first month of any analysis window has no history behind it, so the entire existing book arrives as new business. The walk still ties, but it makes that quarter's quick ratio, CAC ratio and burn multiple meaningless. This model marks exactly those cells n/a instead of printing a number you would have to explain away.
Everything is a live Excel formula – more than 21,700 of them. No macros, no add-ins, no external links, no password protection and no locked cells, so every calculation is open to inspection and the file behaves identically in Excel, LibreOffice, Numbers and Google Sheets. It ships with a realistic 188-account, 24-month sample dataset so every tab works the moment you open it.
Written for finance and RevOps teams at subscription and SaaS companies, for founders preparing a raise, and for the investors and advisors who have to underwrite them.
The secondary document is a five-page PDF guide covering the required data format, the calculation methodology behind every headline metric, a worked example of how one account moves through the walk, and an honest account of what the model cannot do.
Building this from scratch takes a competent financial modeller two to four days.
Got a question about the product? Email us at support@flevy.com or ask the author directly by using the "Ask the Author a Question" form. If you cannot view the preview above this document description, go here to view the large preview instead.
Source: Best Practices in SaaS, Subscription Excel: SaaS & Subscription ARR Bridge, NRR/GRR & Churn Model Excel (XLSX) Spreadsheet, Balancewright
ABOUT THE AUTHOR

Balancewright builds working financial models for subscription and recurring-revenue businesses -- cohort retention, revenue movement, unit economics, cash flow and scenario forecasting.
Every model is formula-driven end to end. No locked cells, no passwords, no macros and no external links, so any calculation can be inspected, adapted and audited. Each file ships with a visible
... [read more]
Ask the Author a Question
You must be logged in to contact the author.




























