

Real Estate IRR Sensitivity Model: Occupancy, Cap Rate, Hold – Excel XLSX
Excel (XLSX)
VIDEO DEMO
BENEFITS OF THIS DOWNLOADABLE EXCEL DOCUMENT
- Sensitivity Analysis
- Real Estate Underwriting
- Occupancy Analysis
REAL ESTATE EXCEL DESCRIPTION
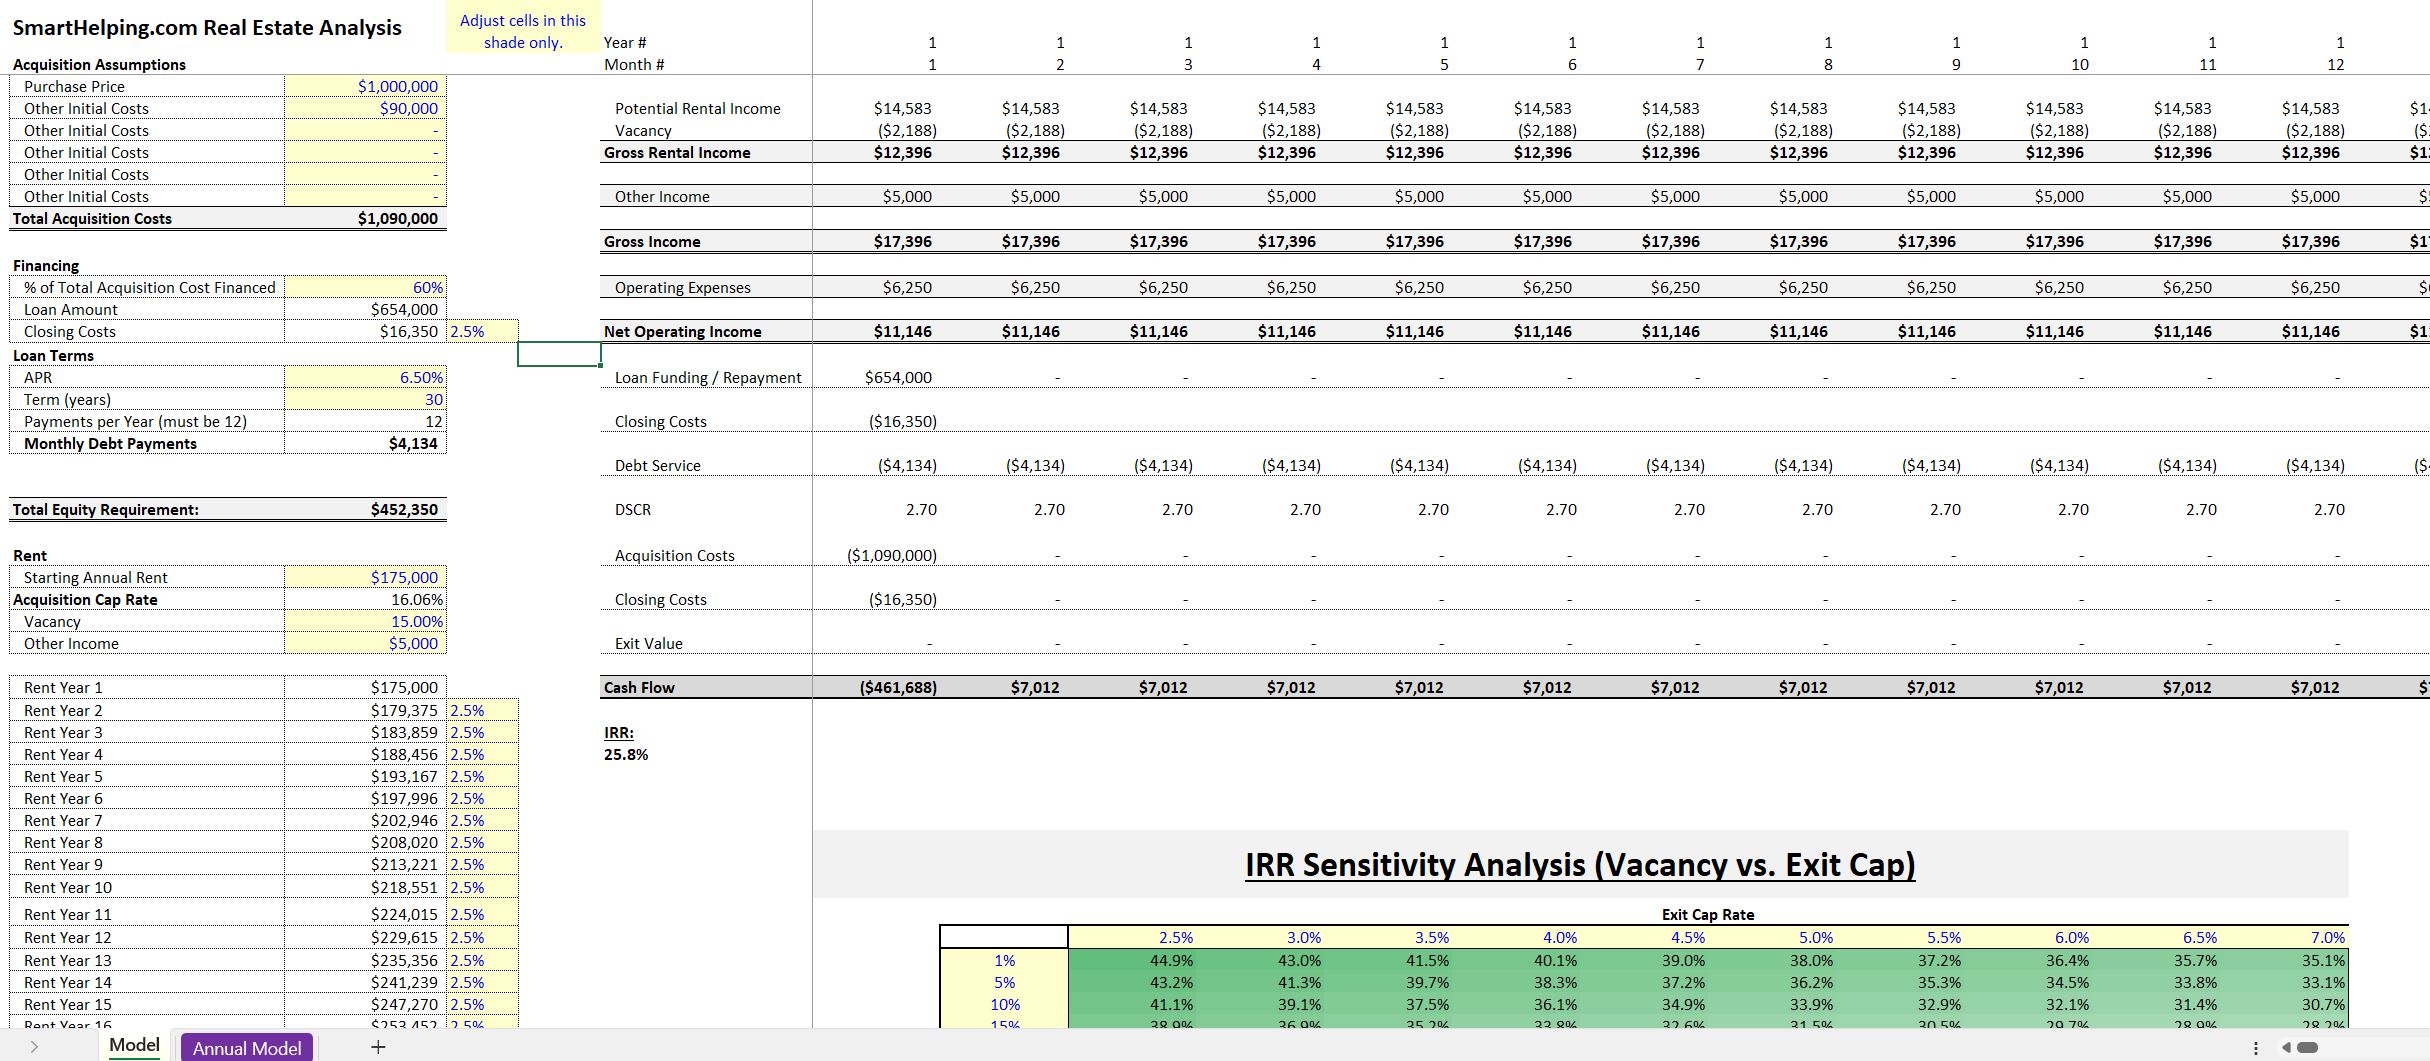
In my opinion, the best metric to analyze a real estate acquisition or development opportunity is IRR (internal rate of return). It is the more advanced form of cash-on-cash return (CoC). Even though CoC is an easier metric to understand, it doesn't tell you as much about the investment opportunity as IRR. They both look at total cash flows, but IRR takes the time value of money into account.
So, this is a fairly basic real estate model in terms of the revenue and expense assumptions as well as the escalation therein. You've also got some inputs for acquisition costs / purchase price, financing assumptions, vacancy rate, and other ancillary income.
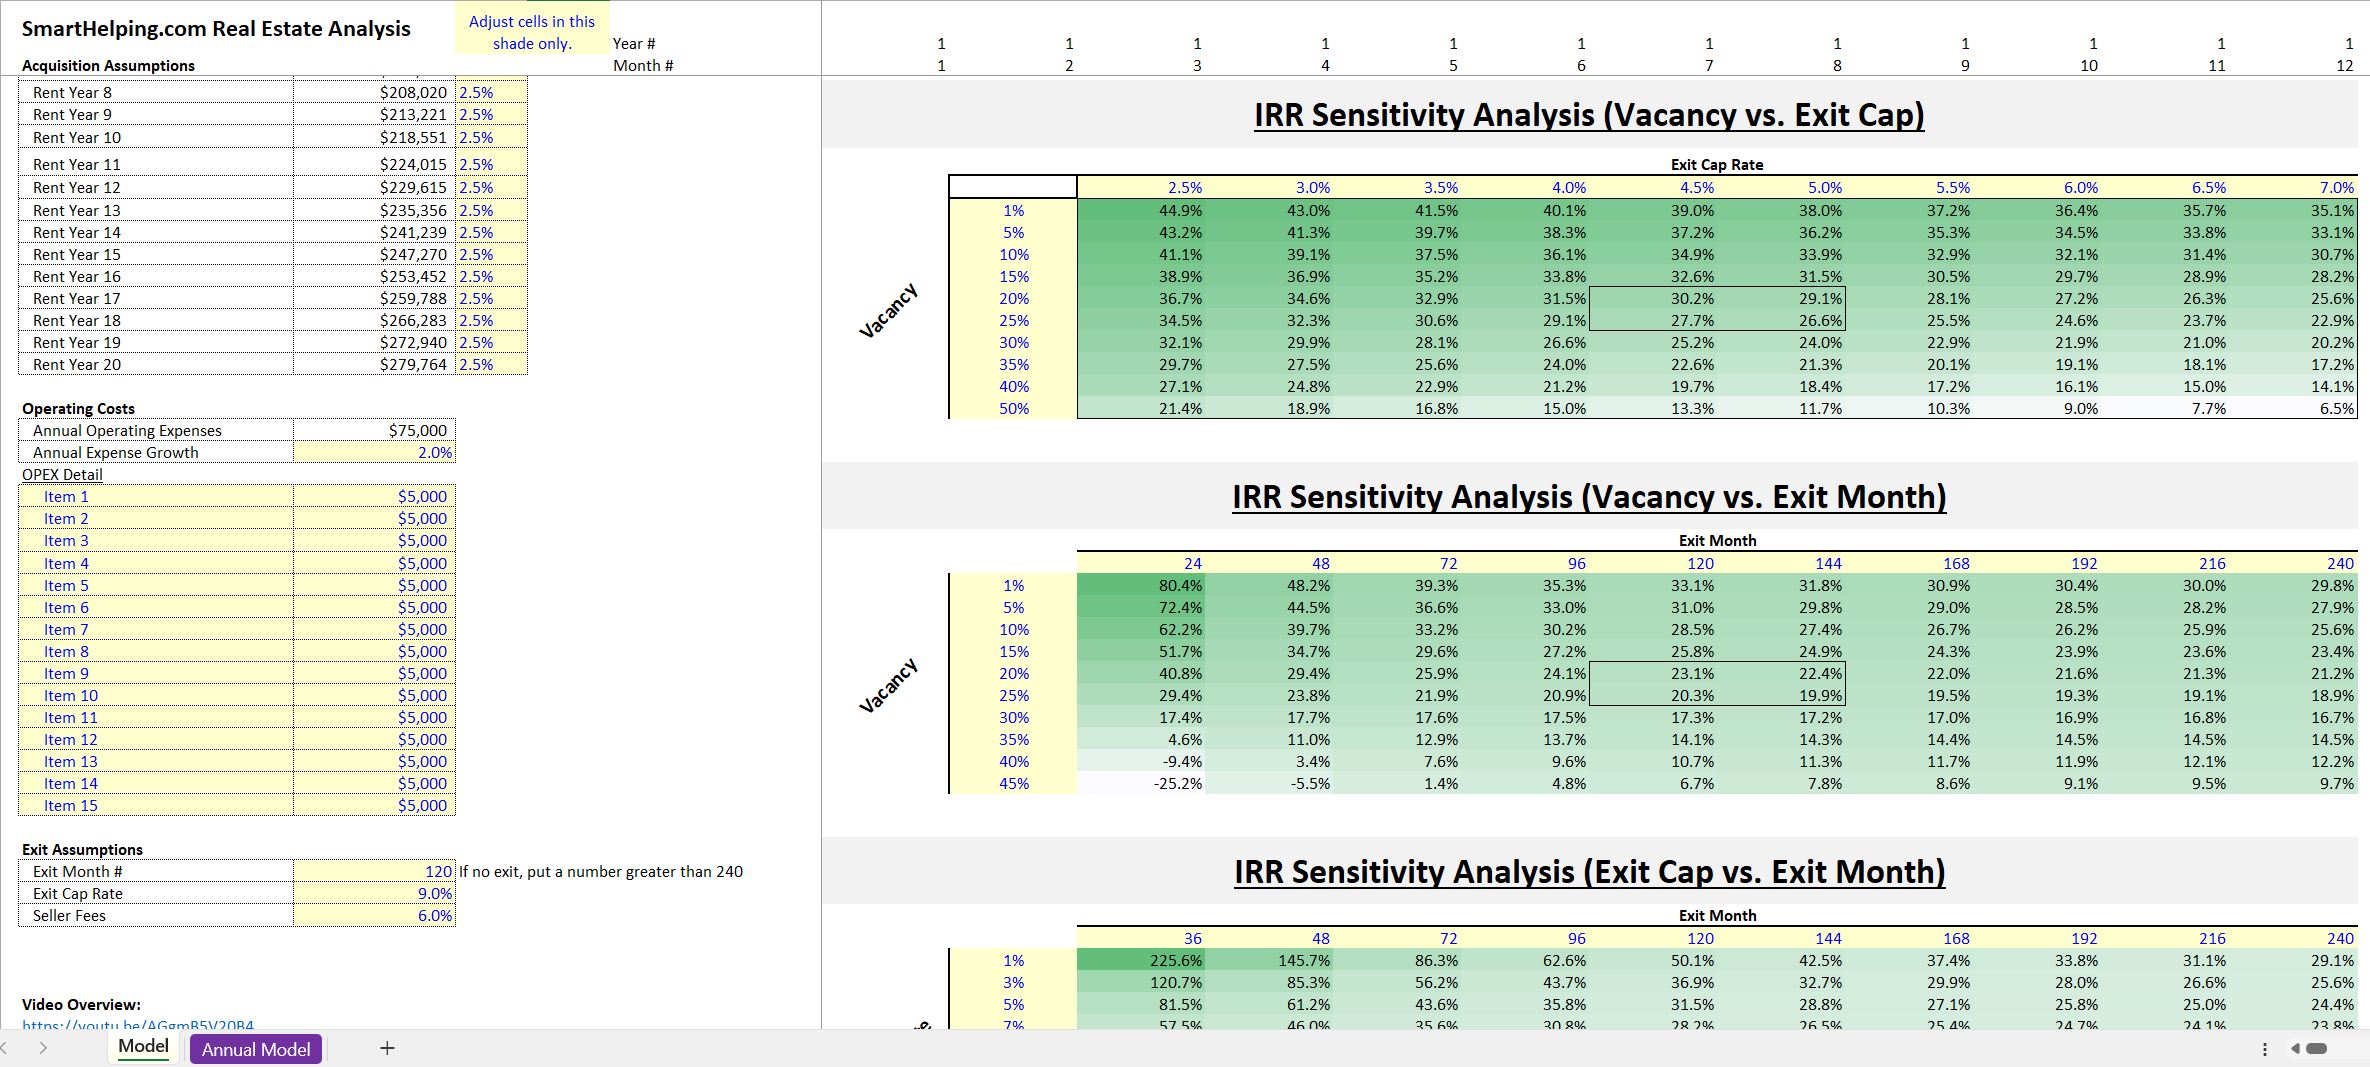
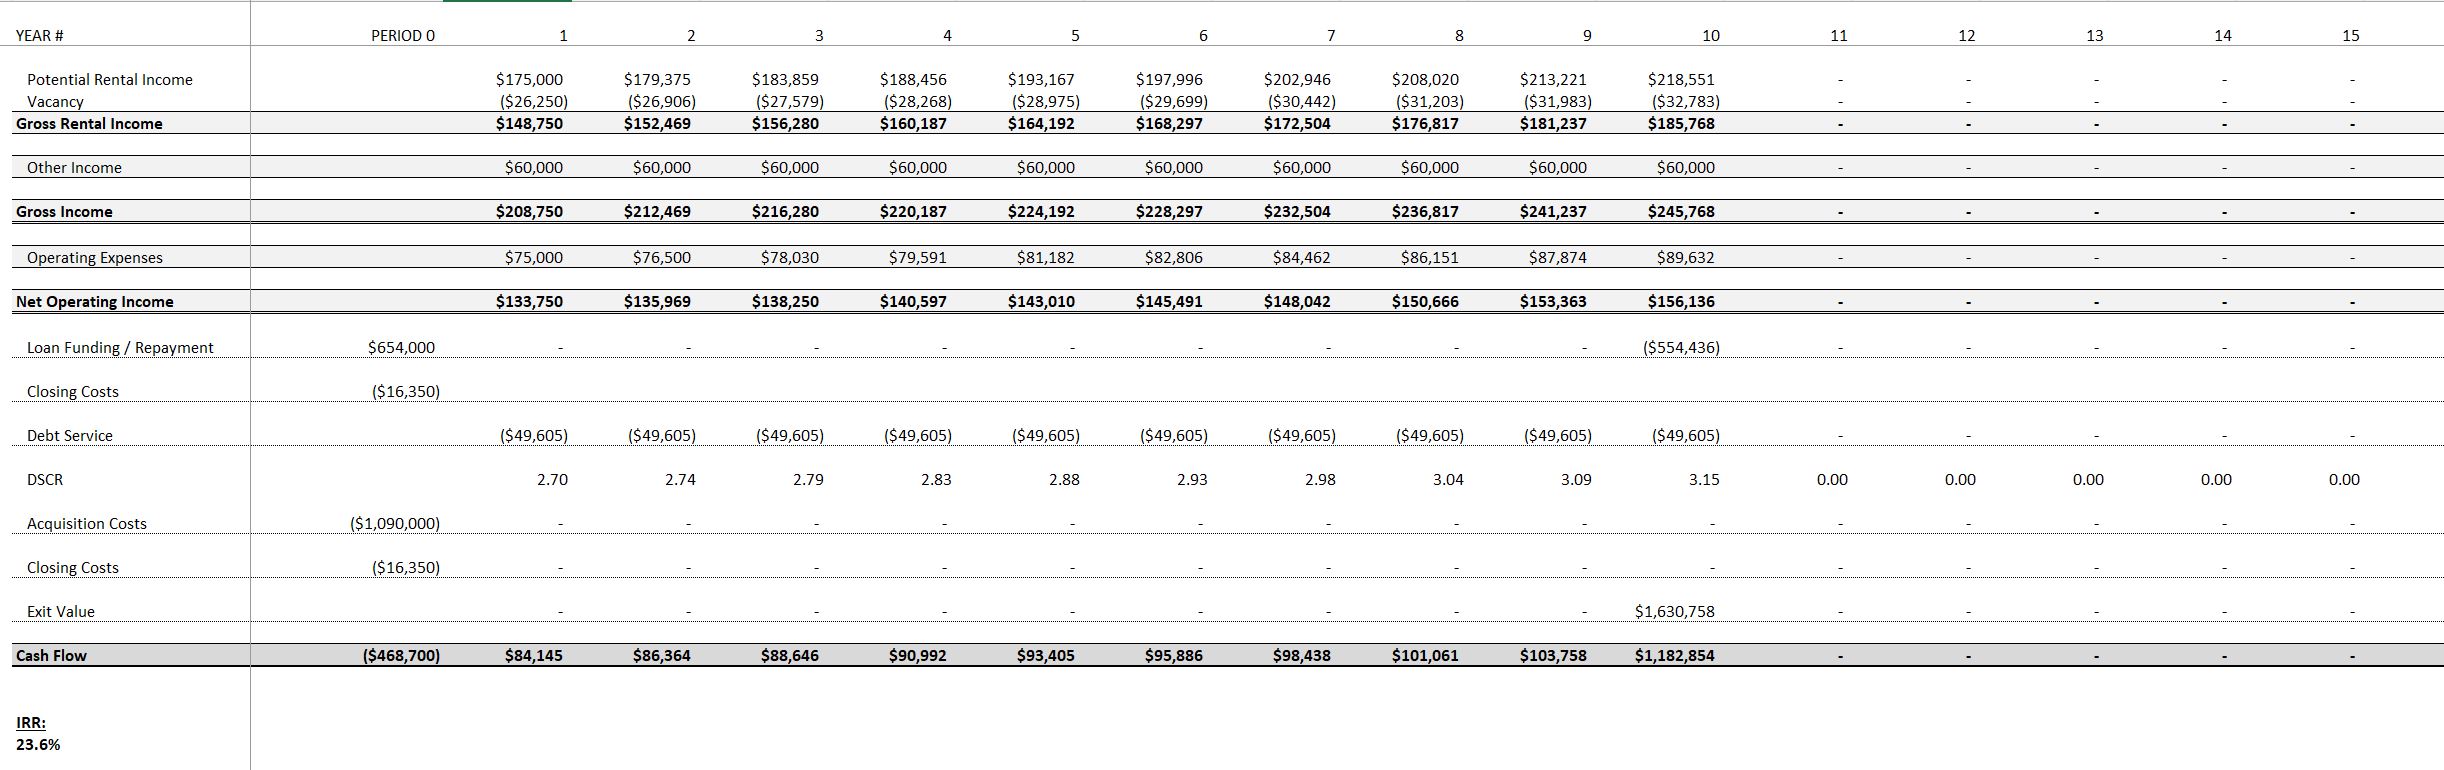
The pro forma will auto-populate monthly and annual summaries for up to 20 years and fully adjusts as the inputs change. Sensitivity tables are so useful because it allows one to see final metric outputs without having to rebuild the entire model and adjust certain variables. Excel's what-if analysis feature will provide all the back-end calculations that the model is doing and show output values based on certain assumptions being changed. I find this to be the top-end level for real estate analysis and underwriting. This has become especially true with the trove of people leaving offices and occupancy being a real concern.
The really cool feature of this template is the three sensitivity tables. They produce a range of IRRs based on sensitizing occupancy rates (meaning you can see how the IRR changes for the project if occupancy is x,y,z. I added a few other inputs to sensitize, being hold period and exit cap rate. That means you can see 100 different IRRs of the project based on all those inputs being a range of 10 values.
The model also displays total annual values that go down to net operating income and cash flow.
Got a question about the product? Email us at support@flevy.com or ask the author directly by using the "Ask the Author a Question" form. If you cannot view the preview above this document description, go here to view the large preview instead.
Source: Best Practices in Real Estate, Integrated Financial Model Excel: Real Estate IRR Sensitivity Model: Occupancy, Cap Rate, Hold Excel (XLSX) Spreadsheet, Jason Varner | SmartHelping
ABOUT THE AUTHOR
I graduated in 2011 with a Bachelor's degree in Accounting and began my career as a financial analyst at a small chain of auto repair shops. After gaining valuable experience, I launched my own practice specializing in real estate underwriting, later expanding into general business modeling.
I honed my spreadsheet modeling expertise by completing over 400 projects on Upwork with a 100% success
... [read more]
Ask the Author a Question
You must be logged in to contact the author.
