

Payroll KPI Dashboard – Excel XLSX
Excel (XLSX)
VIDEO DEMO
BENEFITS OF THIS DOWNLOADABLE EXCEL DOCUMENT
- Track all things payroll with monthly, YTD, and averages for payroll KPIs.
PAYROLL EXCEL DESCRIPTION
This 12-month payroll KPI tracker is a great way to keep an eye on all things payroll. Simply drop your data in each month and create a new tab for each year as needed. All logic and formulas are contained on a single sheet. For small businesses, payroll can often be the largest or close to the largest expense. Understanding it in-depth can lead to savings in some situations.
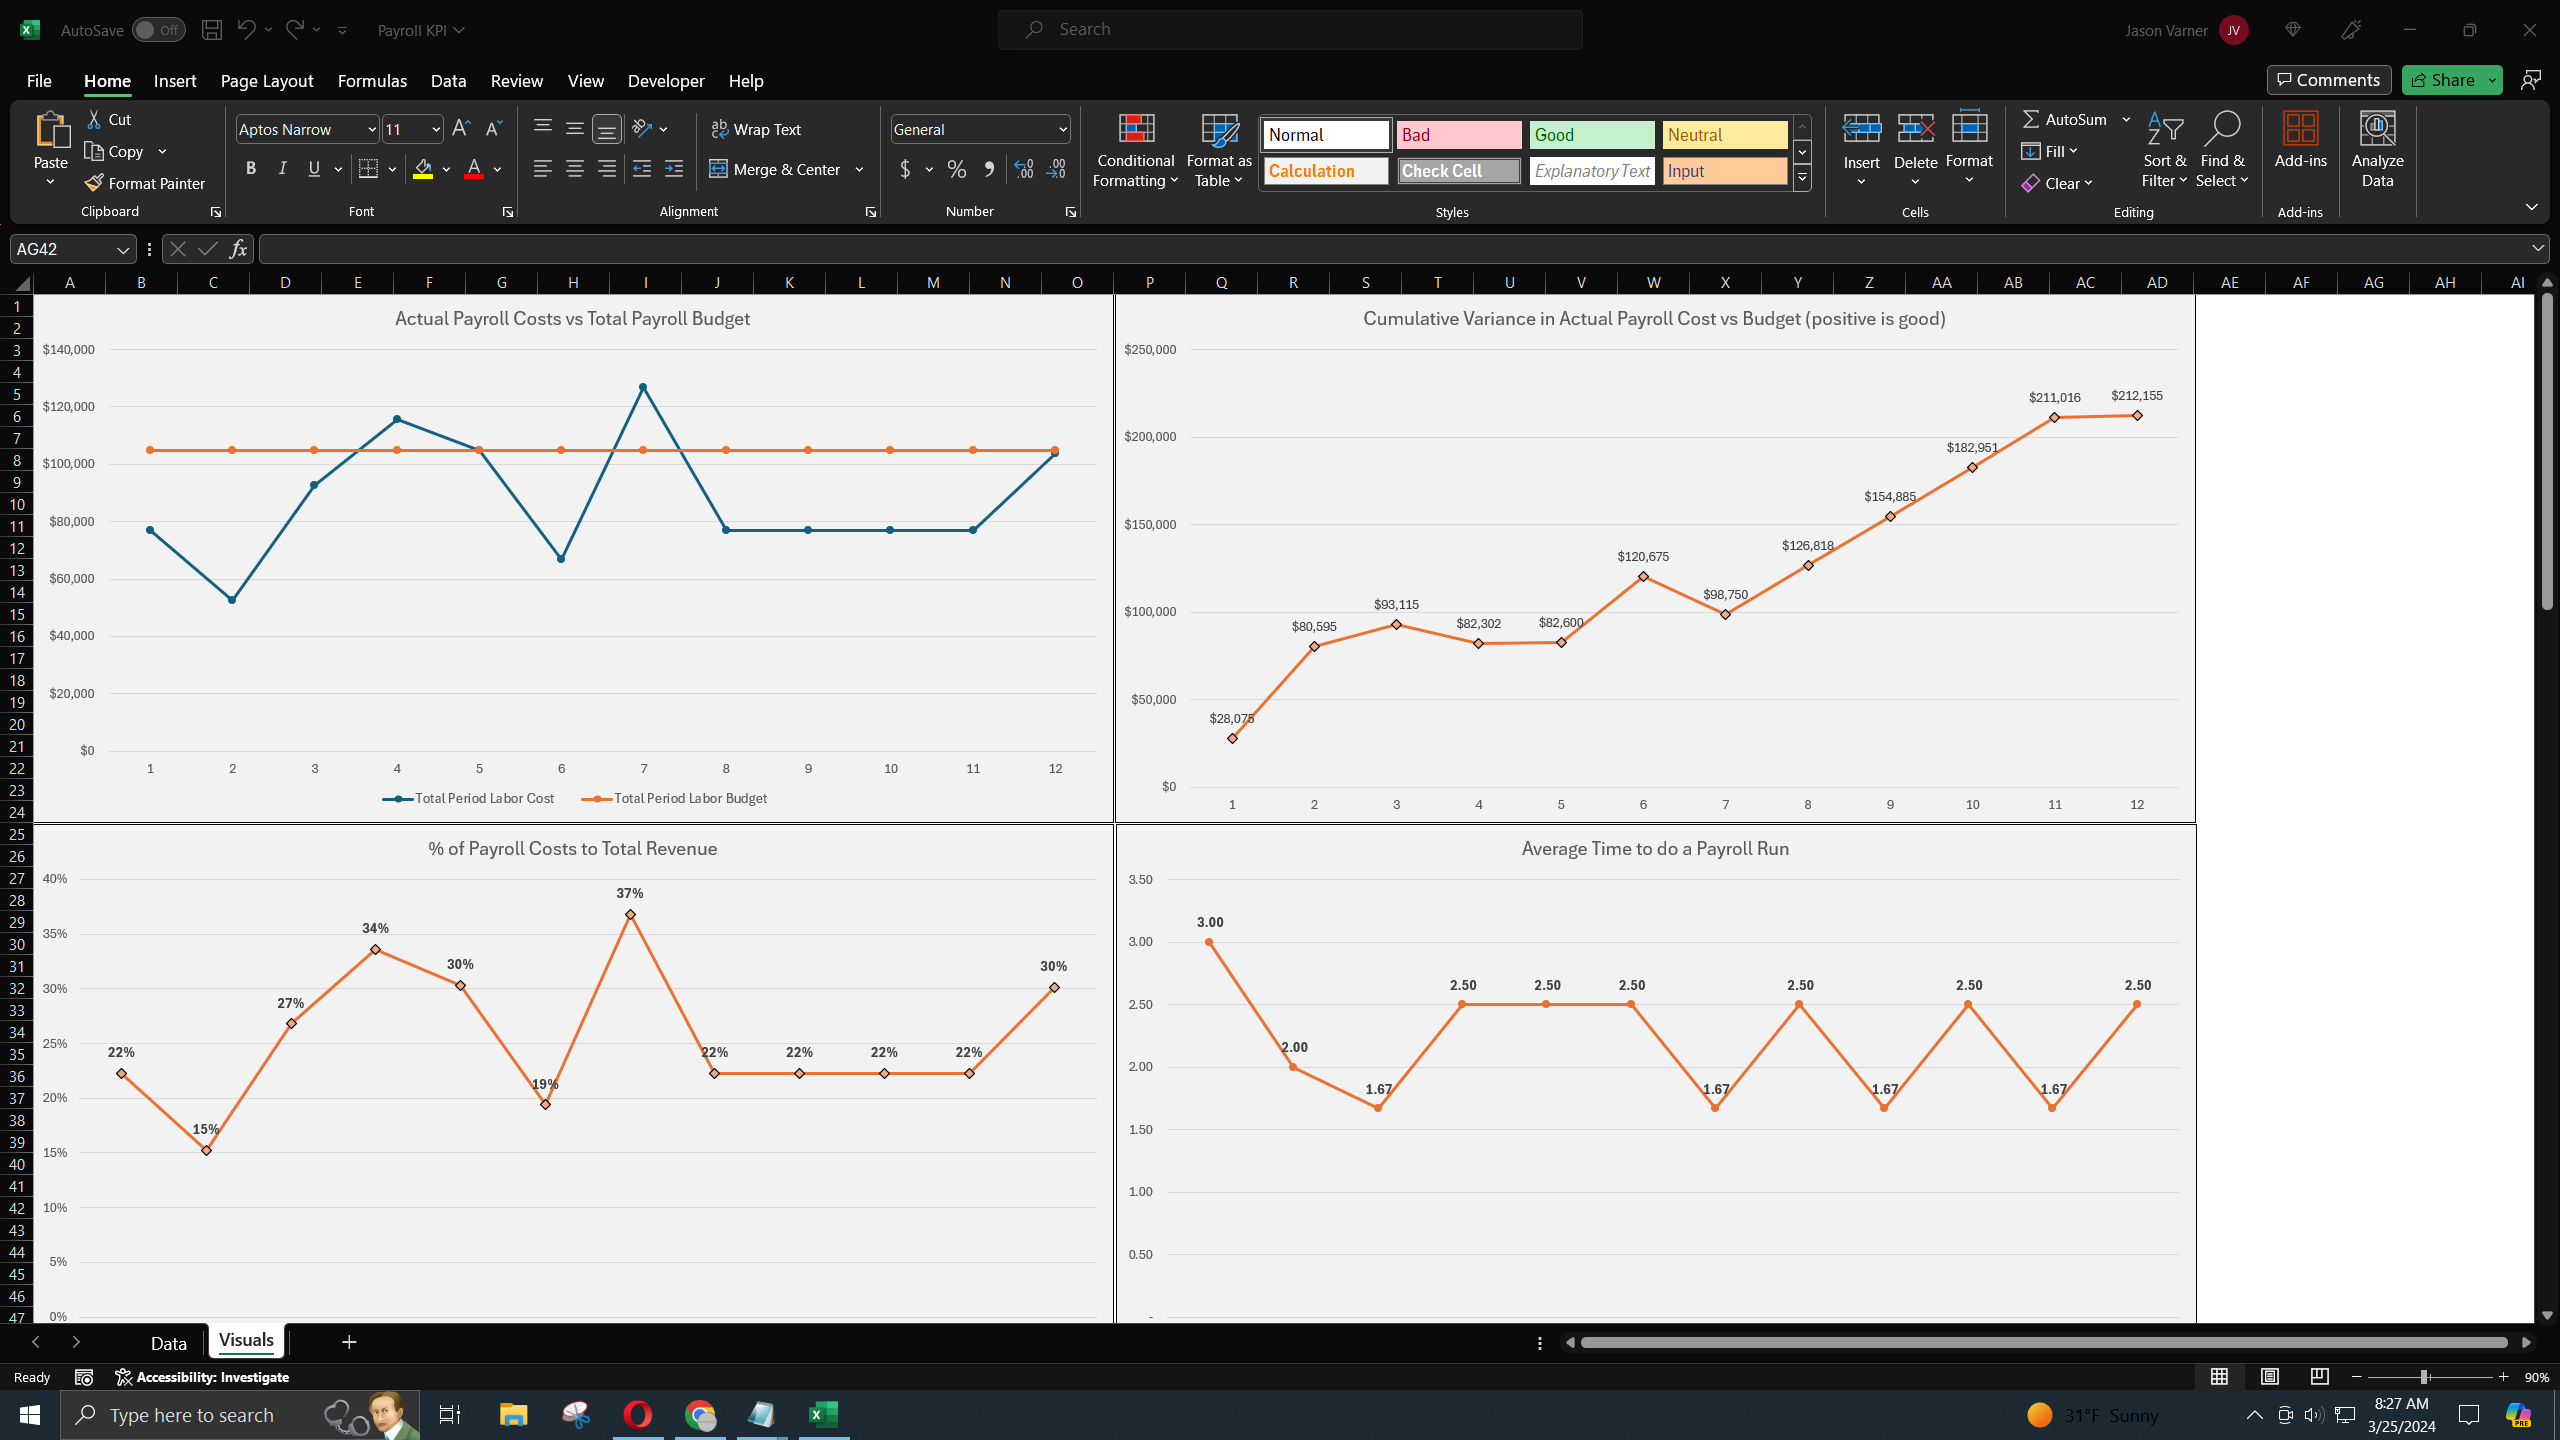
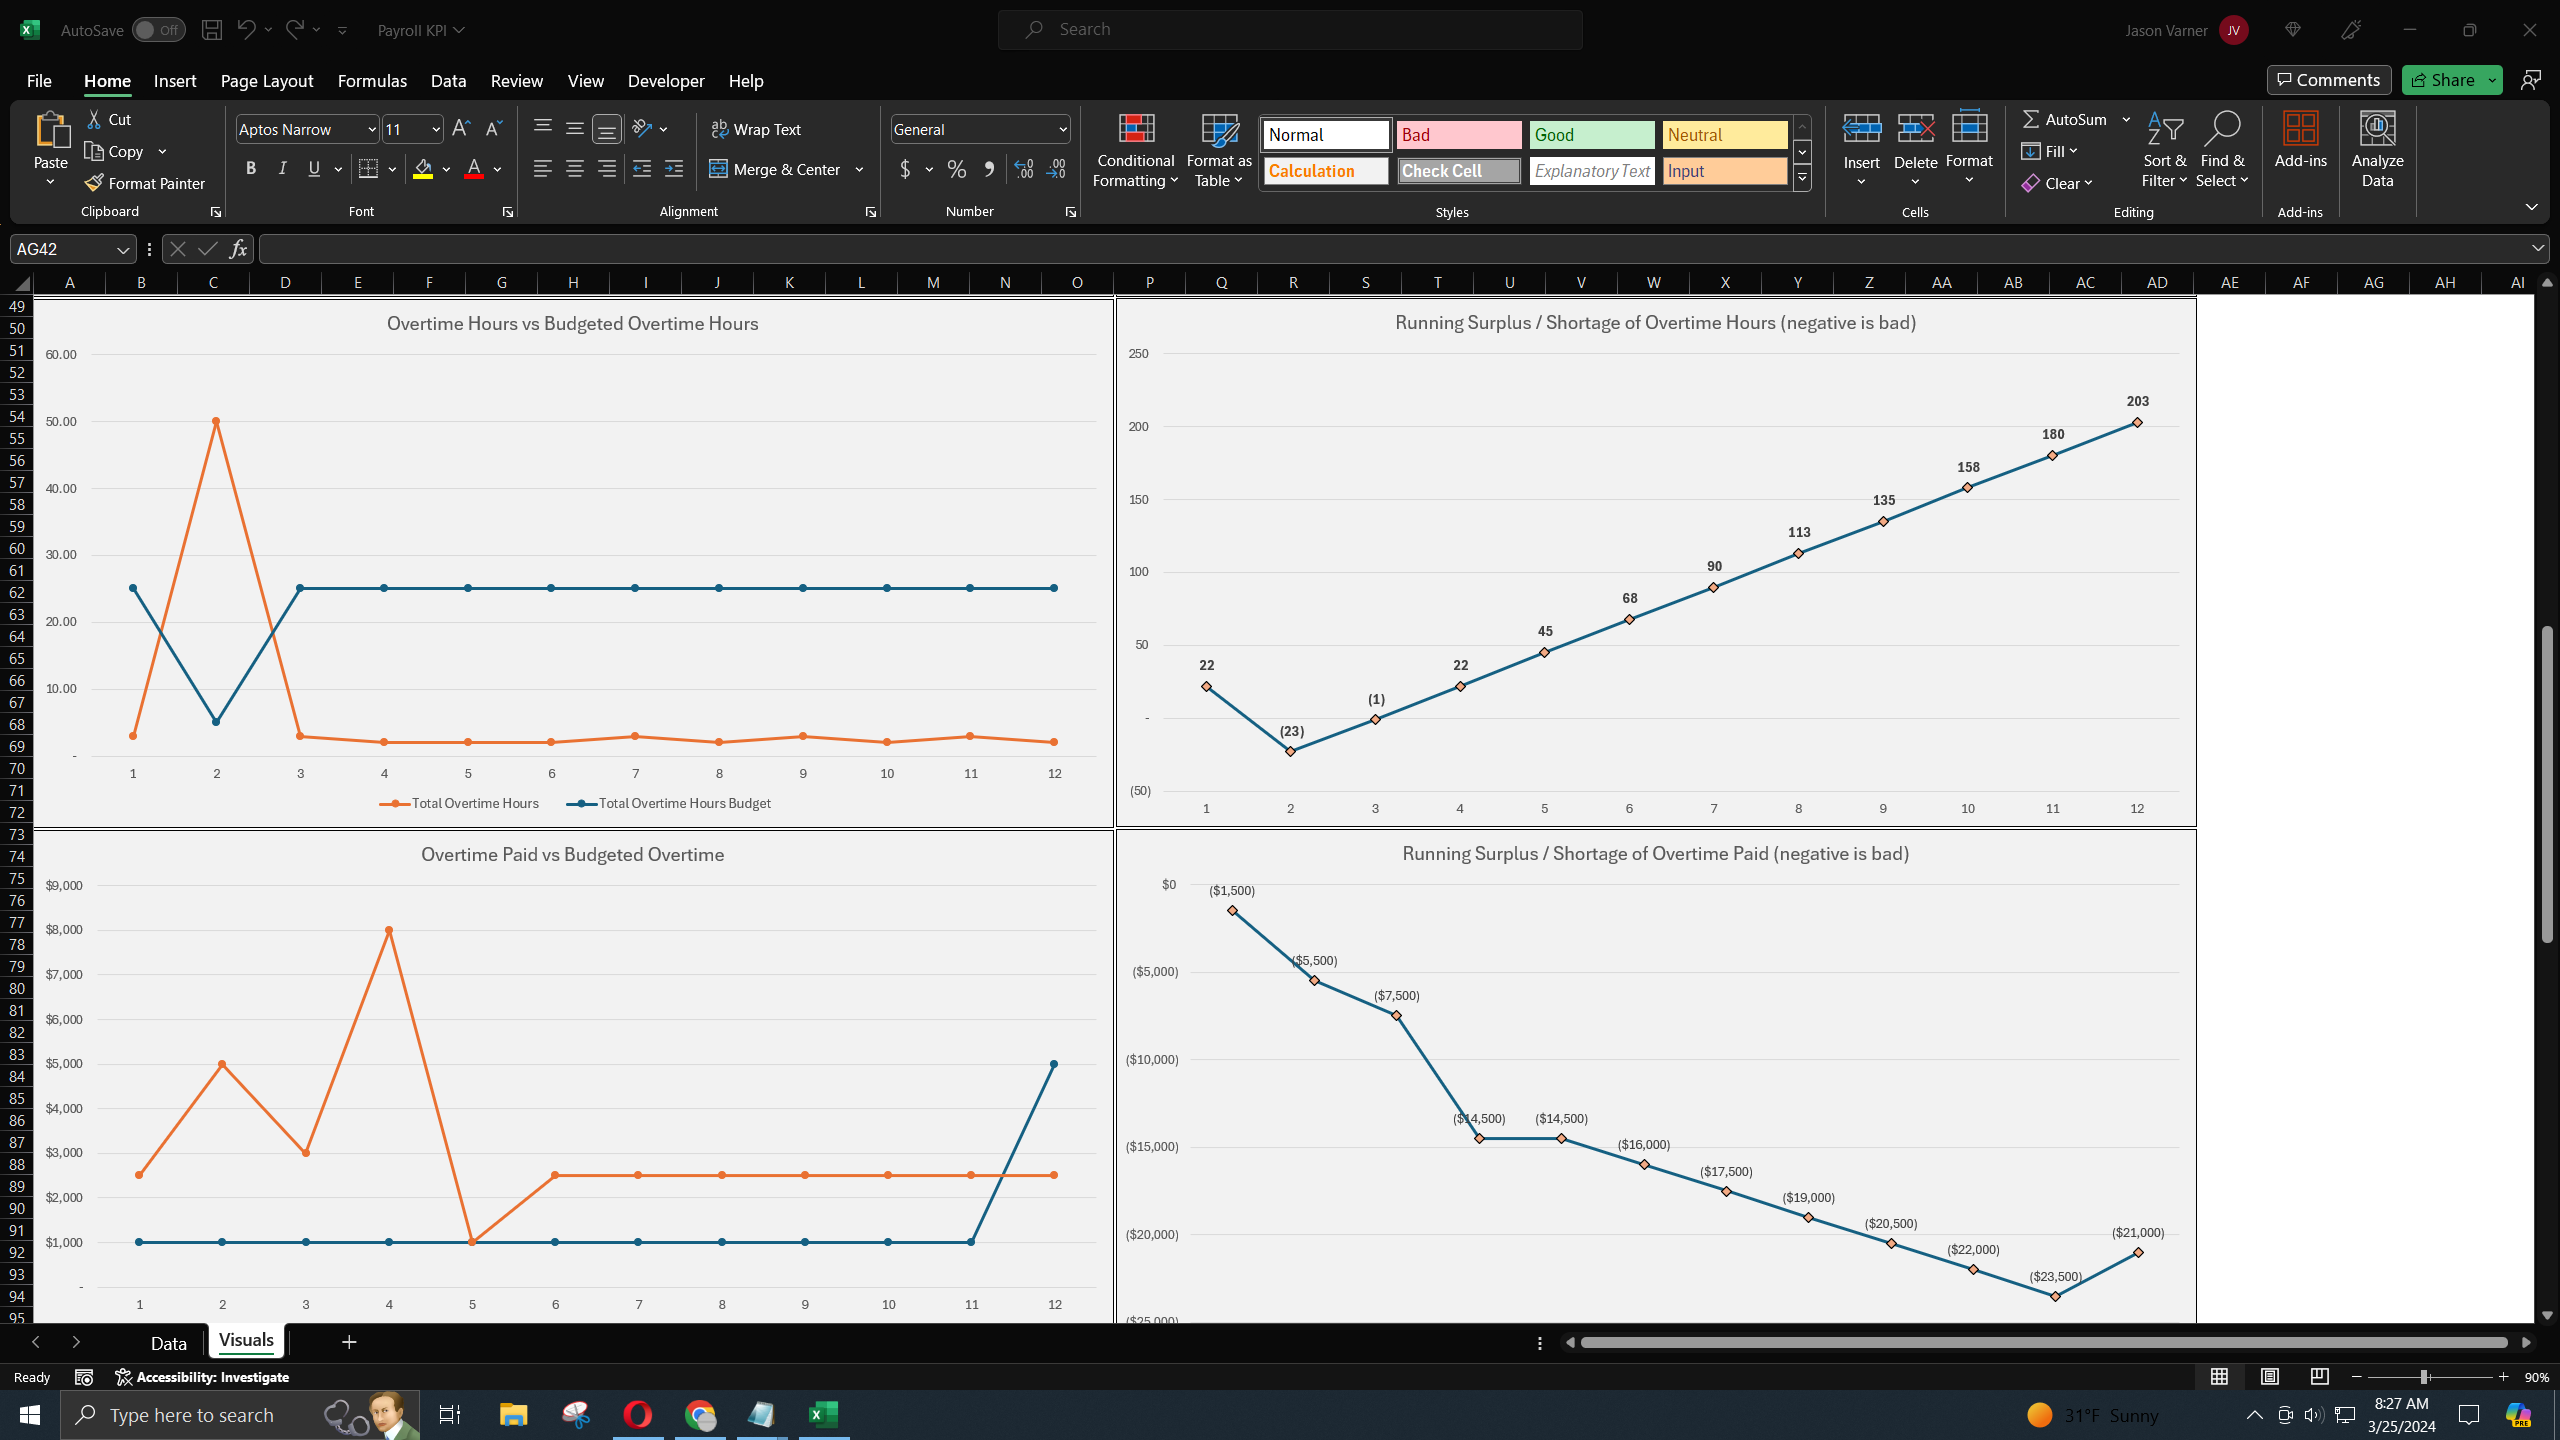
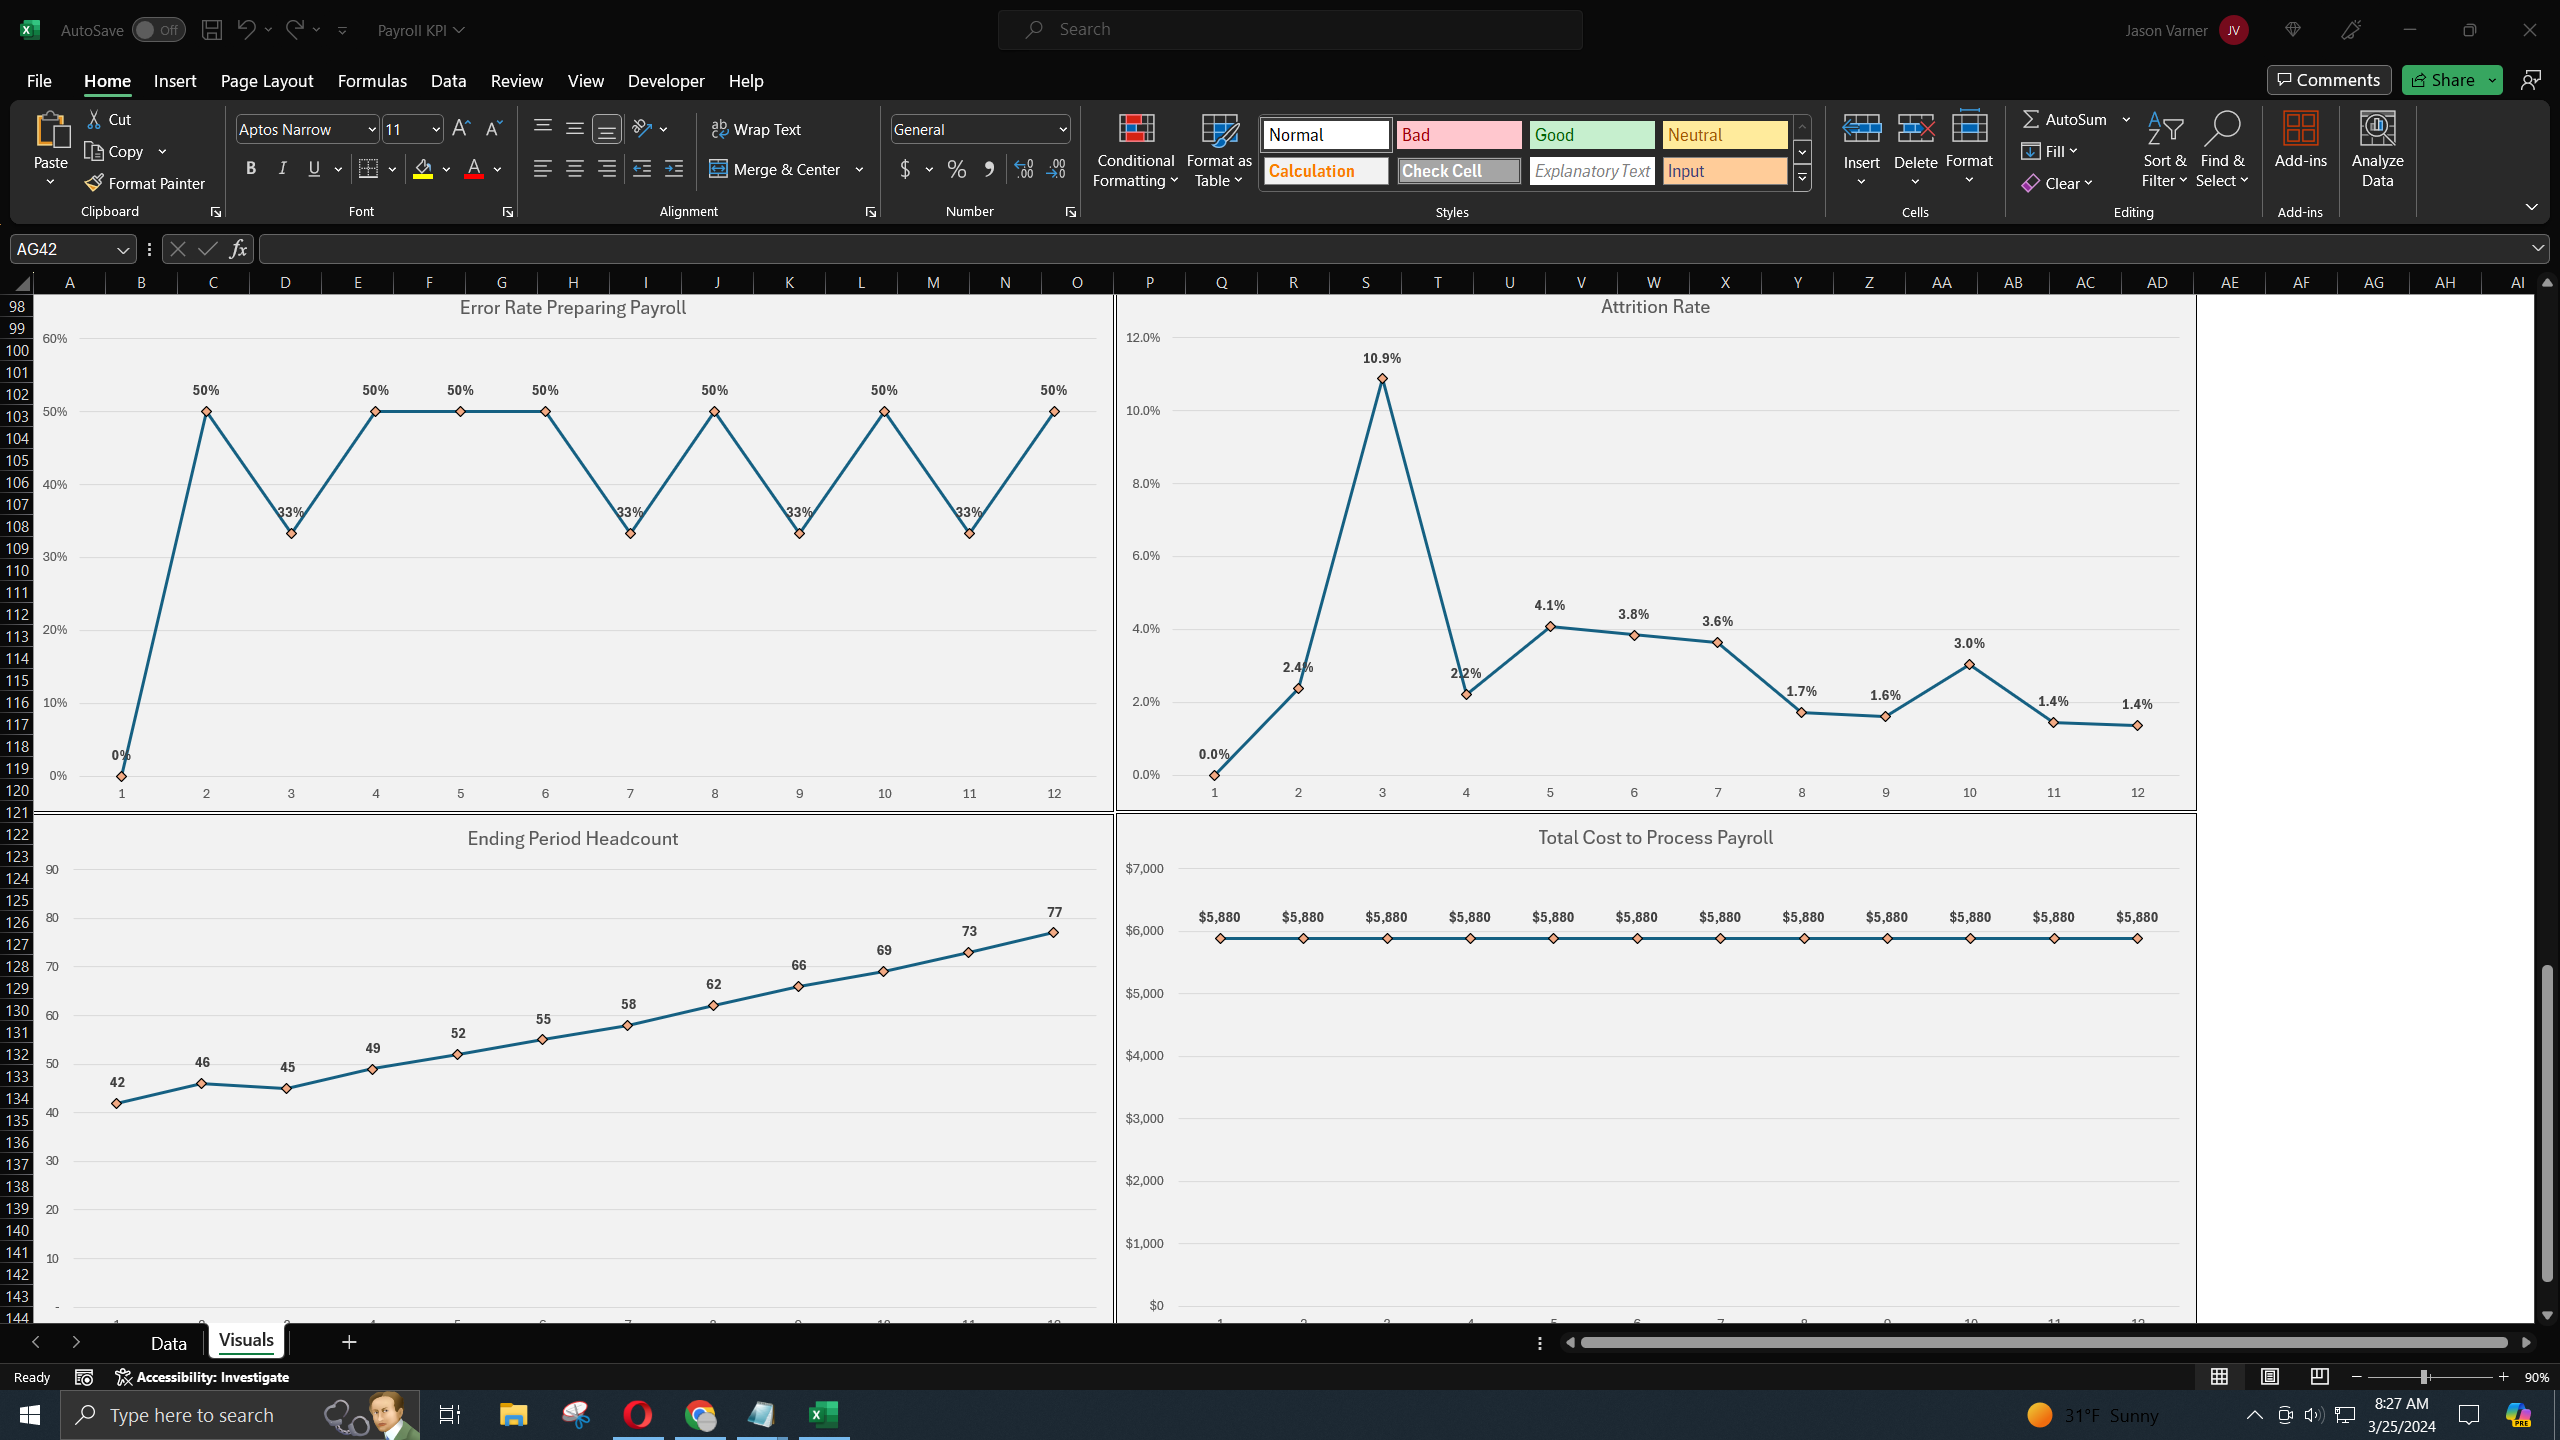
The below framework makes it easy to understand your payroll nuances. As you scale up, these things become more important. Visualizations are also included for all main output data. Make payroll your most efficient administrative process, avoiding legal issuance, ensuring compliance, and identifying any red flags in the general payroll process.
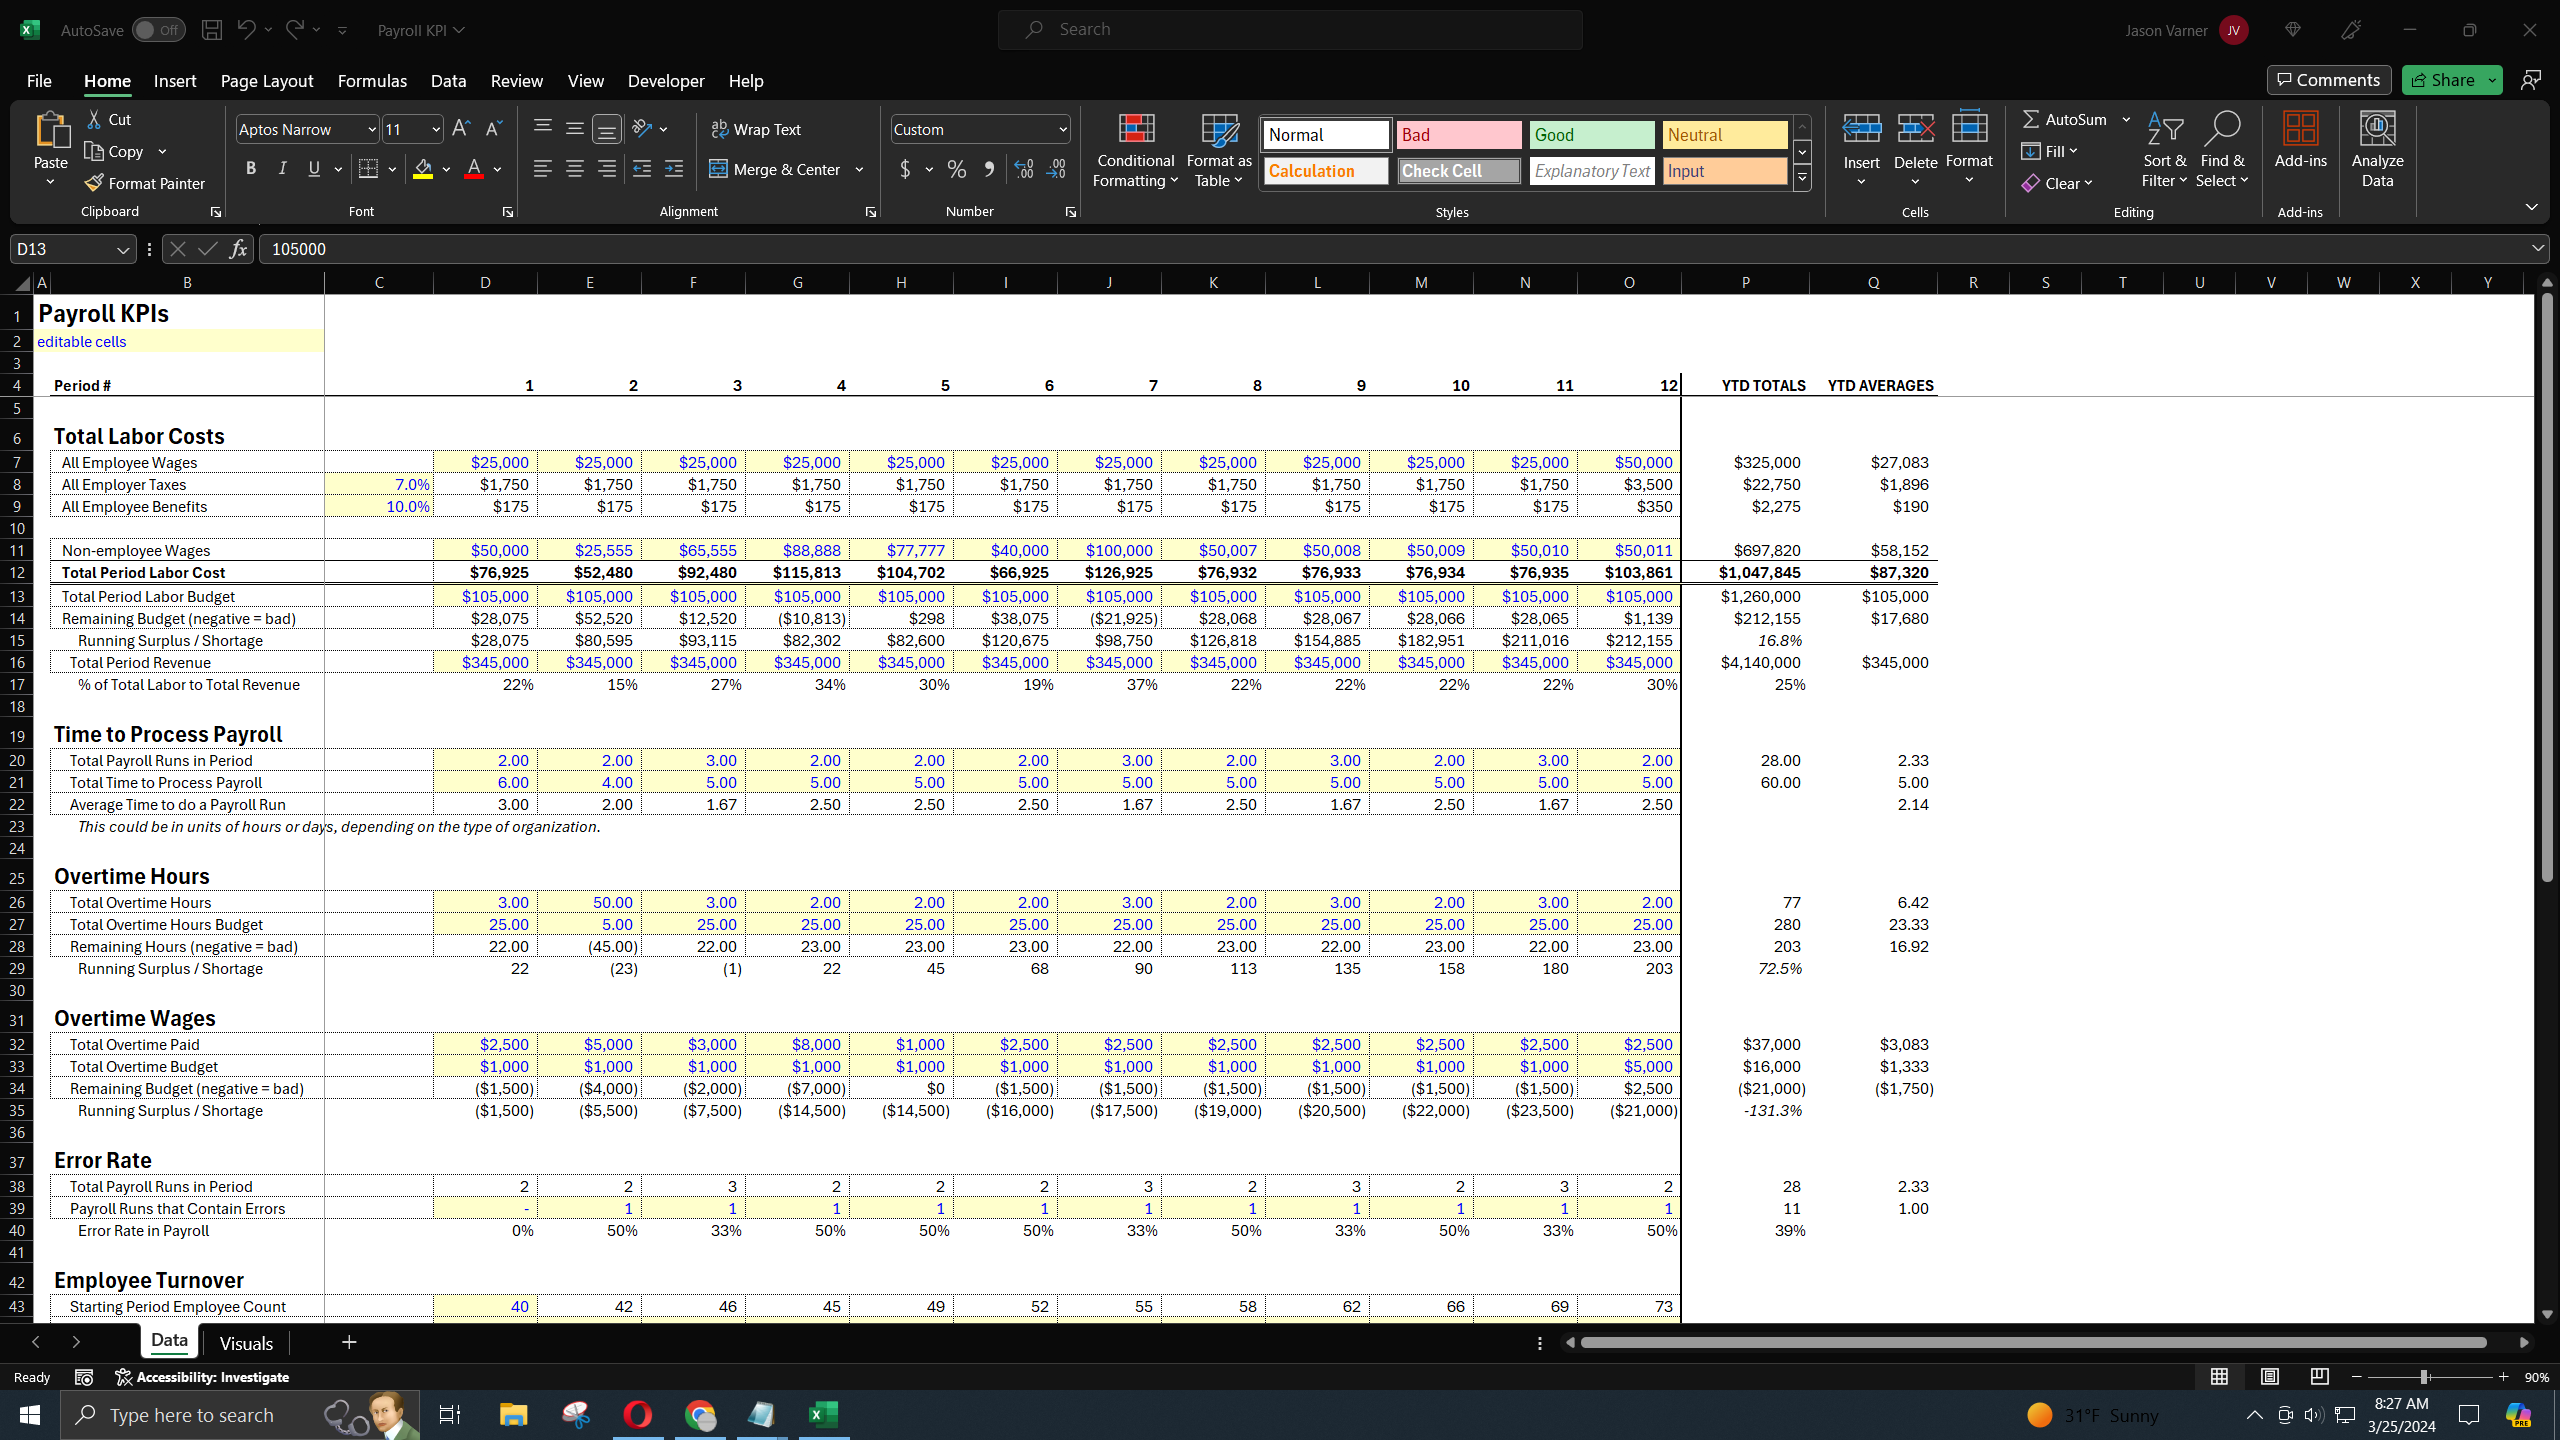
The following data points are tracked by month along with YTD totals and monthly averages:
Total Labor Costs
All Employee Wages
All Employer Taxes
All Employee Benefits
Non-employee Wages
Total Period Labor Cost
Total Period Labor Budget
Remaining Budget (negative = bad)
Running Surplus / Shortage
Total Period Revenue
% of Total Labor to Total Revenue
Time to Process Payroll
Total Payroll Runs in Period
Total Time to Process Payroll
Average Time to do a Payroll Run
This could be in units of hours or days, depending on the type of organization.
Overtime Hours
Total Overtime Hours
Total Overtime Hours Budget
Remaining Hours (negative = bad)
Running Surplus / Shortage
Overtime Wages
Total Overtime Paid
Total Overtime Budget
Remaining Budget (negative = bad)
Running Surplus / Shortage
Error Rate
Total Payroll Runs in Period
Payroll Runs that Contain Errors
Error Rate in Payroll
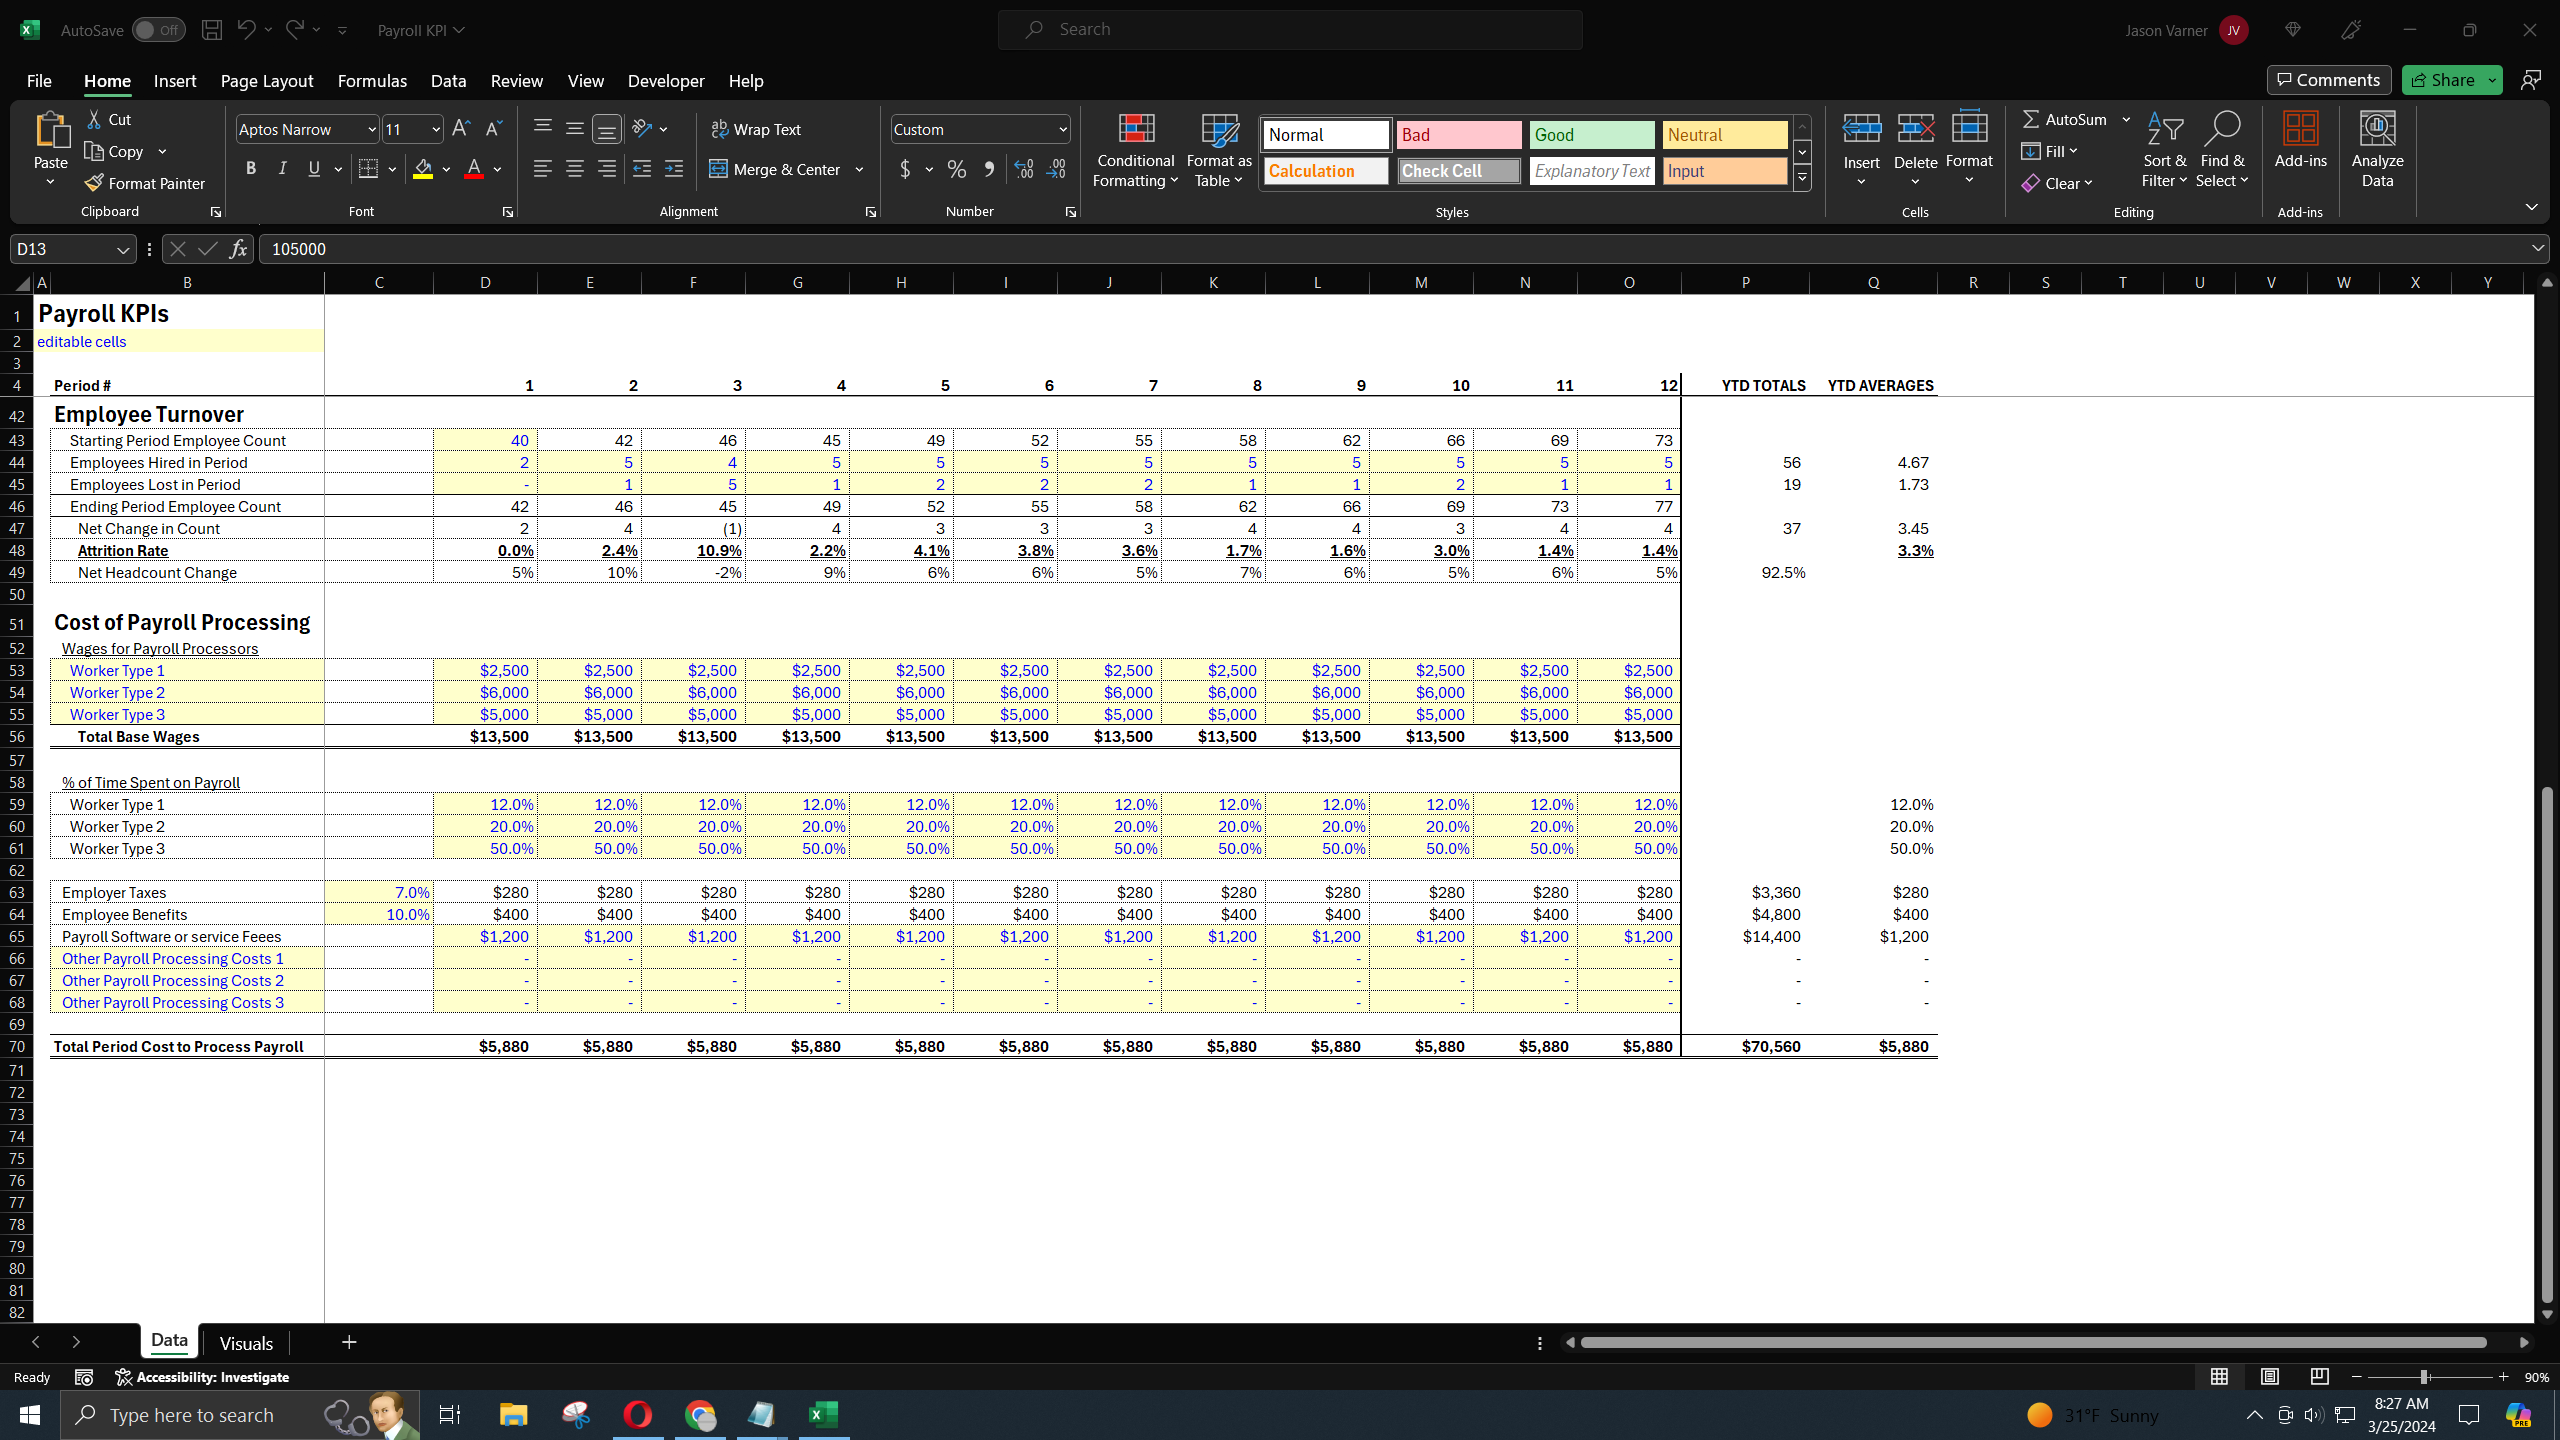
Employee Turnover
Starting Period Employee Count
Employees Hired in Period
Employees Lost in Period
Ending Period Employee Count
Net Change in Count
Attrition Rate
Net Headcount Change
Cost of Payroll Processing
Wages for Payroll Processors
Worker Type 1
Worker Type 2
Worker Type 3
Total Base Wages
% of Time Spent on Payroll
Worker Type 1
Worker Type 2
Worker Type 3
Employer Taxes
Employee Benefits
Payroll Software or service Fees
Other Payroll Processing Costs 1
Other Payroll Processing Costs 2
Other Payroll Processing Costs 3
Total Period Cost to Process Payroll
Instructional video included in file.
Got a question about the product? Email us at support@flevy.com or ask the author directly by using the "Ask the Author a Question" form. If you cannot view the preview above this document description, go here to view the large preview instead.
Source: Best Practices in Payroll Excel: Payroll KPI Dashboard Excel (XLSX) Spreadsheet, Jason Varner | SmartHelping
ABOUT THE AUTHOR
I graduated in 2011 with a Bachelor's degree in Accounting and began my career as a financial analyst at a small chain of auto repair shops. After gaining valuable experience, I launched my own practice specializing in real estate underwriting, later expanding into general business modeling.
I honed my spreadsheet modeling expertise by completing over 400 projects on Upwork with a 100% success
... [read more]
Ask the Author a Question
You must be logged in to contact the author.
