

Pay Off Debt or Invest Simulation – Excel XLSX
Excel (XLSX)
VIDEO DEMO
DEBT EXCEL DESCRIPTION
Deciding to pay off debt or invest will depend on a wide range of factors. This Excel template is designed to take into consideration as many factors as logically useful and give an answer as to the best possible outcome when deciding to put a fixed amount of money into various investments or pay down debt.
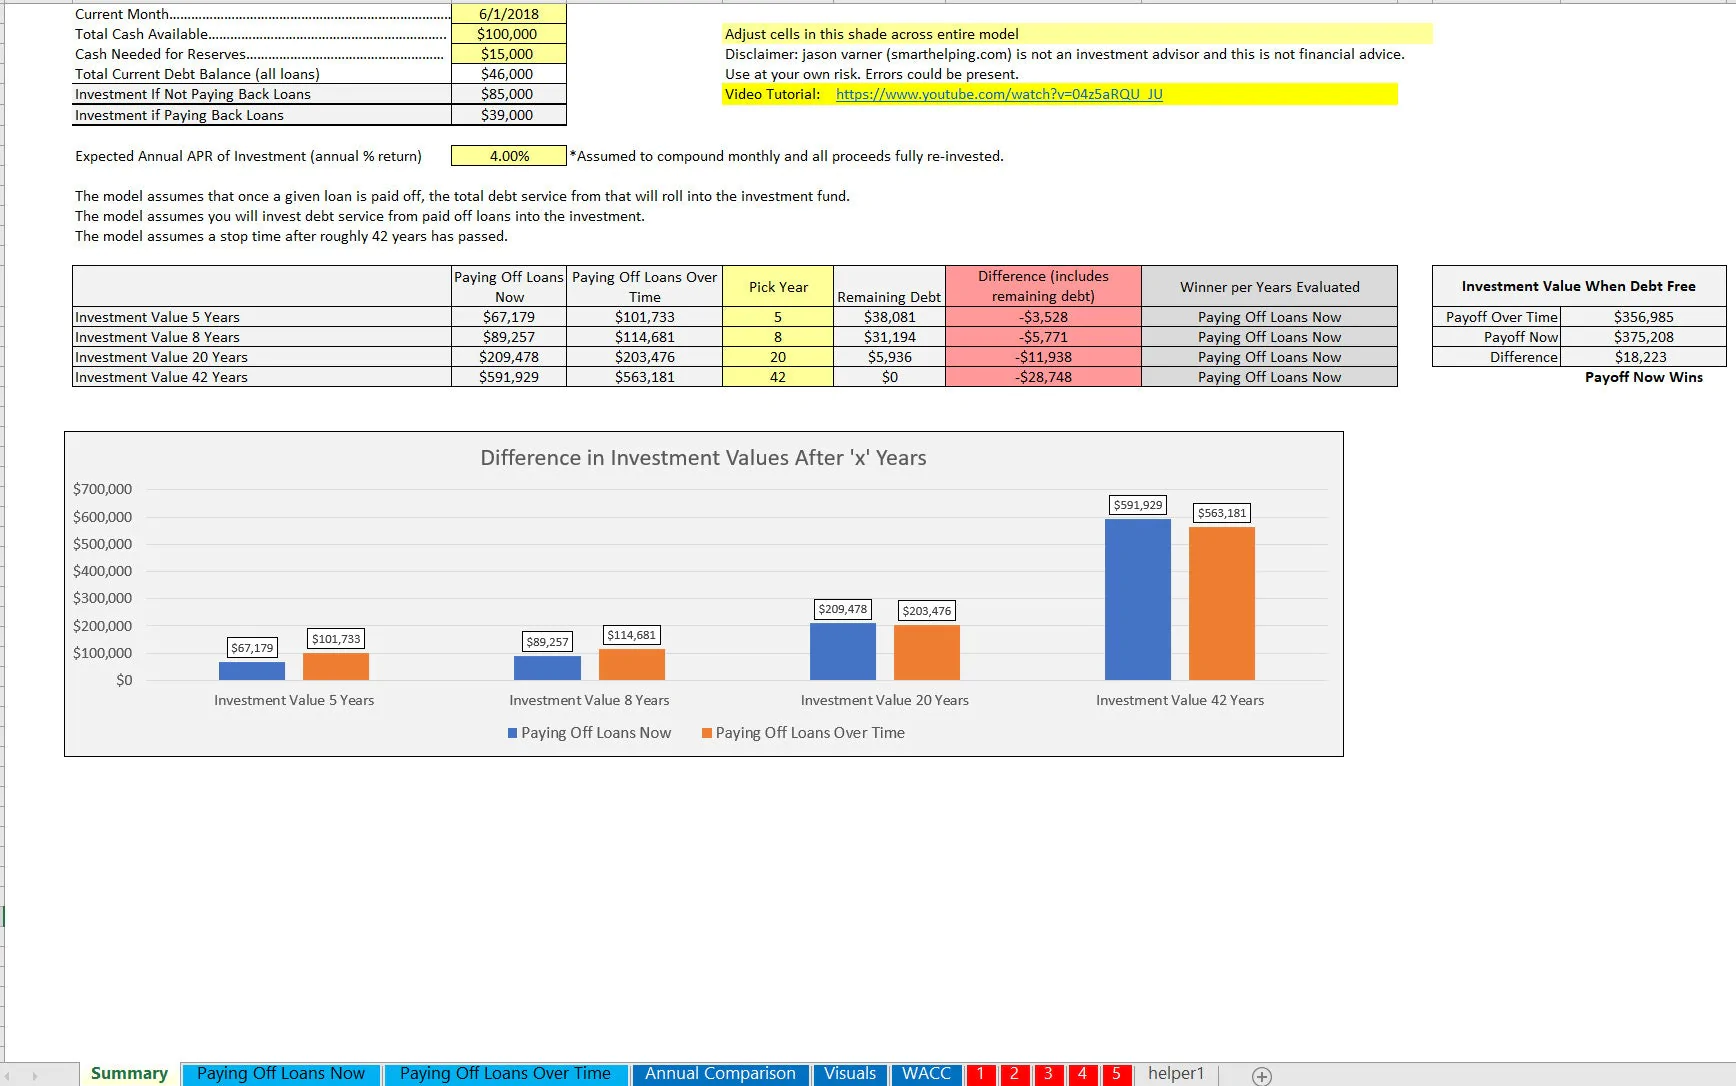
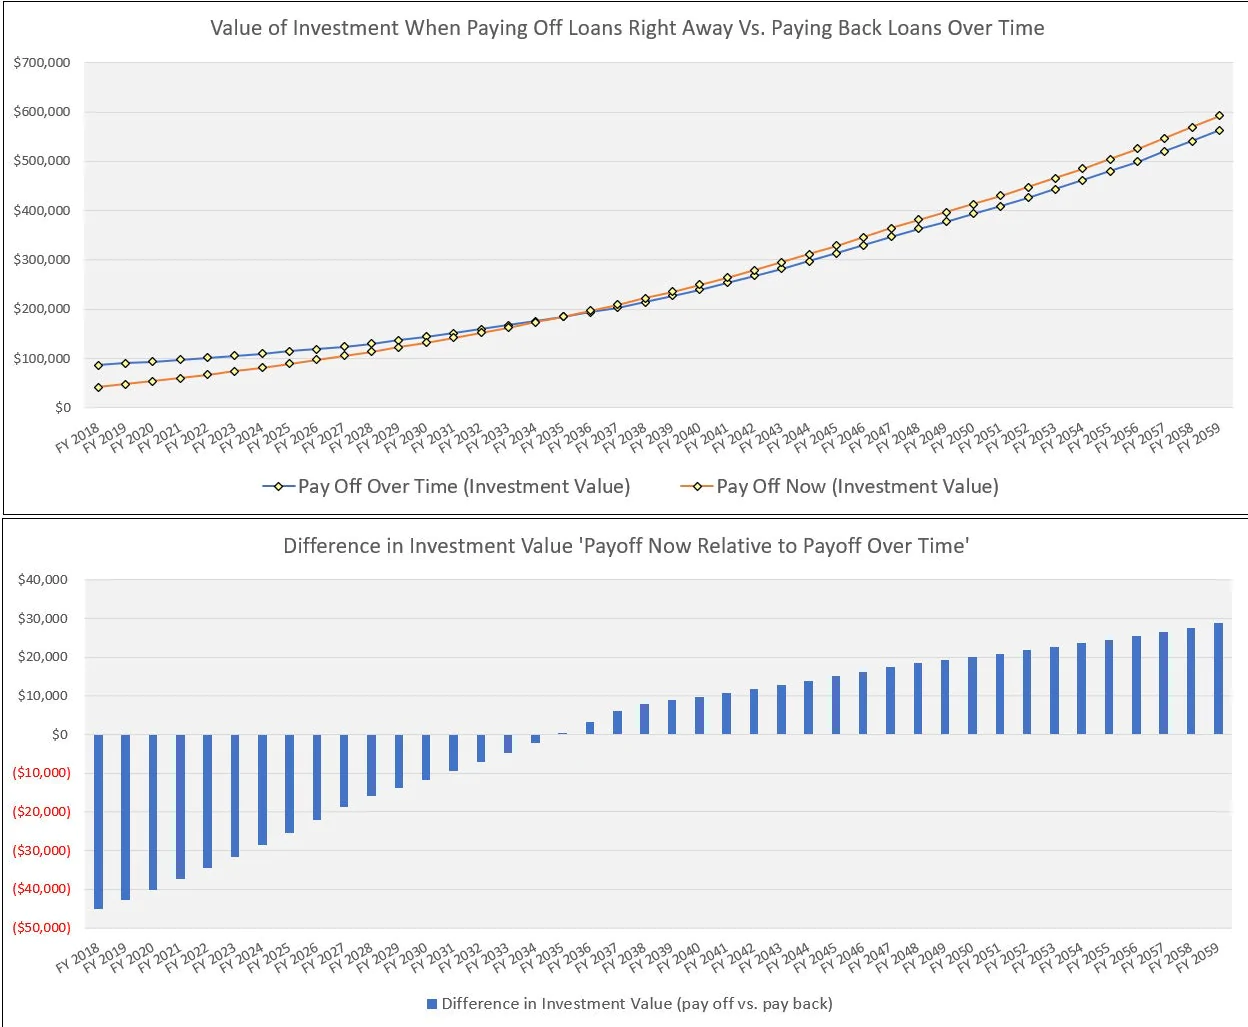
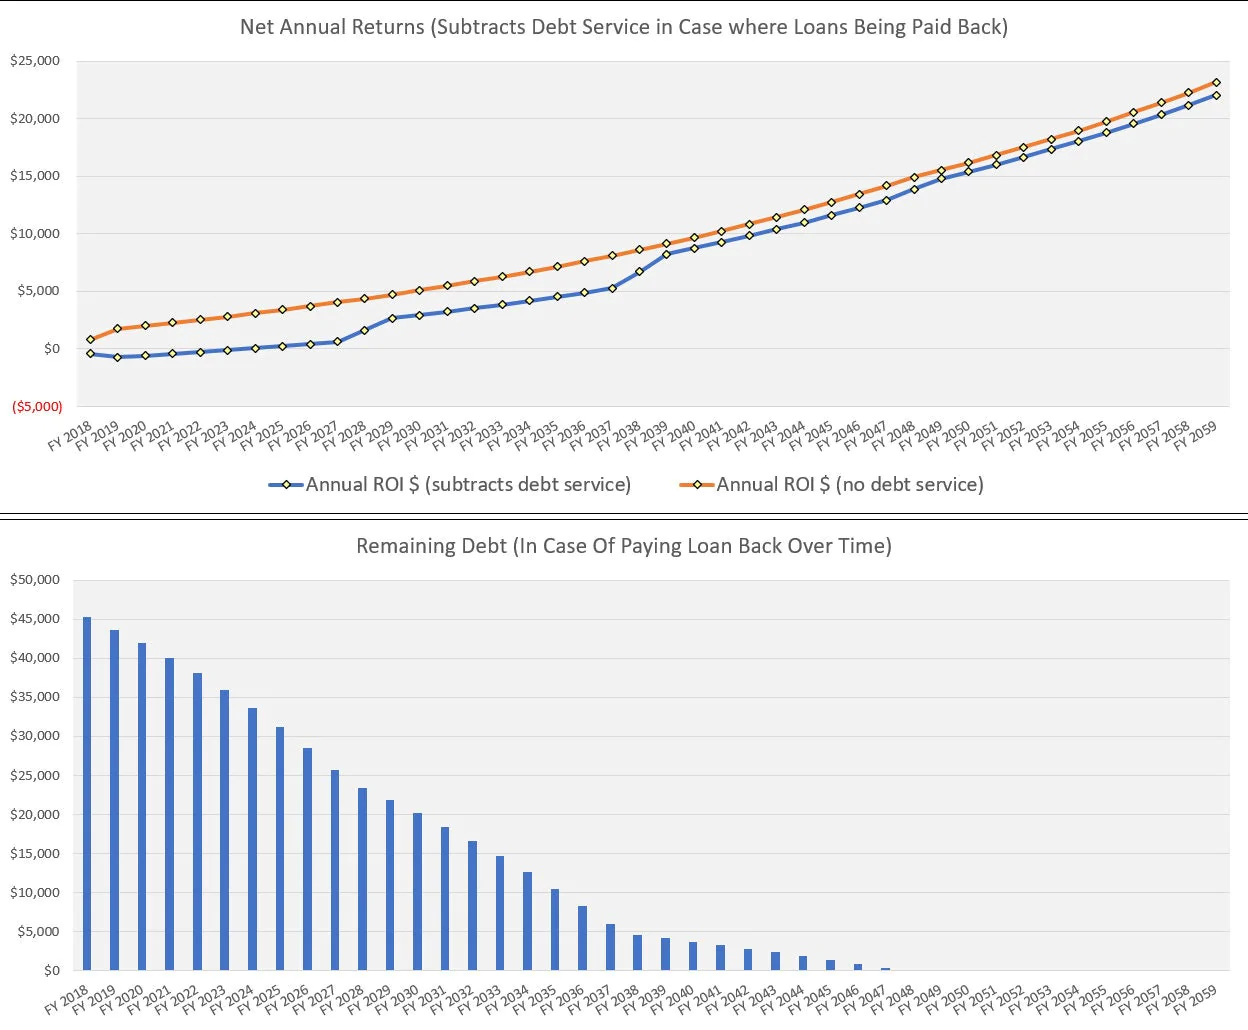
The model is designed to show side-by-side comparisons of what happens if all debt is paid off immediately or if the money is invested in something that yields a defined annual return and while the loans get paid off over time.
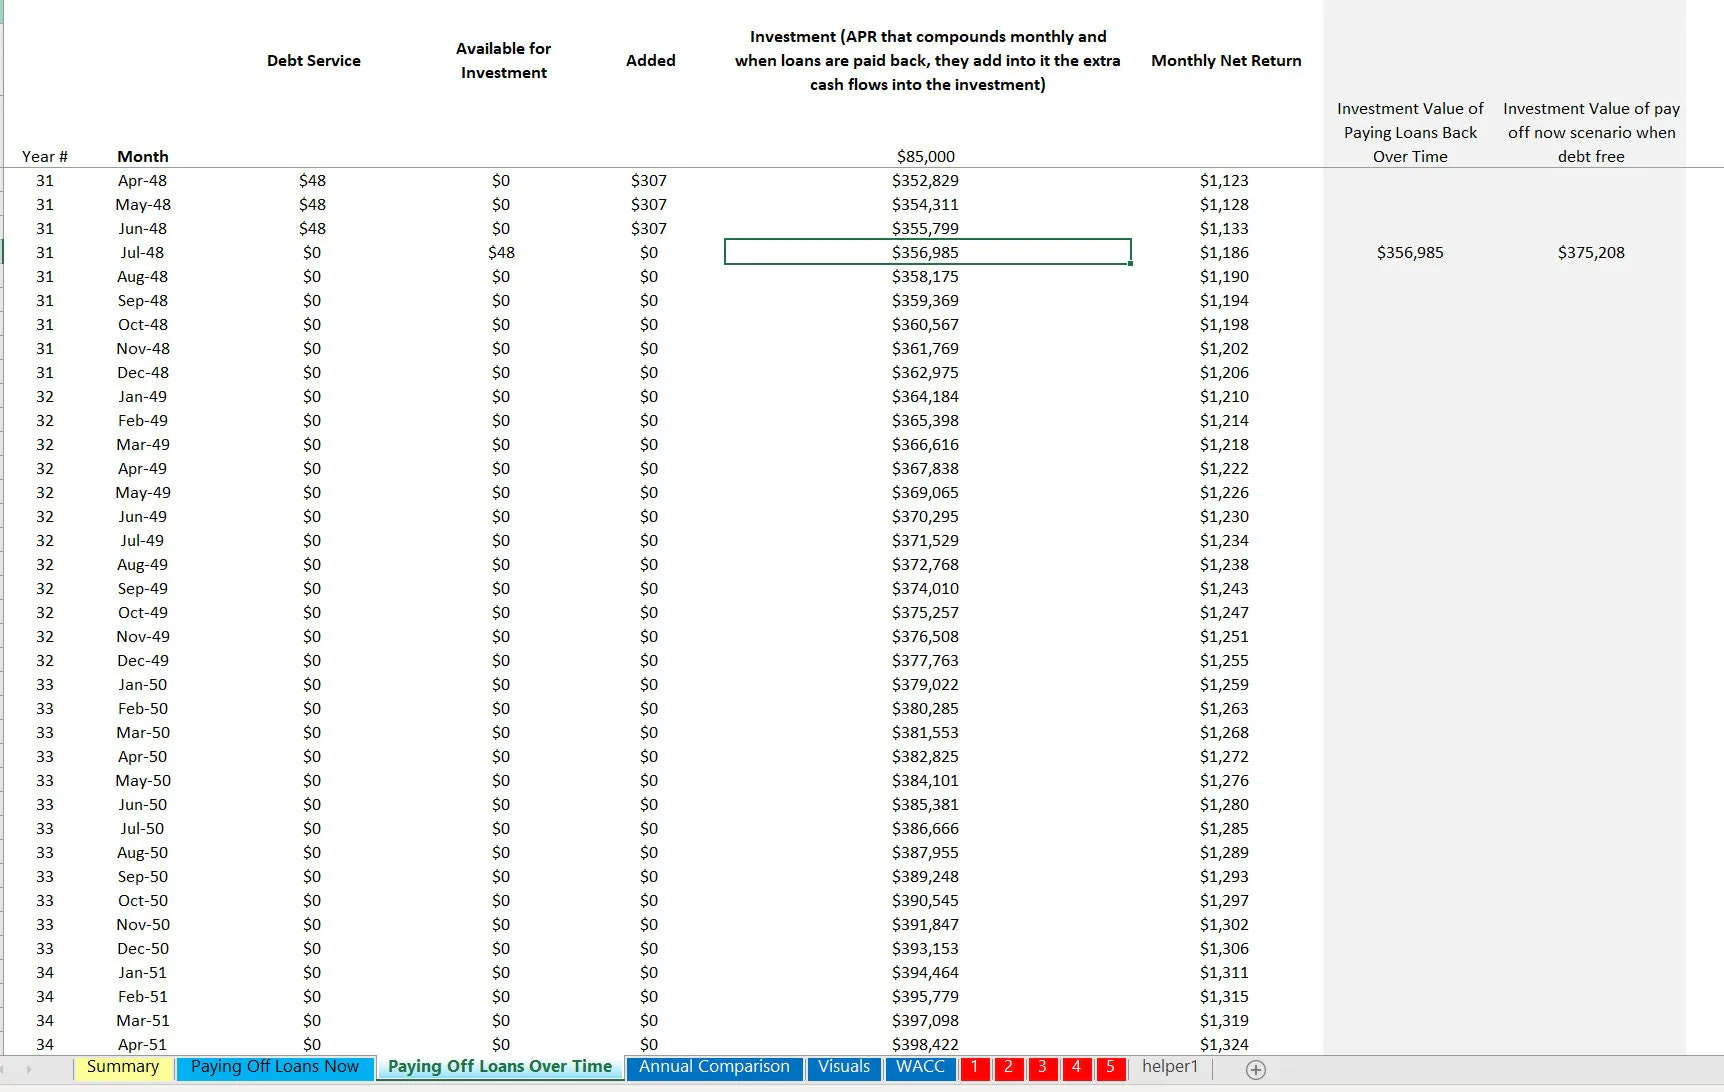
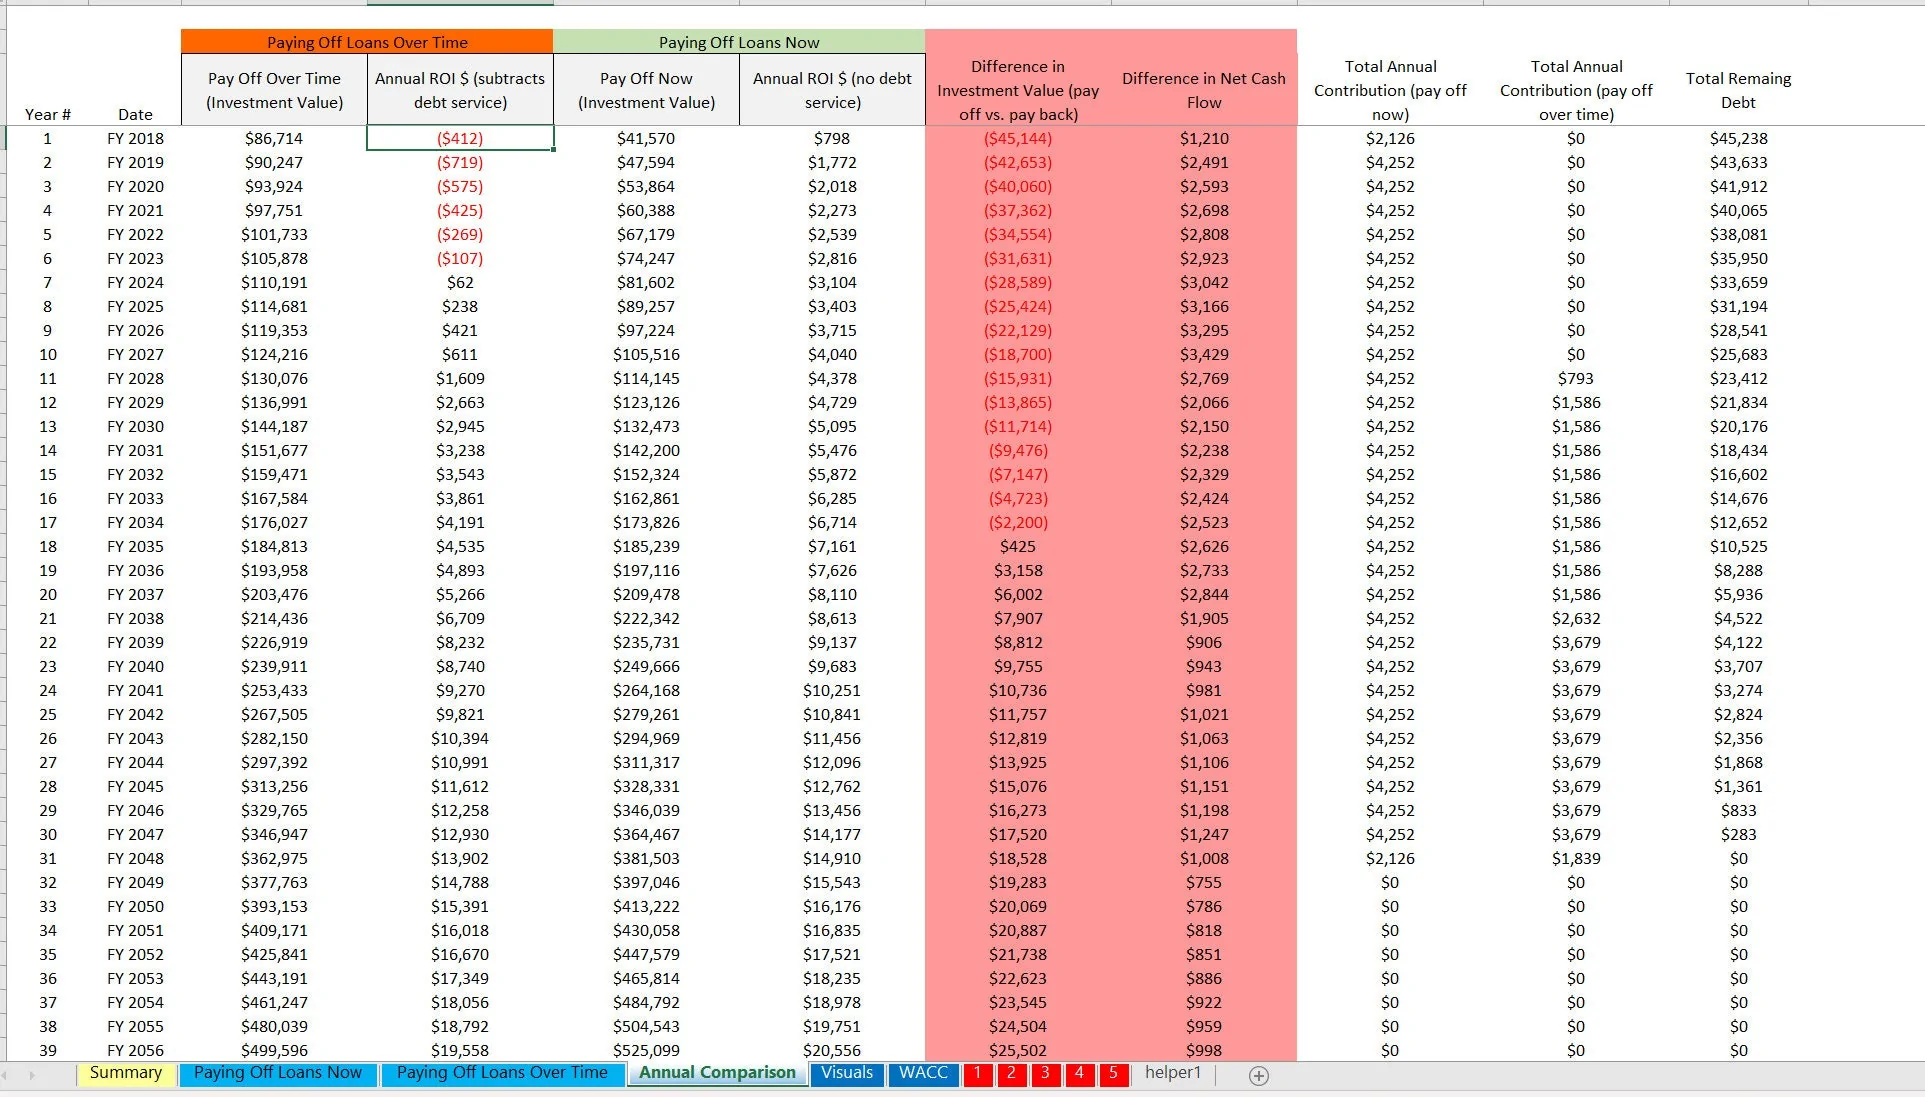
The final comparative number is the total net asset value at the end of a given year in the future (up to 42 years). What you will find is there will be a point in the future when the total value will be greater by paying off loans now, but that will depend on all the loan terms that exist, their balances, the amount you have to invest compared to that, and the investment rate of return.
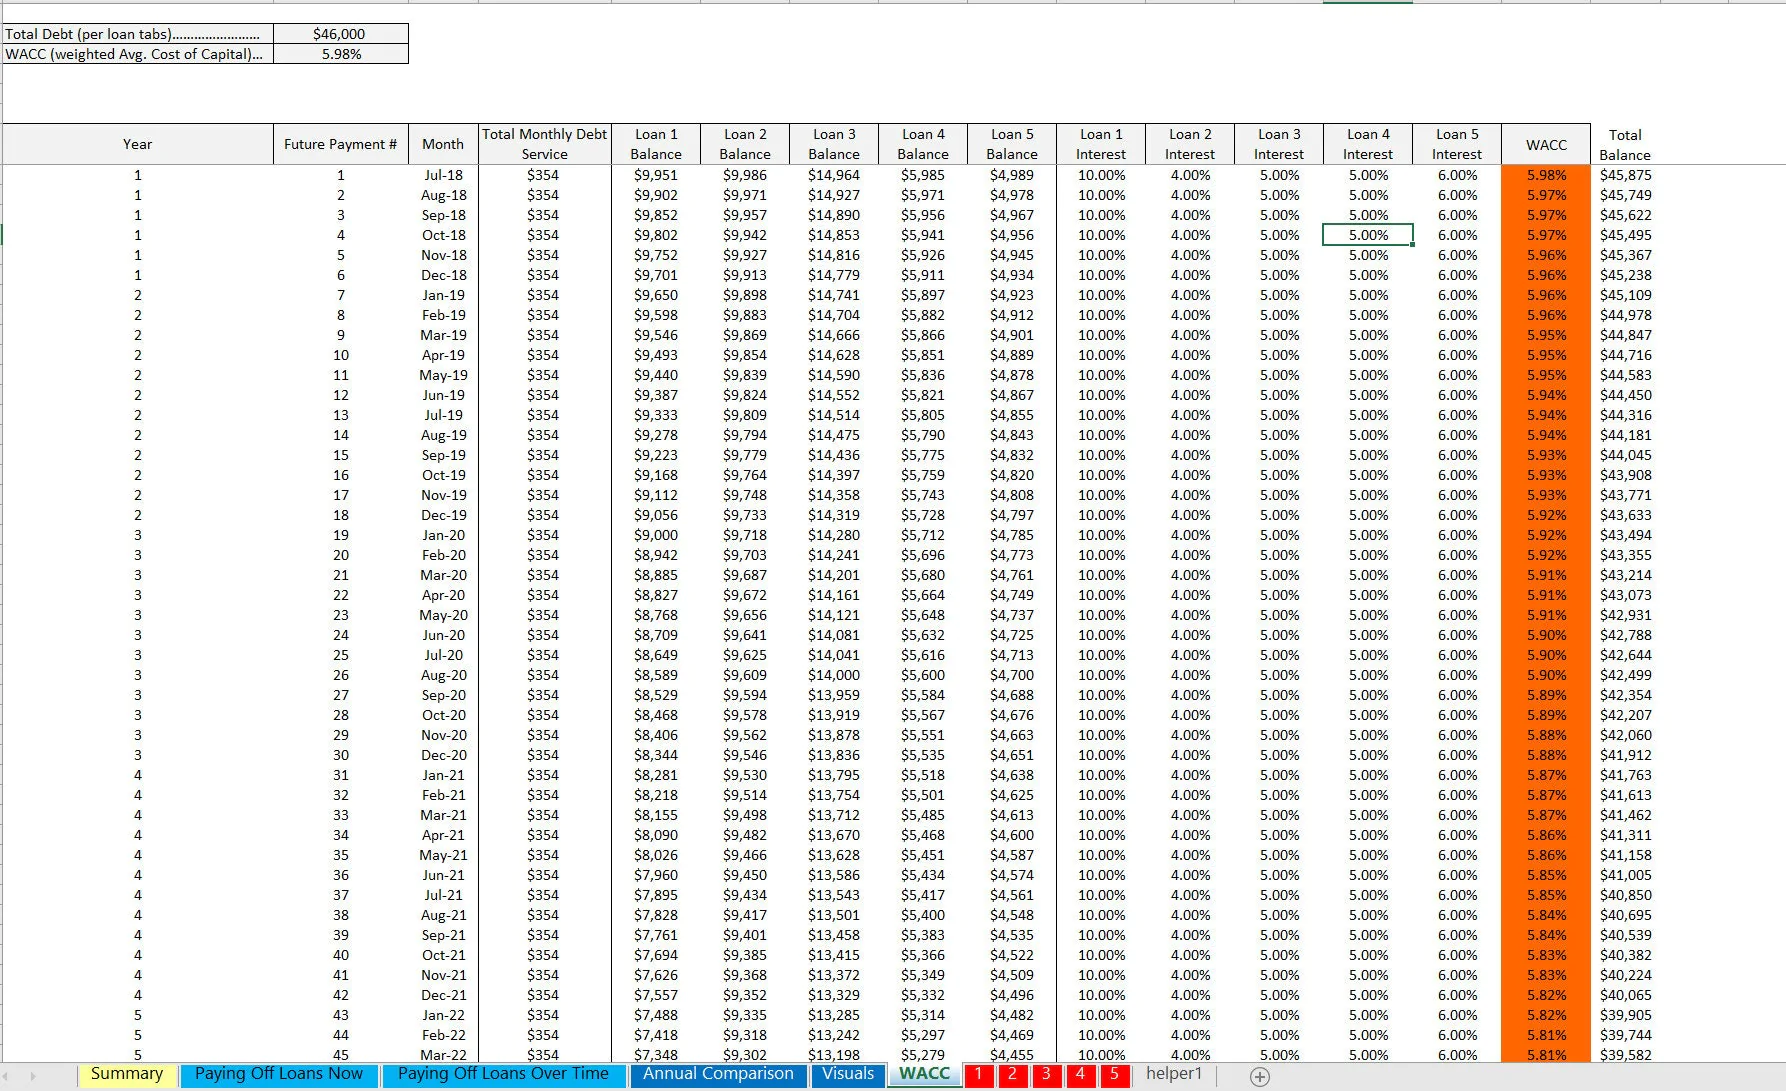
You can model up to 5 loans in this all with their own balances / amortization terms. You can also choose up to 4 points in time in the future and view the ‘value' after that number of years has passed.
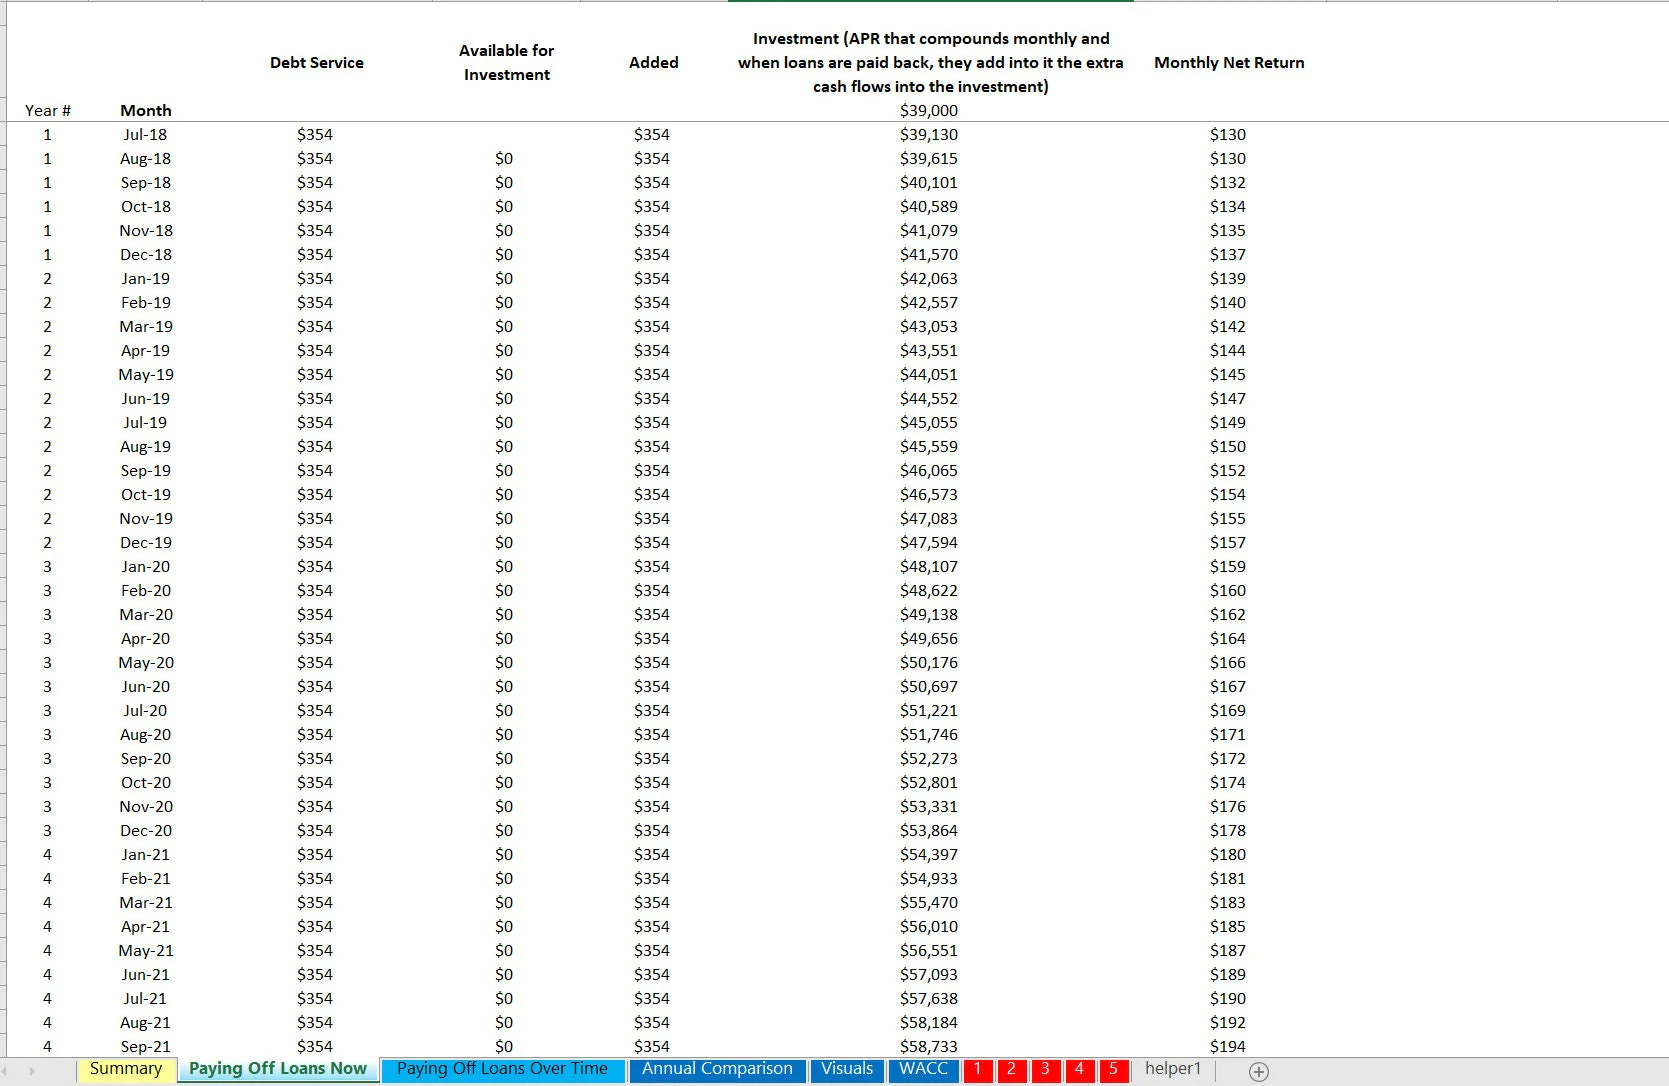
There is a monthly and annual comparison of doing either as well as visualizations to make the numbers much more digestible.
Also, there is a WACC tab for calculations in each period.
This is a personal finance tool. One of the most common and difficult decisions to make is if the money you have not is better spent on investments or to pay off current debts.
Normally, the decision is primarily going to revolve around your expected returns vs. the interest rate of the debt as well as the terms of each loan as well as uncertainty about the investment returns.
There are lots of factors to consider and sometimes these things are obvious without doing some financial analysis around the scenarios.
The template includes detailed monthly and annual projections, allowing for granular analysis of debt repayment versus investment growth. Visual aids and comparative charts simplify complex data, making it easier to identify the most financially advantageous strategy.
Got a question about the product? Email us at support@flevy.com or ask the author directly by using the "Ask the Author a Question" form. If you cannot view the preview above this document description, go here to view the large preview instead.
Source: Best Practices in Debt Excel: Pay Off Debt or Invest Simulation Excel (XLSX) Spreadsheet, Jason Varner | SmartHelping
ABOUT THE AUTHOR
I graduated in 2011 with a Bachelor's degree in Accounting and began my career as a financial analyst at a small chain of auto repair shops. After gaining valuable experience, I launched my own practice specializing in real estate underwriting, later expanding into general business modeling.
I honed my spreadsheet modeling expertise by completing over 400 projects on Upwork with a 100% success
... [read more]
Ask the Author a Question
You must be logged in to contact the author.
