
 Click main image to view in full screen. Unlock all 13 preview images:
Office Occupancy Cost Allocation Model – Excel XLSX
Excel (XLSX)


BENEFITS OF THIS DOWNLOADABLE EXCEL DOCUMENT
- Allocates occupancy costs using a multi-tier gross-up method that mirrors enterprise IWMS platforms.
- Generates individual, audit-ready cost statements for department heads and a summary dashboard for the CFO.
- Prevents reporting errors with built-in reconciliations, sense checks, and exception tracking.
FACILITY MANAGEMENT EXCEL DESCRIPTION
WHAT THIS SOLVES
An occupier takes more than one floor. Rent, business rates, service charge, utilities and FM operating costs are one of the largest lines in the business. Finance needs to know what each department should carry, and every department head wants to know why their figure moved since last time.
Allocating by area sounds simple until five awkward cases appear, each of which needs an answer that survives a meeting:
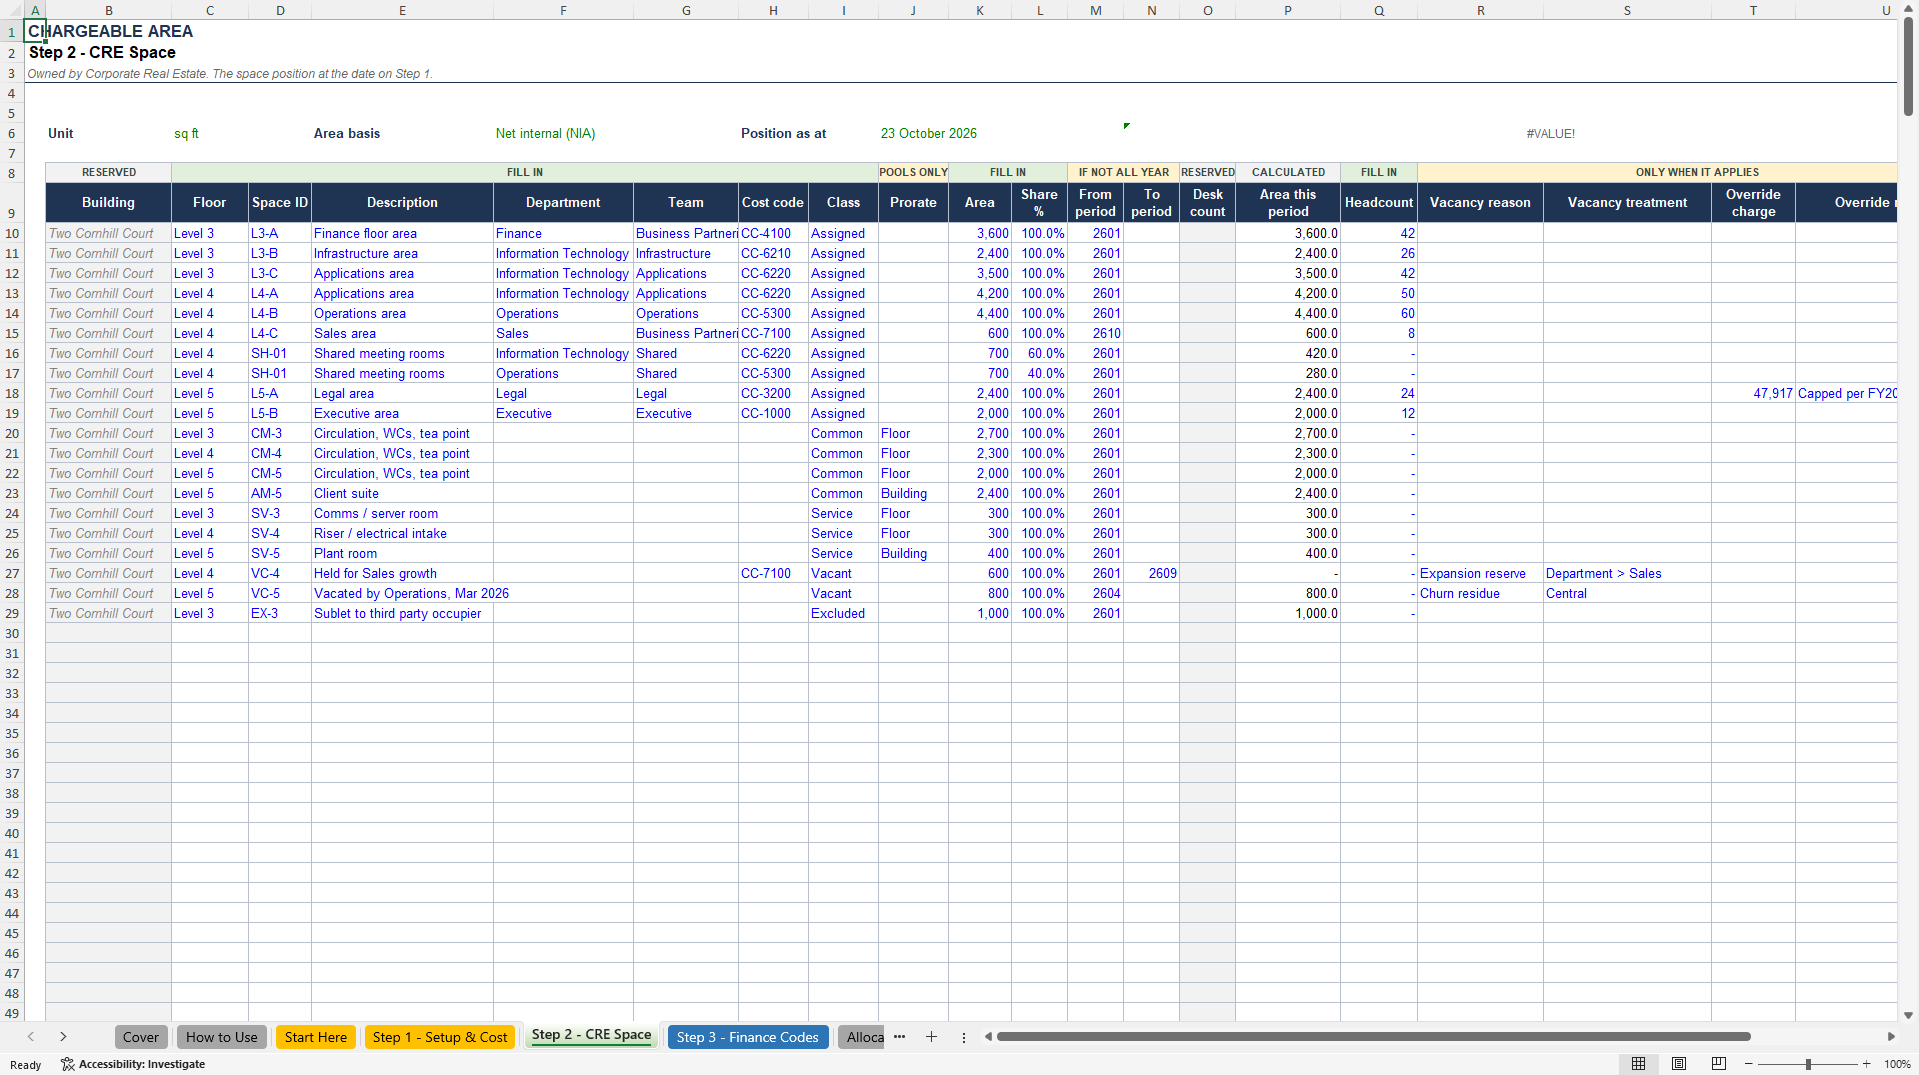
• Circulation, WCs and tea points. No department owns them; everybody uses them.
• The client suite on the top floor. Only the departments on that floor, or the whole business?
• A meeting suite shared by two departments. How is it split?
• Vacant space. Who carries the cost of an empty floorplate?
• Space sublet to a third party. It should not sit in the internal allocation at all.
Enterprise IWMS platforms handle all of this, at enterprise prices. Mid-market occupiers end up assembling something in spreadsheets that stops reconciling halfway through. This model closes that gap: the method the enterprise systems use, at the cost of a spreadsheet.
THE METHOD
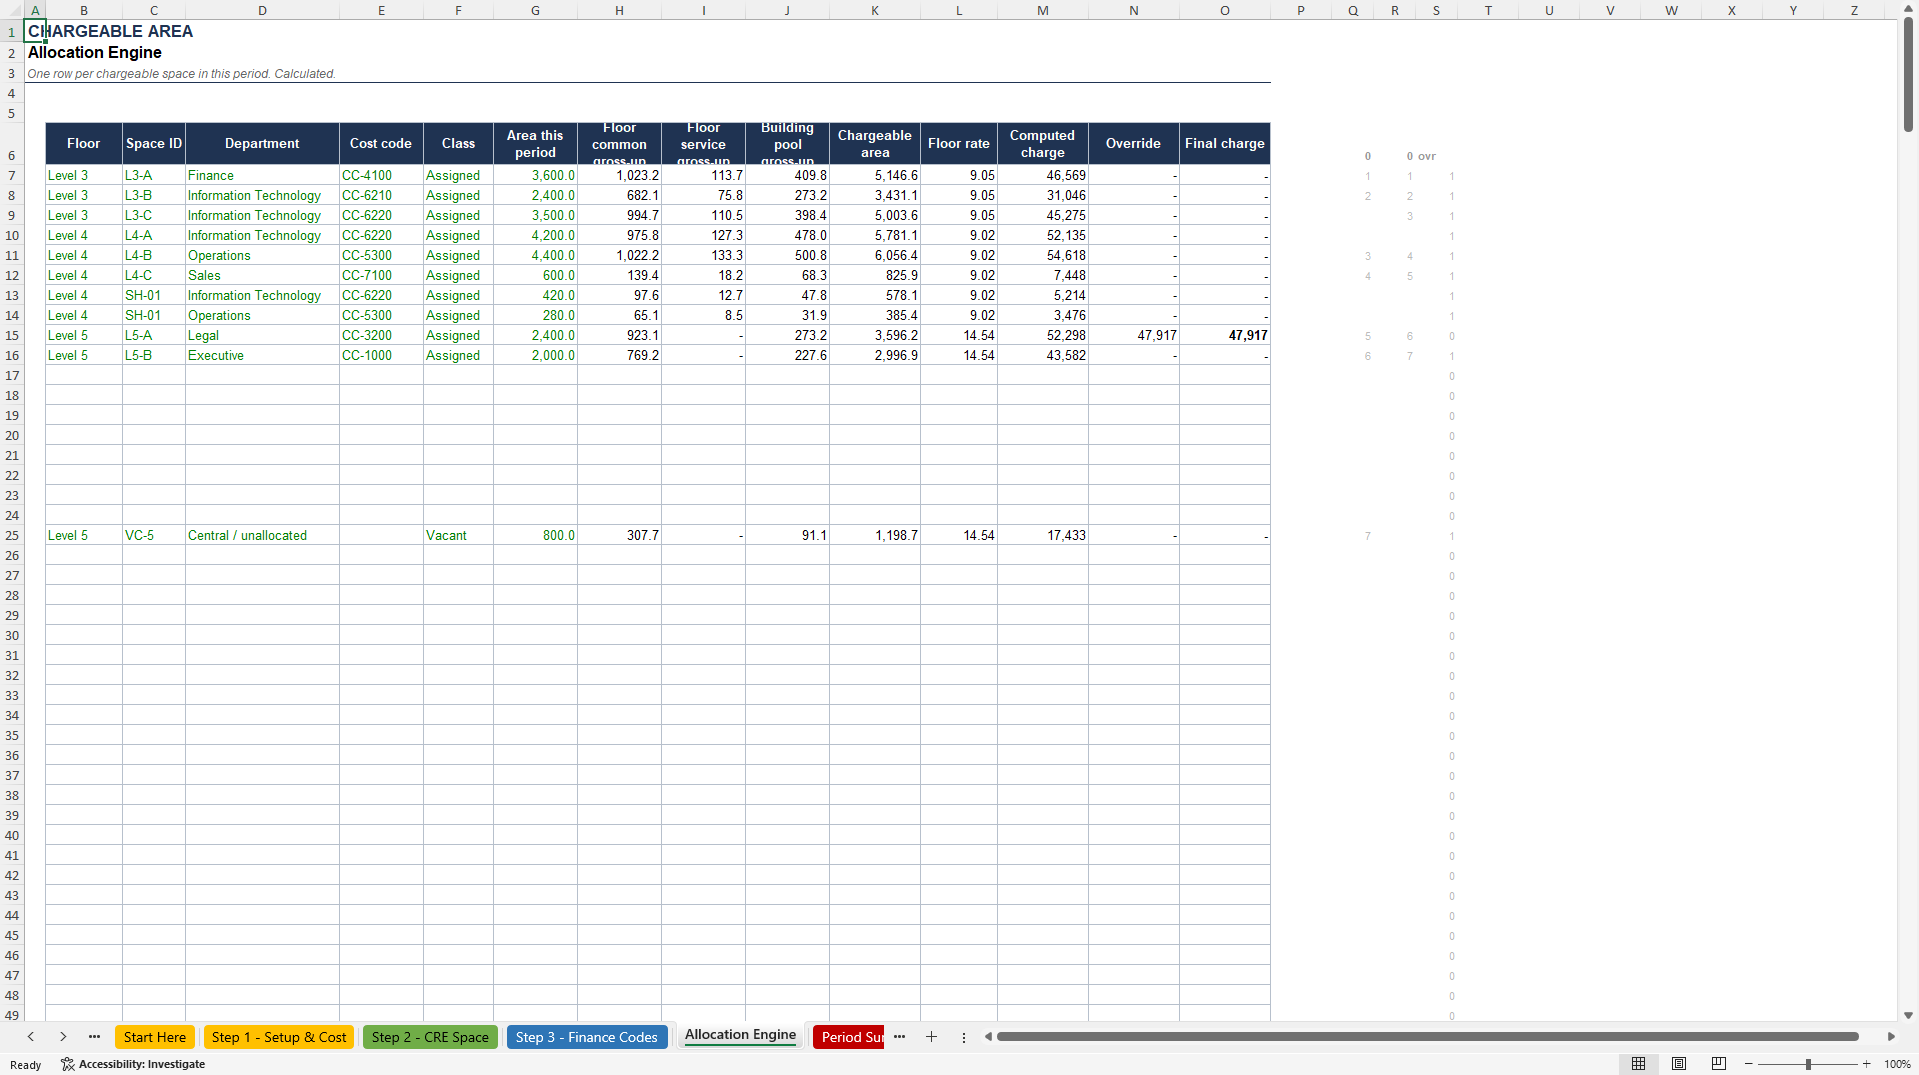
Multi-tier gross-up. Every non-departmental area states the level it is shared at. Floor-level areas are grossed up within their own floor; building-level areas are shared across every department, wherever it sits. Single-tier models systematically overcharge whichever floor happens to host the shared amenity – and the departments on that floor will say so.
Common and service areas are kept apart. Circulation, WCs, reception and amenity in one pool; plant, risers, comms rooms and stores in another. When a department head questions the uplift, you answer with two numbers instead of one.
Each floor carries its own rate. A cost line is either building-wide or specific to one floor, so a refurbishment amortisation stays with the occupiers of the floor that was refurbished.
Vacant space is handled explicitly. Held centrally by default, or charged to a named department that reserved it, or spread pro-rata – set as a policy and overridden row by row. Vacant space also carries its share of the floor pool, so the reported cost of empty space is the true cost of holding it.
Sublet and third-party space is removed from both the area base and the cost base before anything is allocated.
Period-based. The model works one period at a time using YYMM period codes, so a mid-year rent review is a second cost line rather than a restatement, and a department that moved in halfway through is not charged for the whole year. Monthly, quarterly and annual reporting all use the same machinery.
WHAT YOU GET
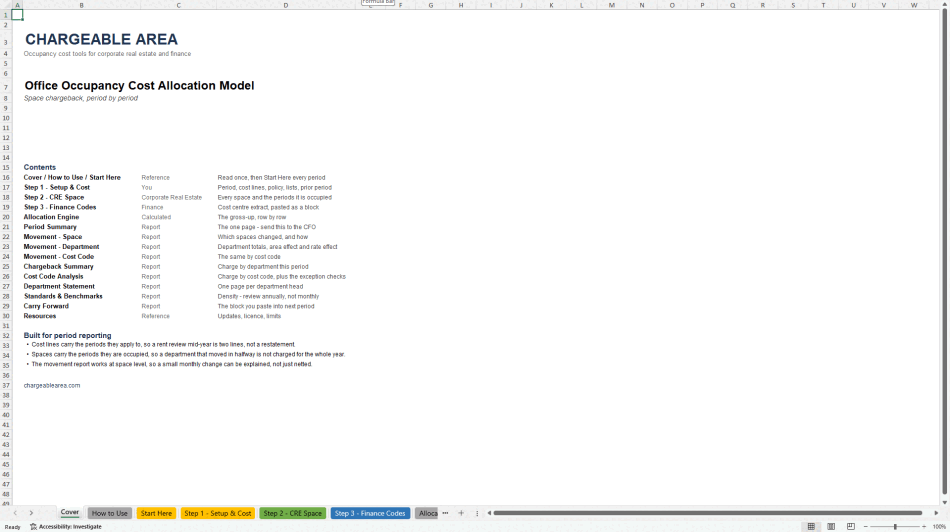
• Excel workbook: 17 sheets, no macros, Excel 2013 and later
• Method and user guide, English: illustrated, 15 pages
• Method and user guide, Traditional Chinese: illustrated, 16 pages
• Free updates for the life of the product
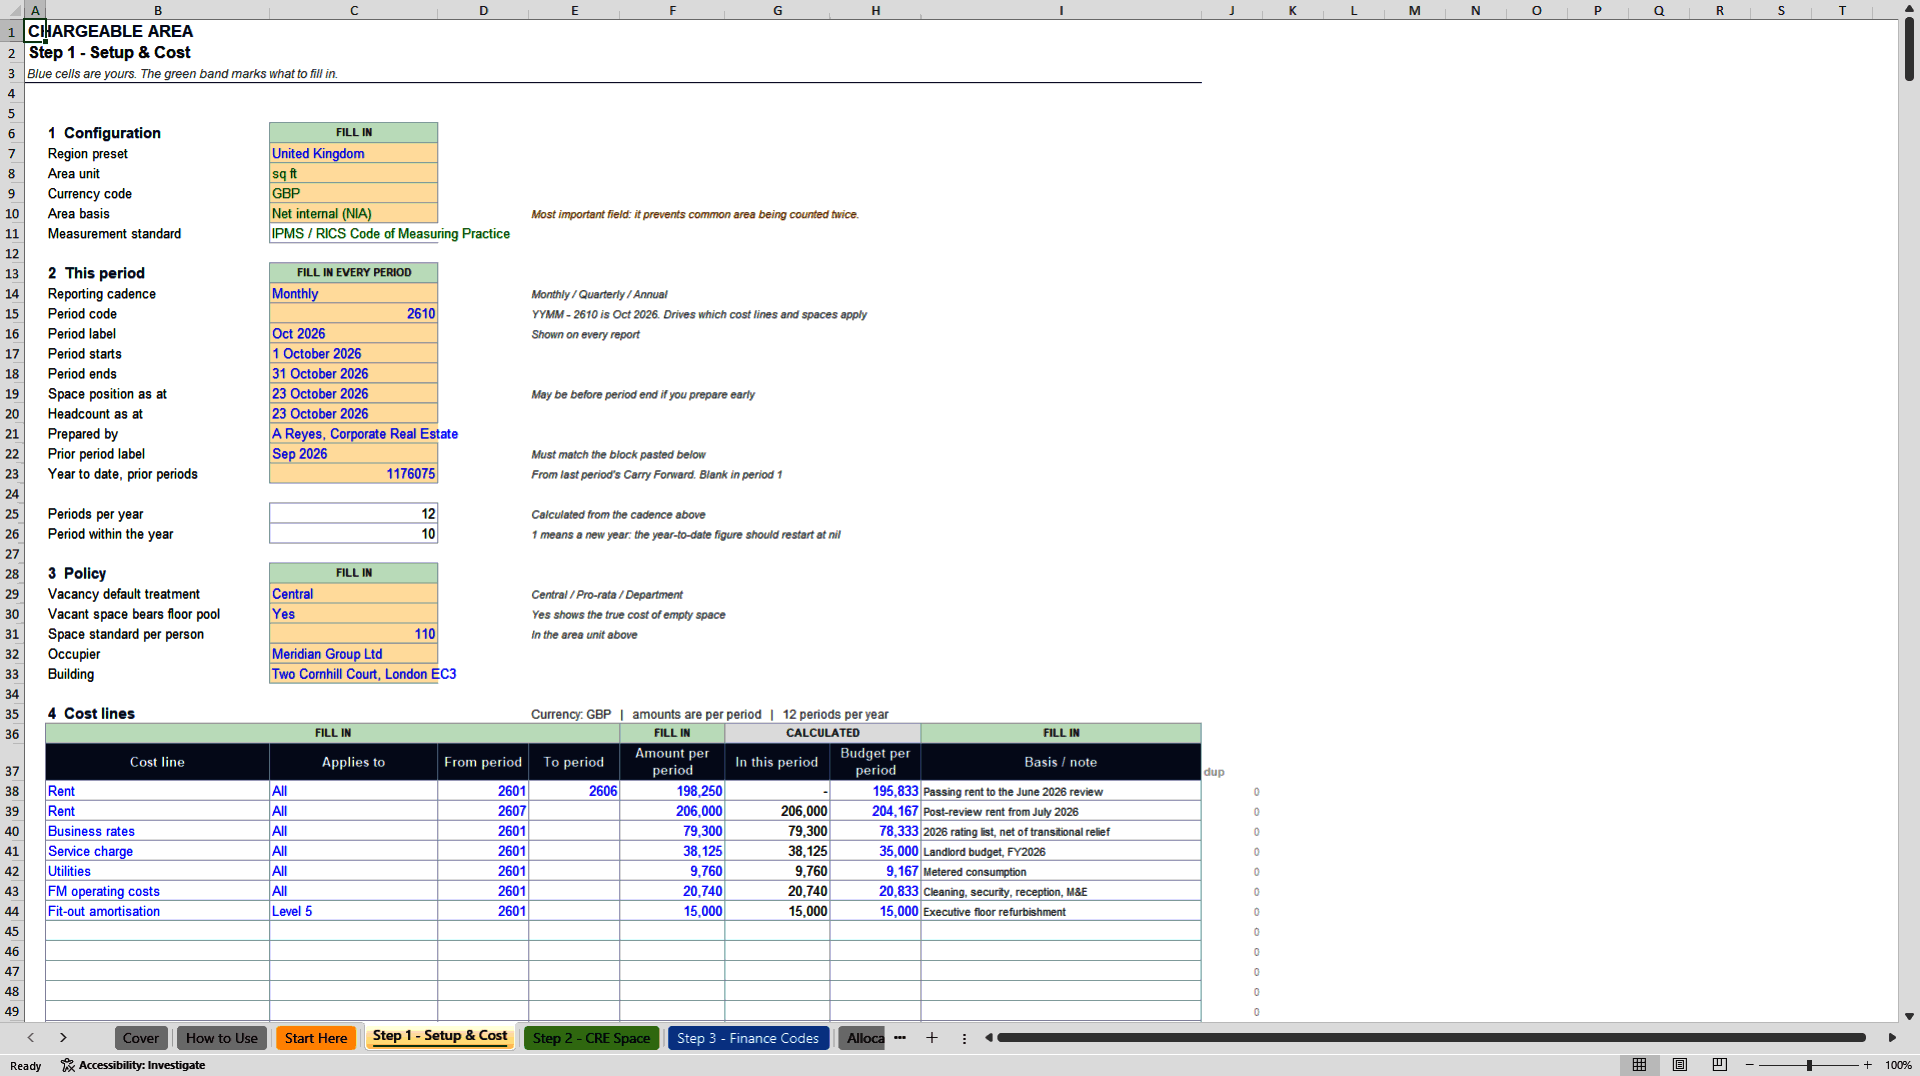
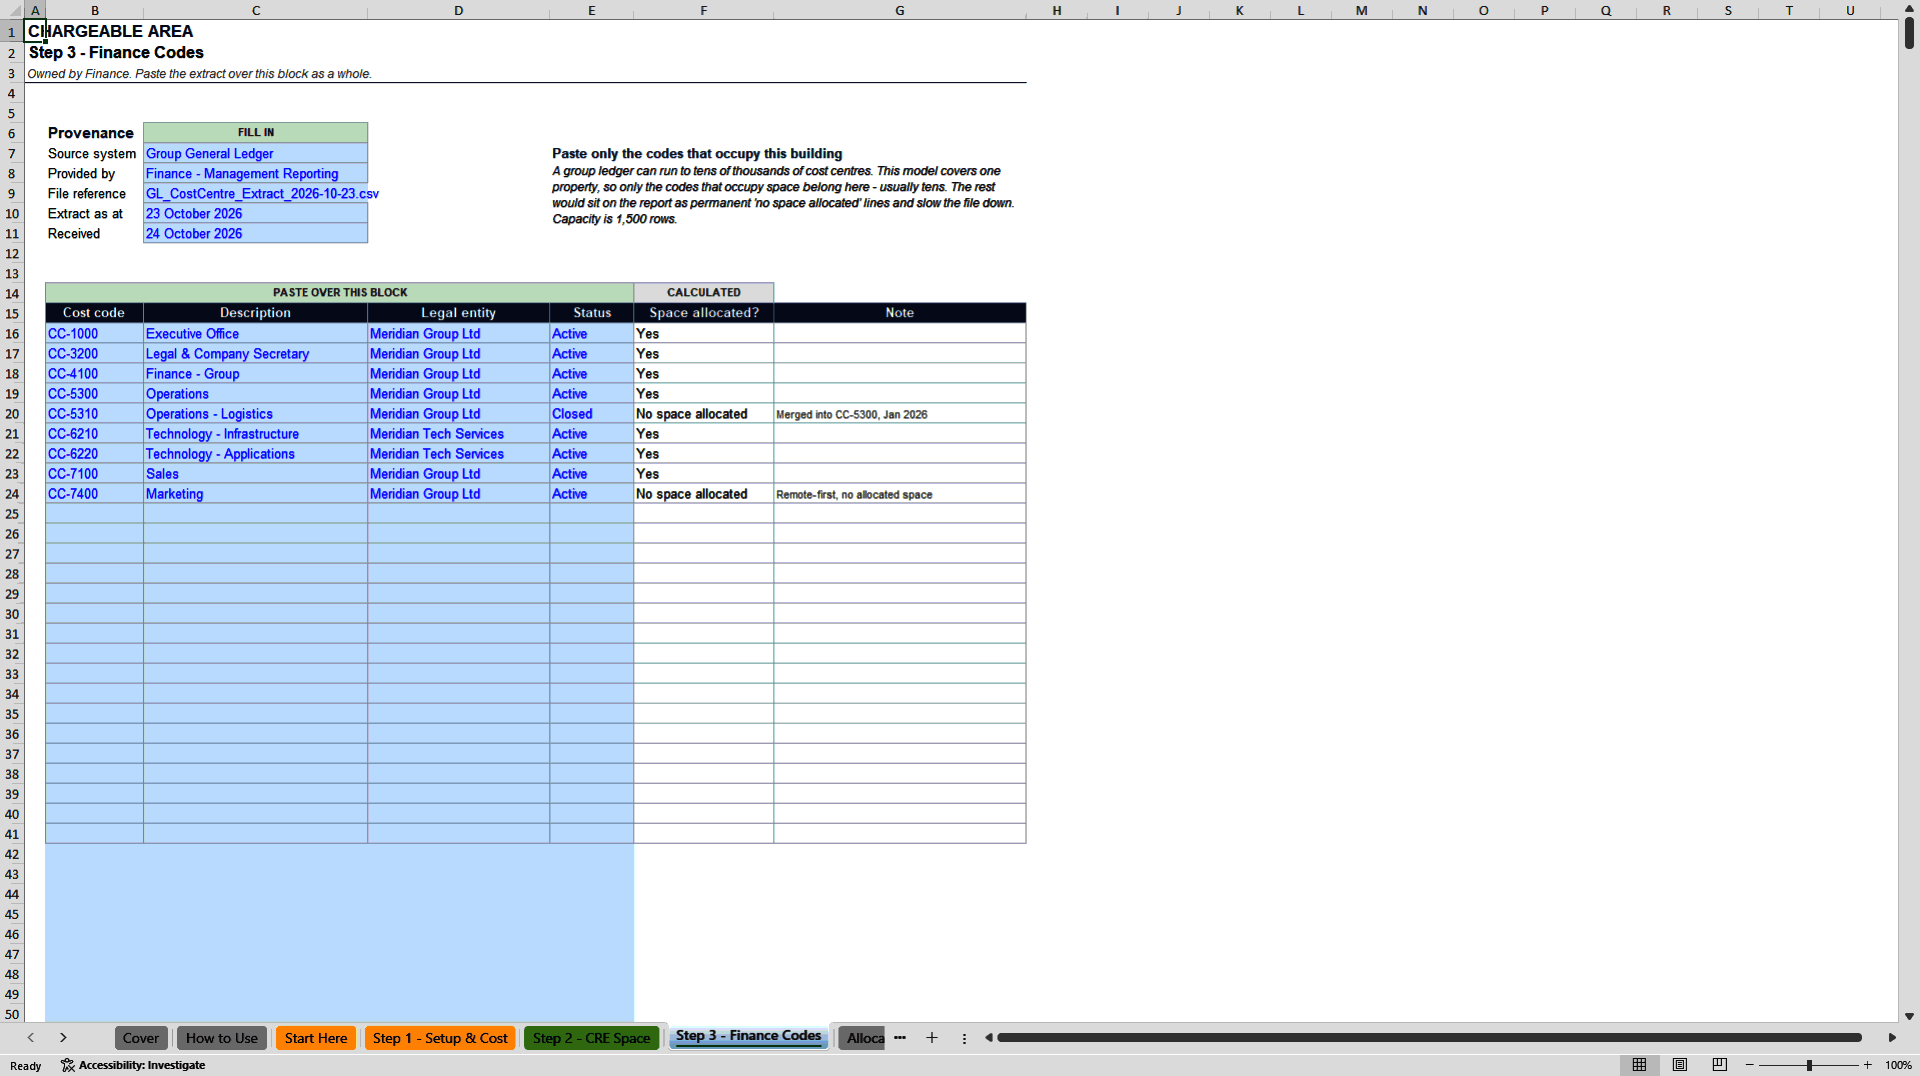
Three input steps, colour-coded by who owns them:
• Step 1, Setup and cost. Region, unit, currency, policy, the cost lines with budget, and your own lists.
• Step 2, CRE space. Every space, its class and its prorate level. Drop-downs on every list field.
• Step 3, Finance codes. The cost centre extract, pasted in as a dated block.
Seven reports out:
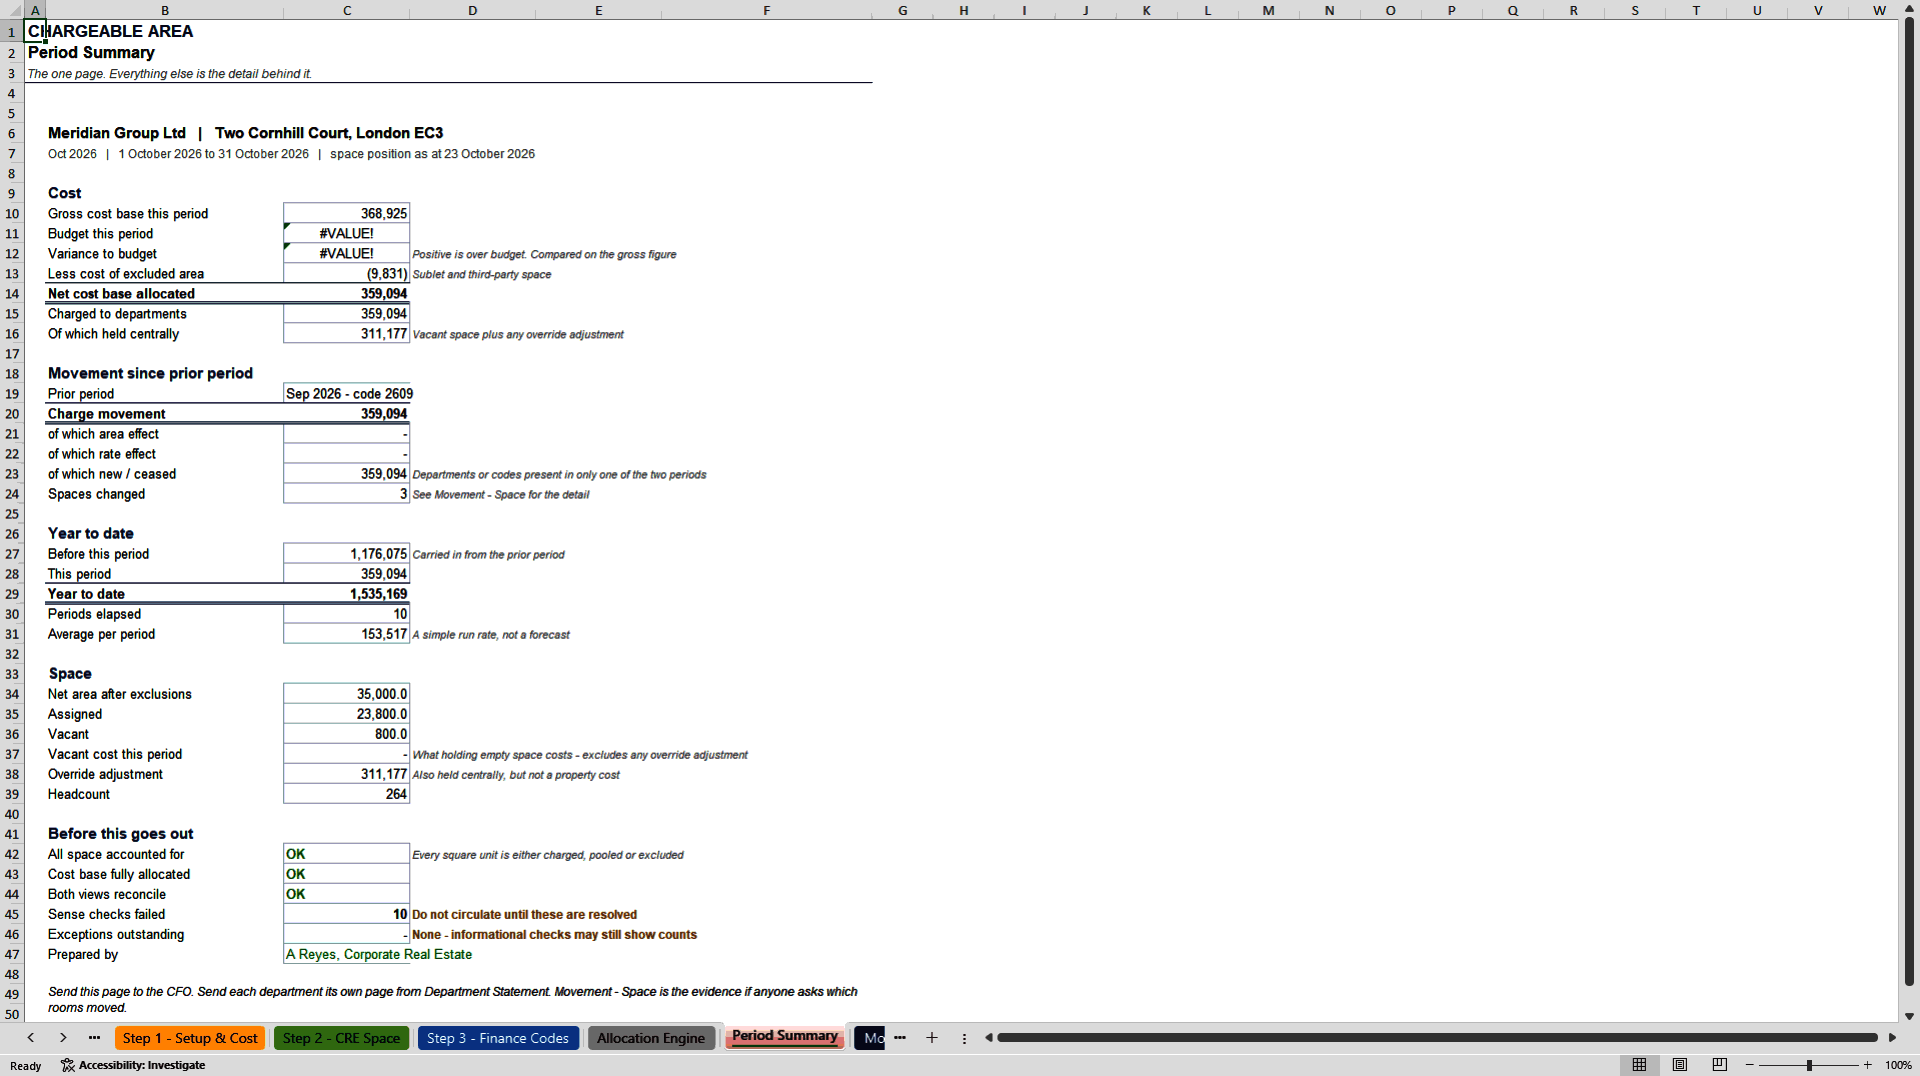
• Period Summary: one page for the CFO, covering cost against budget, movement, year to date, vacancy, and the checks
• Chargeback Summary: charge by department
• Cost Code Analysis: charge by cost code, for the ledger
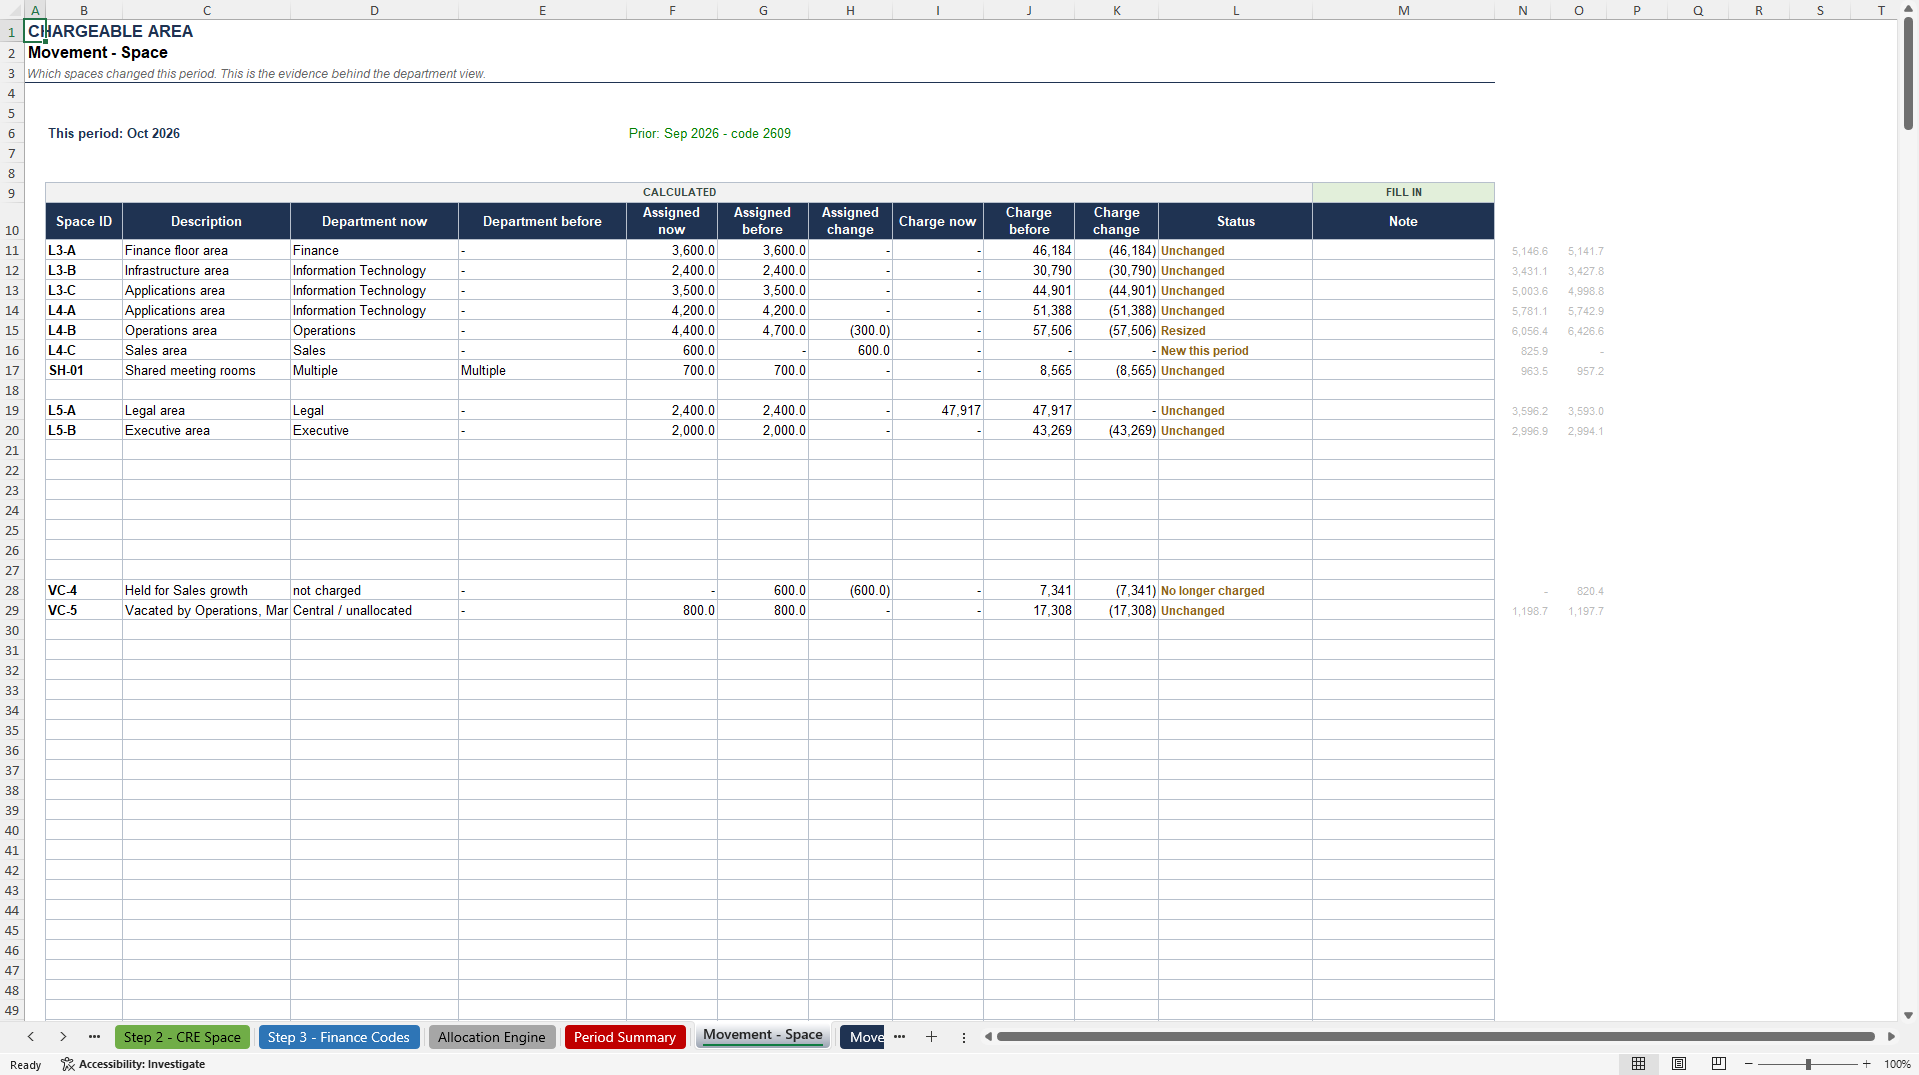
• Movement, Space: which rooms changed, and how – new, ceased, transferred, resized
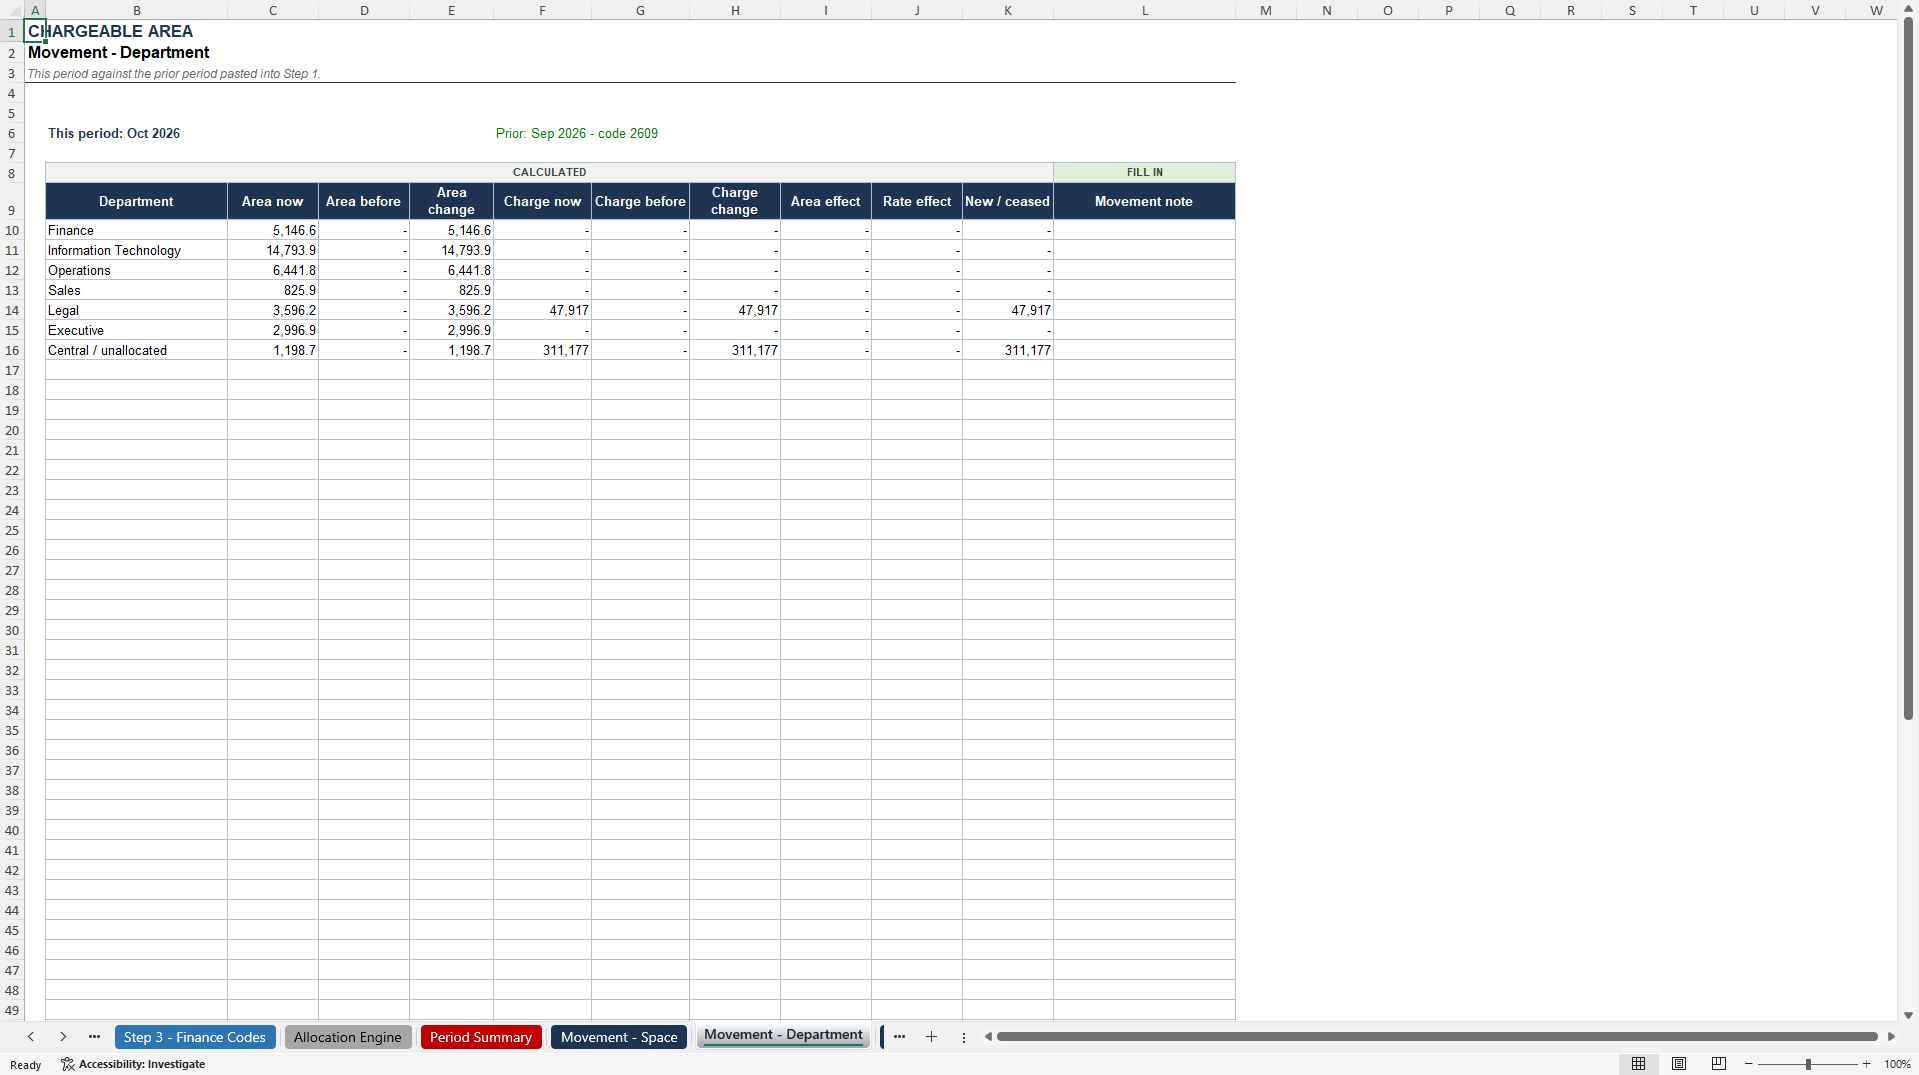
• Movement, Department and Movement, Cost Code: movement split into area effect, rate effect and new or ceased
• Department Statement: one page per department head, carrying no other department's figures
• Standards and Benchmarks: density against your own standard and published guidance
Report rows appear automatically as you enter data. Capacity is 400 spaces, 30 floors, 1,500 cost codes and 50 departments.
THE CHECKS
The workbook checks itself on two levels, and the difference matters.
Reconciliations prove the model is internally consistent: chargeable area against net area, computed charge against the cost base, department view against cost code view.
But a reconciliation cannot catch a bad input. The cost base is always spread across whatever area exists, so an error in what you typed moves both sides together and cancels out. A reversed period range, a negative area, a share that totals 90%, a duplicated cost line – every one of these produces a materially wrong report while all three reconciliations report OK.
Sense checks exist for that. Eleven of them look at the inputs rather than the arithmetic: reversed period ranges, overlapping cost lines, shares that do not total 100%, negative values, duplicate space IDs, departments not on the list, negative departmental charges, outsized overrides, and the single most common mistake in the whole workflow – pasting the carry-forward block with a plain paste instead of Paste Special > Values.
Ten further exception checks cover the data Finance gave you: cost codes not in the register, closed codes still carrying space, vacancies with no stated reason, pools with no prorate level, and a date check between the space survey and the cost centre extract.
Manual overrides are allowed, counted, and reconciled – the difference is posted centrally so the cost base always balances.
REGIONS
Presets for the United Kingdom, United States, Hong Kong and Singapore, plus a custom mode. Unit, currency and area basis are set separately, so the model works in any market.
The area basis setting is the most important field in the workbook. UK net internal area excludes common parts; US rentable and Hong Kong gross areas already include a share of it. Entering an area that already carries common space and then grossing it up again charges the common area twice. The model makes you declare the basis before anything else.
Benchmarks are regional and sourced. In custom mode the model shows none at all, rather than showing a figure from the wrong market.
For US buyers: the model ships with a BOMA 2024 preset and handles the usable-to-rentable distinction directly. US rentable area already carries a share of common space through the load factor, so the model adjusts rather than grossing up twice. Cost lines are labelled to US convention – property tax, CAM and operating expenses – and the allocation method itself, proportional common-area proration to the occupying departments, is the same one the enterprise IWMS platforms apply.
WHAT THIS MODEL DOES NOT DO
• It does not read floor plans or produce drawings
• It takes no sensor, badge or WiFi utilisation data
• It does not manage moves, and has no multi-user editing or permissions
• It does not post journals: it gives you the figures to post, not the posting
• Desk-level allocation of open-plan areas and multi-building estate allocation are not in this version. The fields are reserved so either can be added later without rebuilding the engine.
This is not a replacement for an enterprise system. Its job is to take the numbers you already have and produce an allocation that Finance will accept, that can be audited, and that can be run again next period in about twenty minutes.
WHO IT IS FOR
Corporate real estate, facilities and finance teams at occupiers from around 40 staff upward – anywhere the split has to be explained rather than assumed. Particularly useful where several legal entities share a building, where departments carry P&L responsibility, or where a lease event has made someone ask what each team actually costs to house.
ABOUT THE AUTHOR
15 years in corporate real estate and facilities management, covering branch networks across Asia and Europe from bases in Hong Kong and London.
Day-to-day responsibility for space allocation, occupancy cost and the internal recharge that follows from them – work that runs across several measurement regimes at once: net internal area in the UK and Europe, gross and lettable area in Hong Kong, net lettable in Singapore. Reconciling those into one defensible set of numbers is most of the job, and it is why the models here are built to switch measurement basis rather than assume one.
The method is built on published measurement standards – IPMS, BOMA and BCO – not on any employer's data or systems.
Got a question about the product? Email us at support@flevy.com or ask the author directly by using the "Ask the Author a Question" form. If you cannot view the preview above this document description, go here to view the large preview instead.
Source: Best Practices in Facility Management Excel: Office Occupancy Cost Allocation Model Excel (XLSX) Spreadsheet, Chargeable Area
ABOUT THE AUTHOR

Corporate real estate professional with 15 years of experience in space planning, facilities management, and occupancy cost allocation. Expertise spans across managing corporate branch networks in Asia and Europe, with a strong focus on bridging the gap between corporate real estate operations and finance reporting.
Specializes in building robust, audit-ready financial models, chargeback
... [read more]
Ask the Author a Question
You must be logged in to contact the author.




























