

Manufacturing Startup/Existing Business Financial Projection 3 Statement Model – Excel XLSX
Excel (XLSX) + Excel (XLSX)
VIDEO DEMO
BENEFITS OF THIS DOWNLOADABLE EXCEL DOCUMENT
- Prepartion of a 5 year 3 statement (Income Statement, Balance Sheet, Cash Flow Statement) Financial Projection Model for a new or existing manufacturing business.
- Visualise projection outputs on dashboard
- Value MANUFACTURING business
MANUFACTURING EXCEL DESCRIPTION
Financial Projections for a Manufacturing Startup or Existing Business are essential. They forecast revenues, expenses, and cash flows, offering a roadmap for financial management and growth. For startups, it attracts investors and guides fundraising. Existing businesses use it for strategic planning, identifying cost-saving opportunities, and ensuring sustainable profitability. These projections are crucial for securing loans, demonstrating financial stability, and making informed decisions about scaling operations or launching new products. Overall, they provide clarity and insight into a manufacturing business's financial health, enabling effective resource allocation and long-term success.
PURPOSE OF TOOL
Highly versatile and user-friendly Excel model for the preparation a of 5-year rolling 3 statement (Income Statement, Balance Sheet and Cash flow Statement) financial projection with a monthly timeline for a startup or existing manufacturing business generating revenue through the production and sale of products.
The model allows the user to model the production and sale of up to 10 products (can be extended). Production costs include direct materials (up to 20 categories), direct labour costs (up to 10 categories) and direct expenses with functionality to model inventories for both direct materials and finished goods.
The model follows good practice financial modelling principles and includes instructions, line item explanations, checks and input validations and incorporates a discounted cash flow valuation calculation using the projected cash flows.
KEY OUTPUTS
The key outputs include:
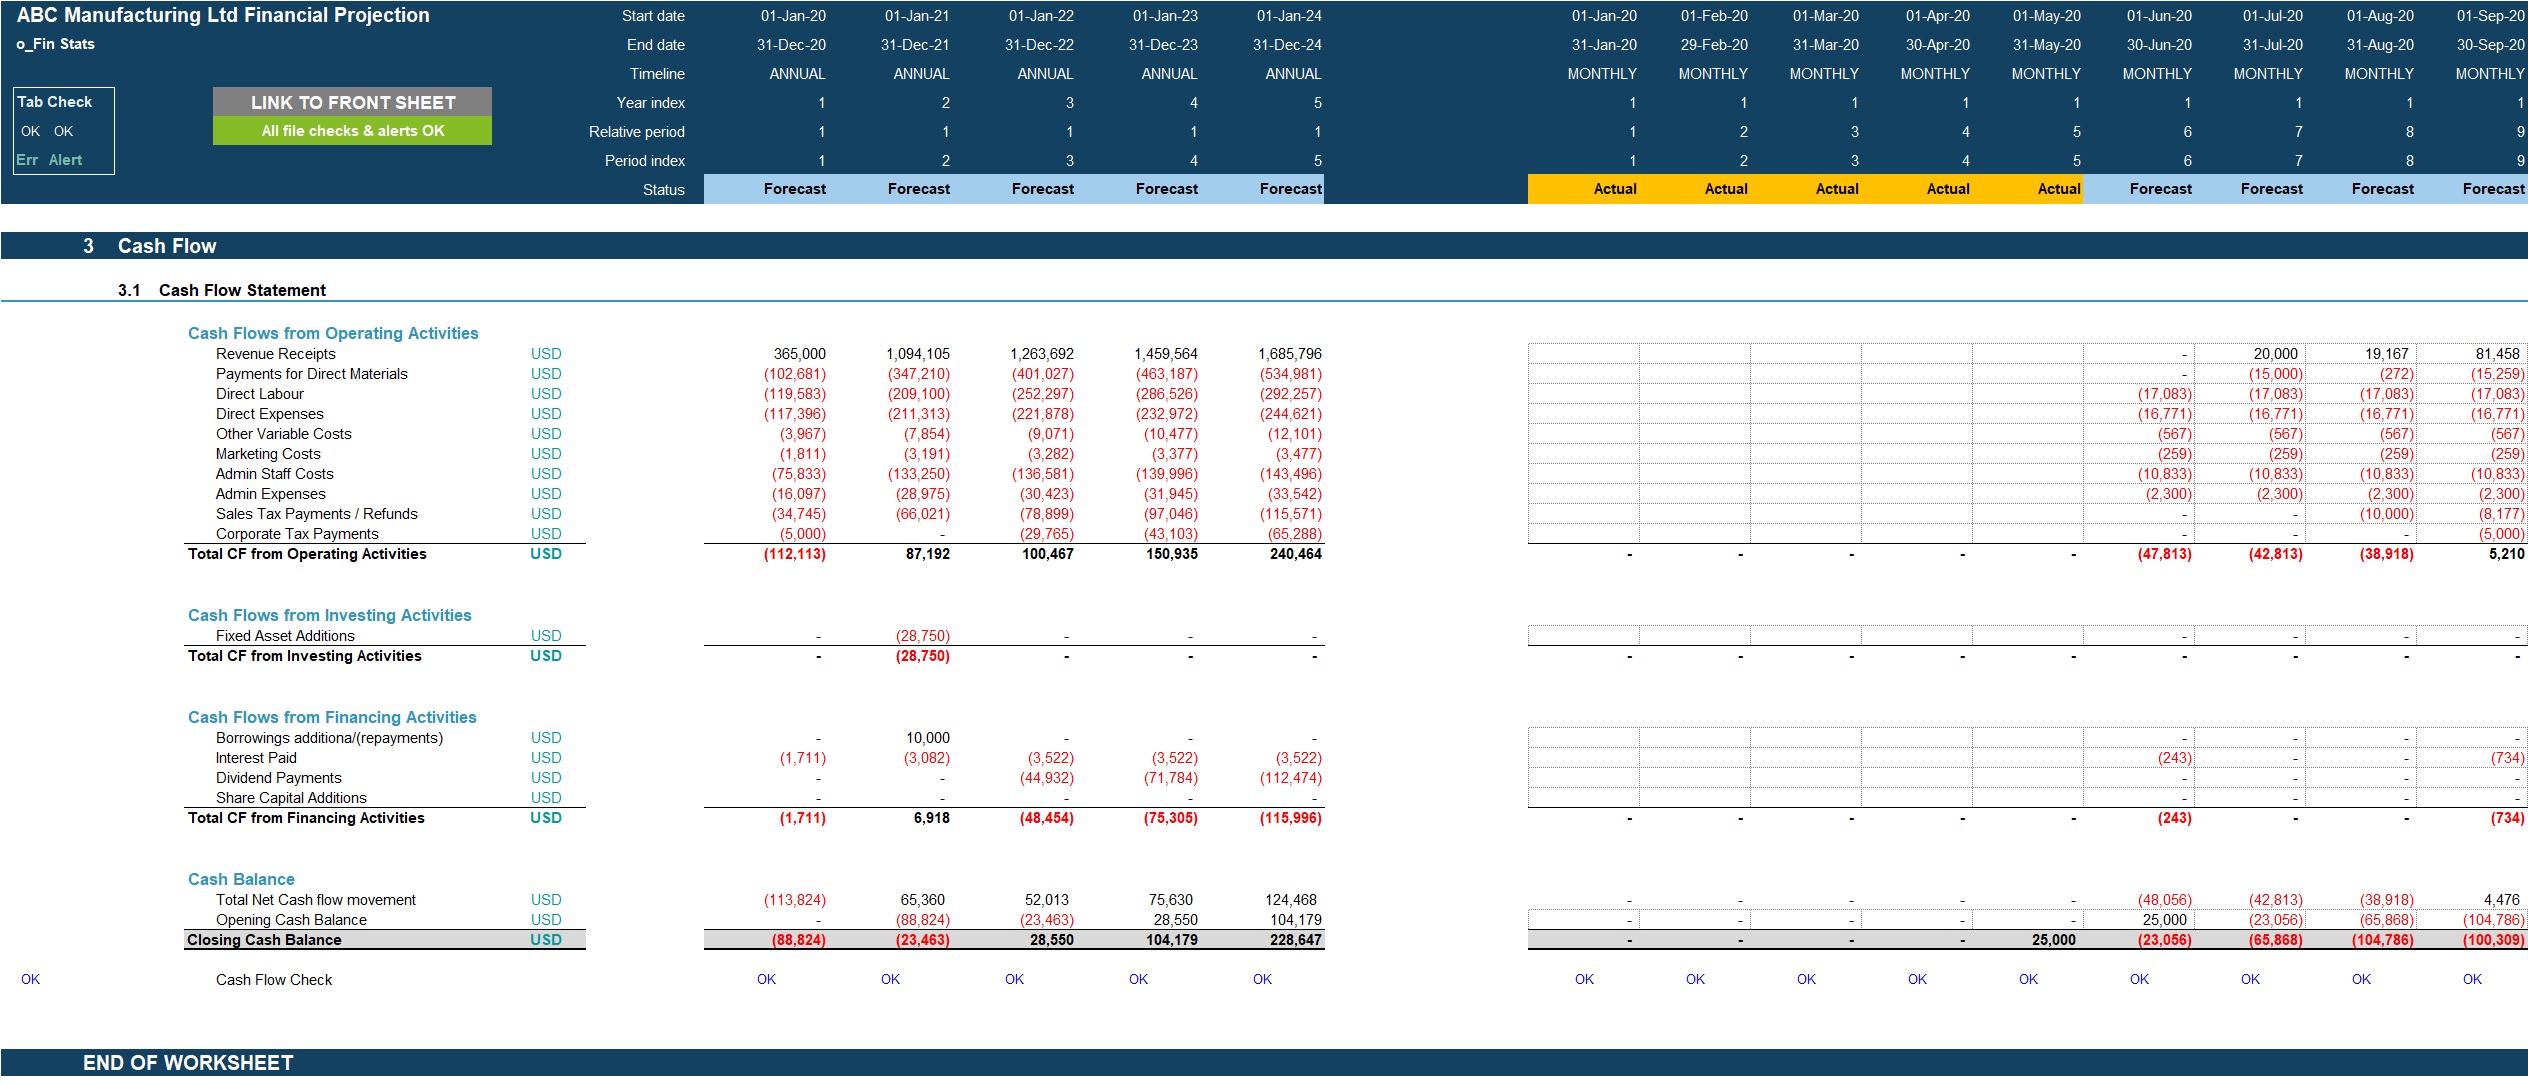
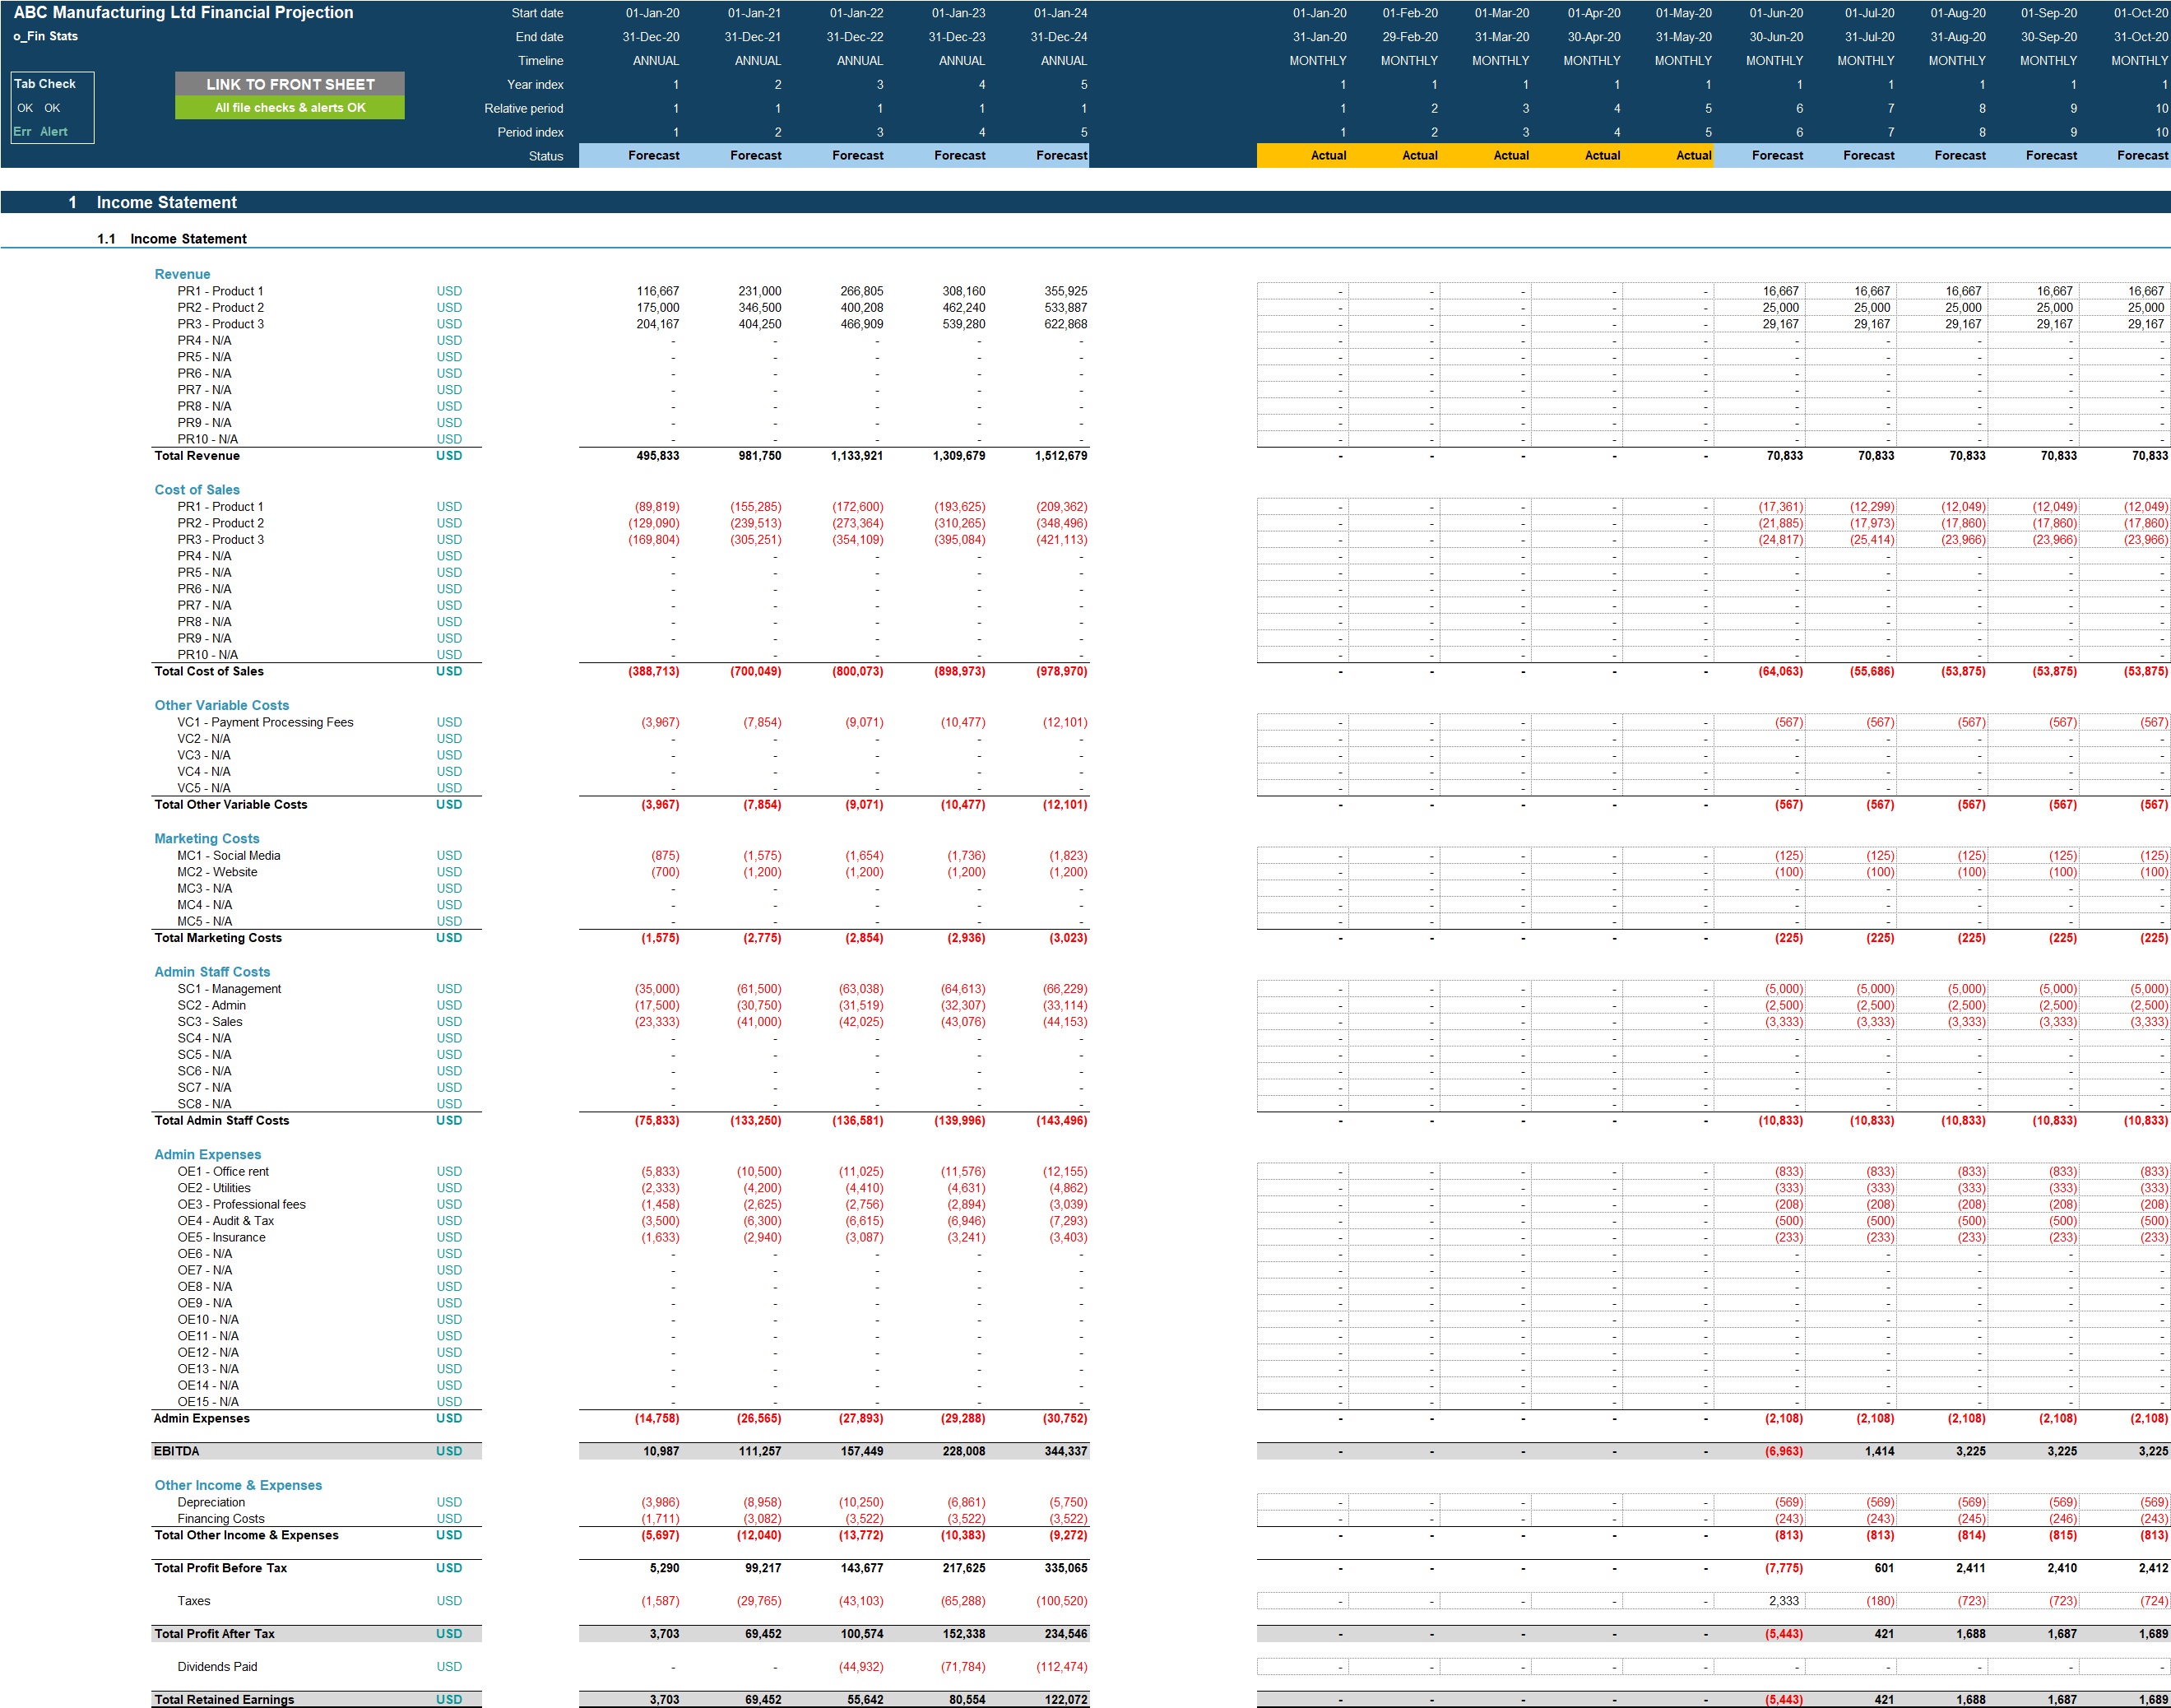
• Projected full financial statements (Income Statement, Balance Sheet and Cash flow Statement) presented on a monthly basis across up to 5 years and summarised on an annual basis.
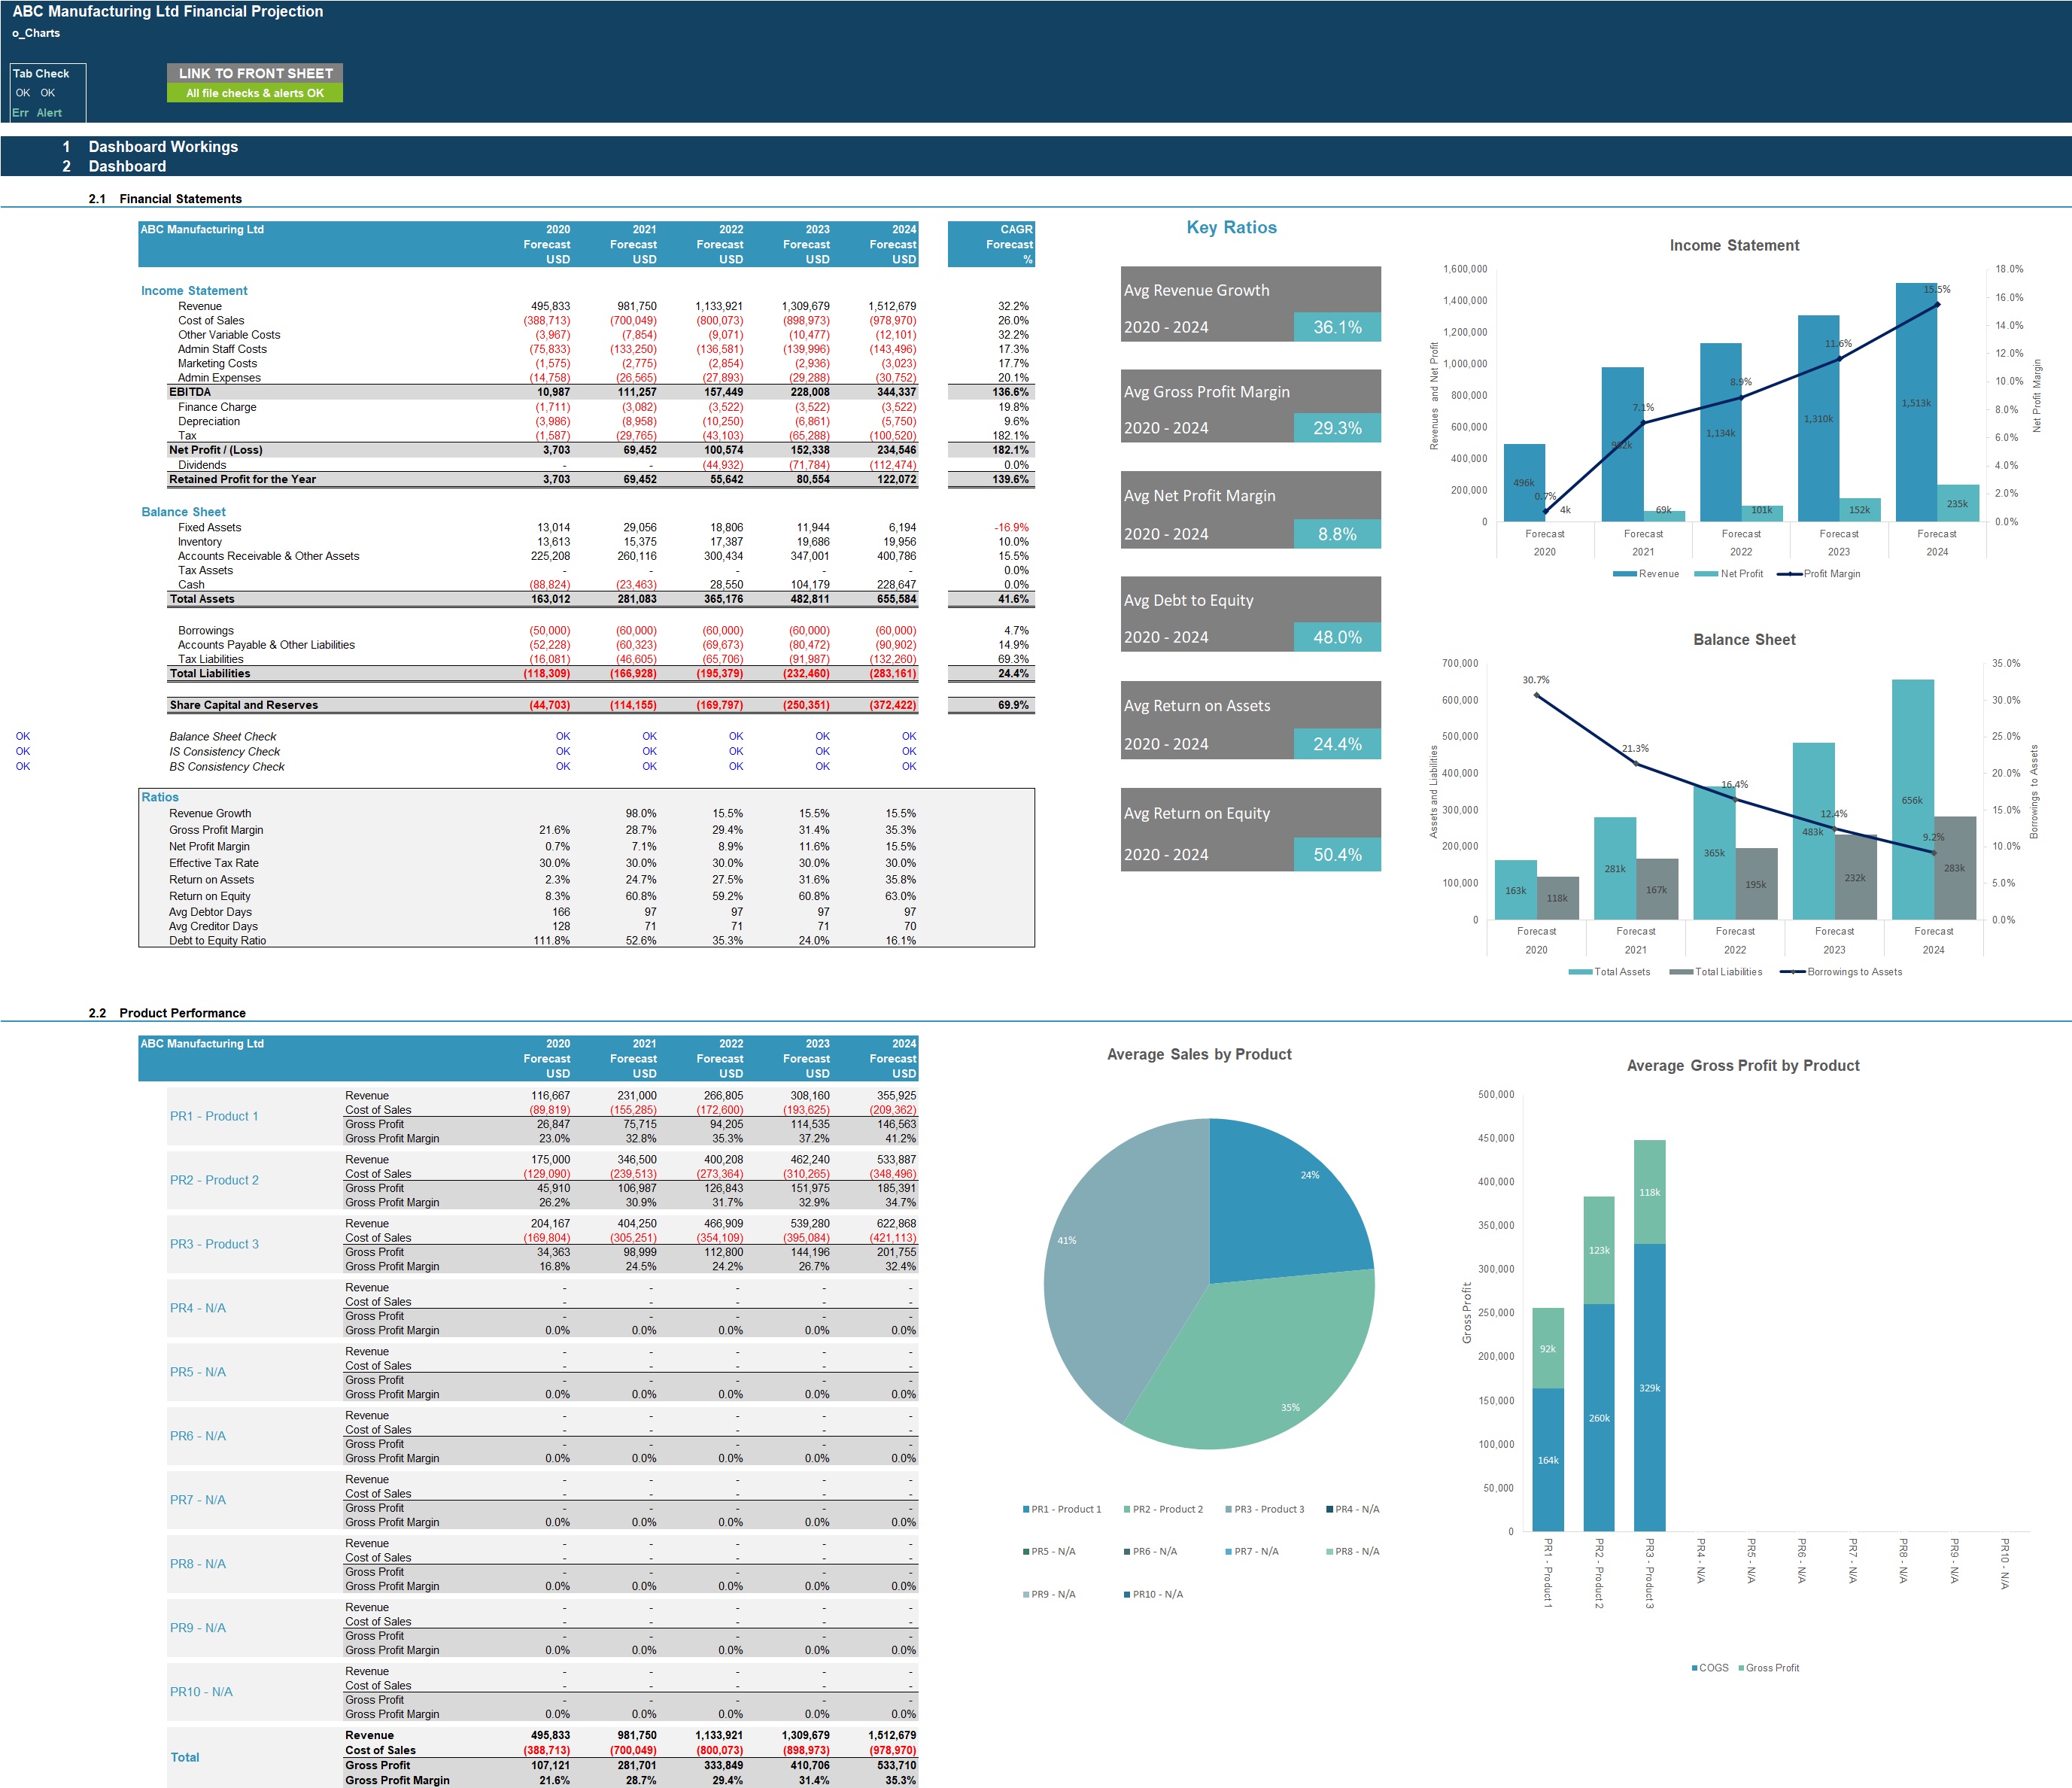
• Dashboard with:
Summarised projected Income Statement and Balance Sheet
Compounded Annual Growth rate (CAGR) for each summarised income statement and Balance Sheet line item
List of key ratios including Average revenue growth, Average profit margins, Average return on assets and equity and Average Debt to Equity ratio.
Bar charts summarising income statement and Balance Sheet projections
Gross Profit margin by product in table and bar-chart format
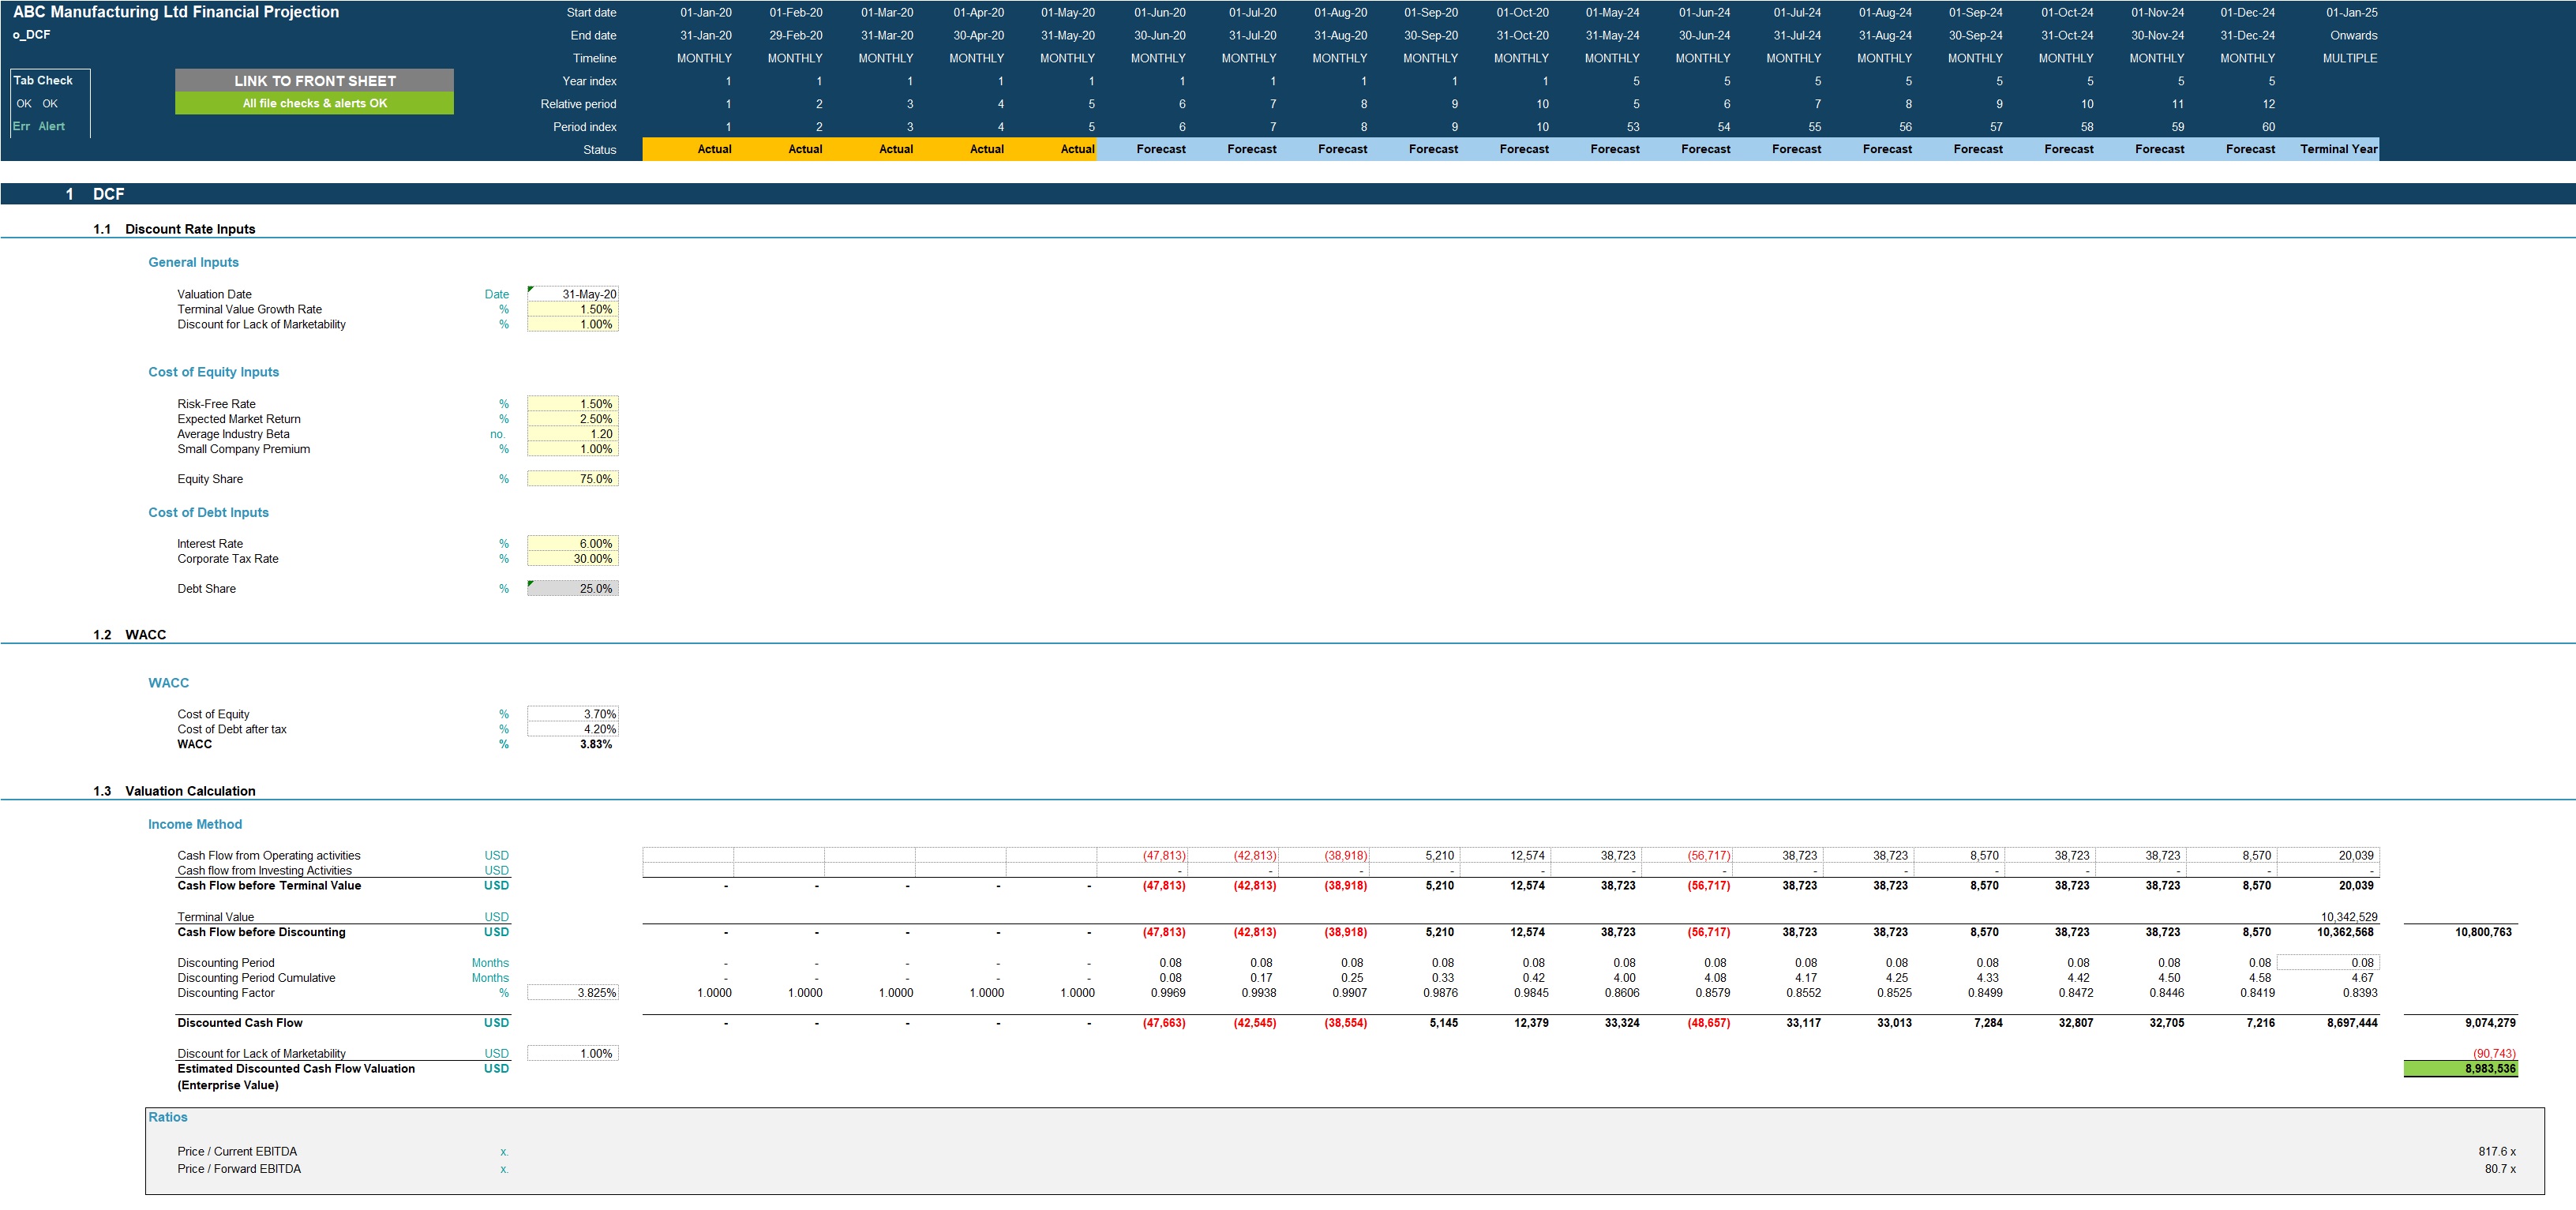
• Discounted cash flow valuation using the projected cash flow output.
KEY INPUTS
Inputs are split into Income Statement and Balance Sheet Inputs. Most inputs include user-friendly line item explanations and input validations to help users understand what the input is for and populate correctly.
Setup Inputs:
• Name of business;
• Currency;
• First projection year and month;
• Naming for products, direct materials, direct labour, direct expenses, other variable costs, admin staff costs, admin costs and fixed assets;
• Sales tax applicability for products, direct materials, variable costs, other expenses and fixed assets.
Actuals Inputs:
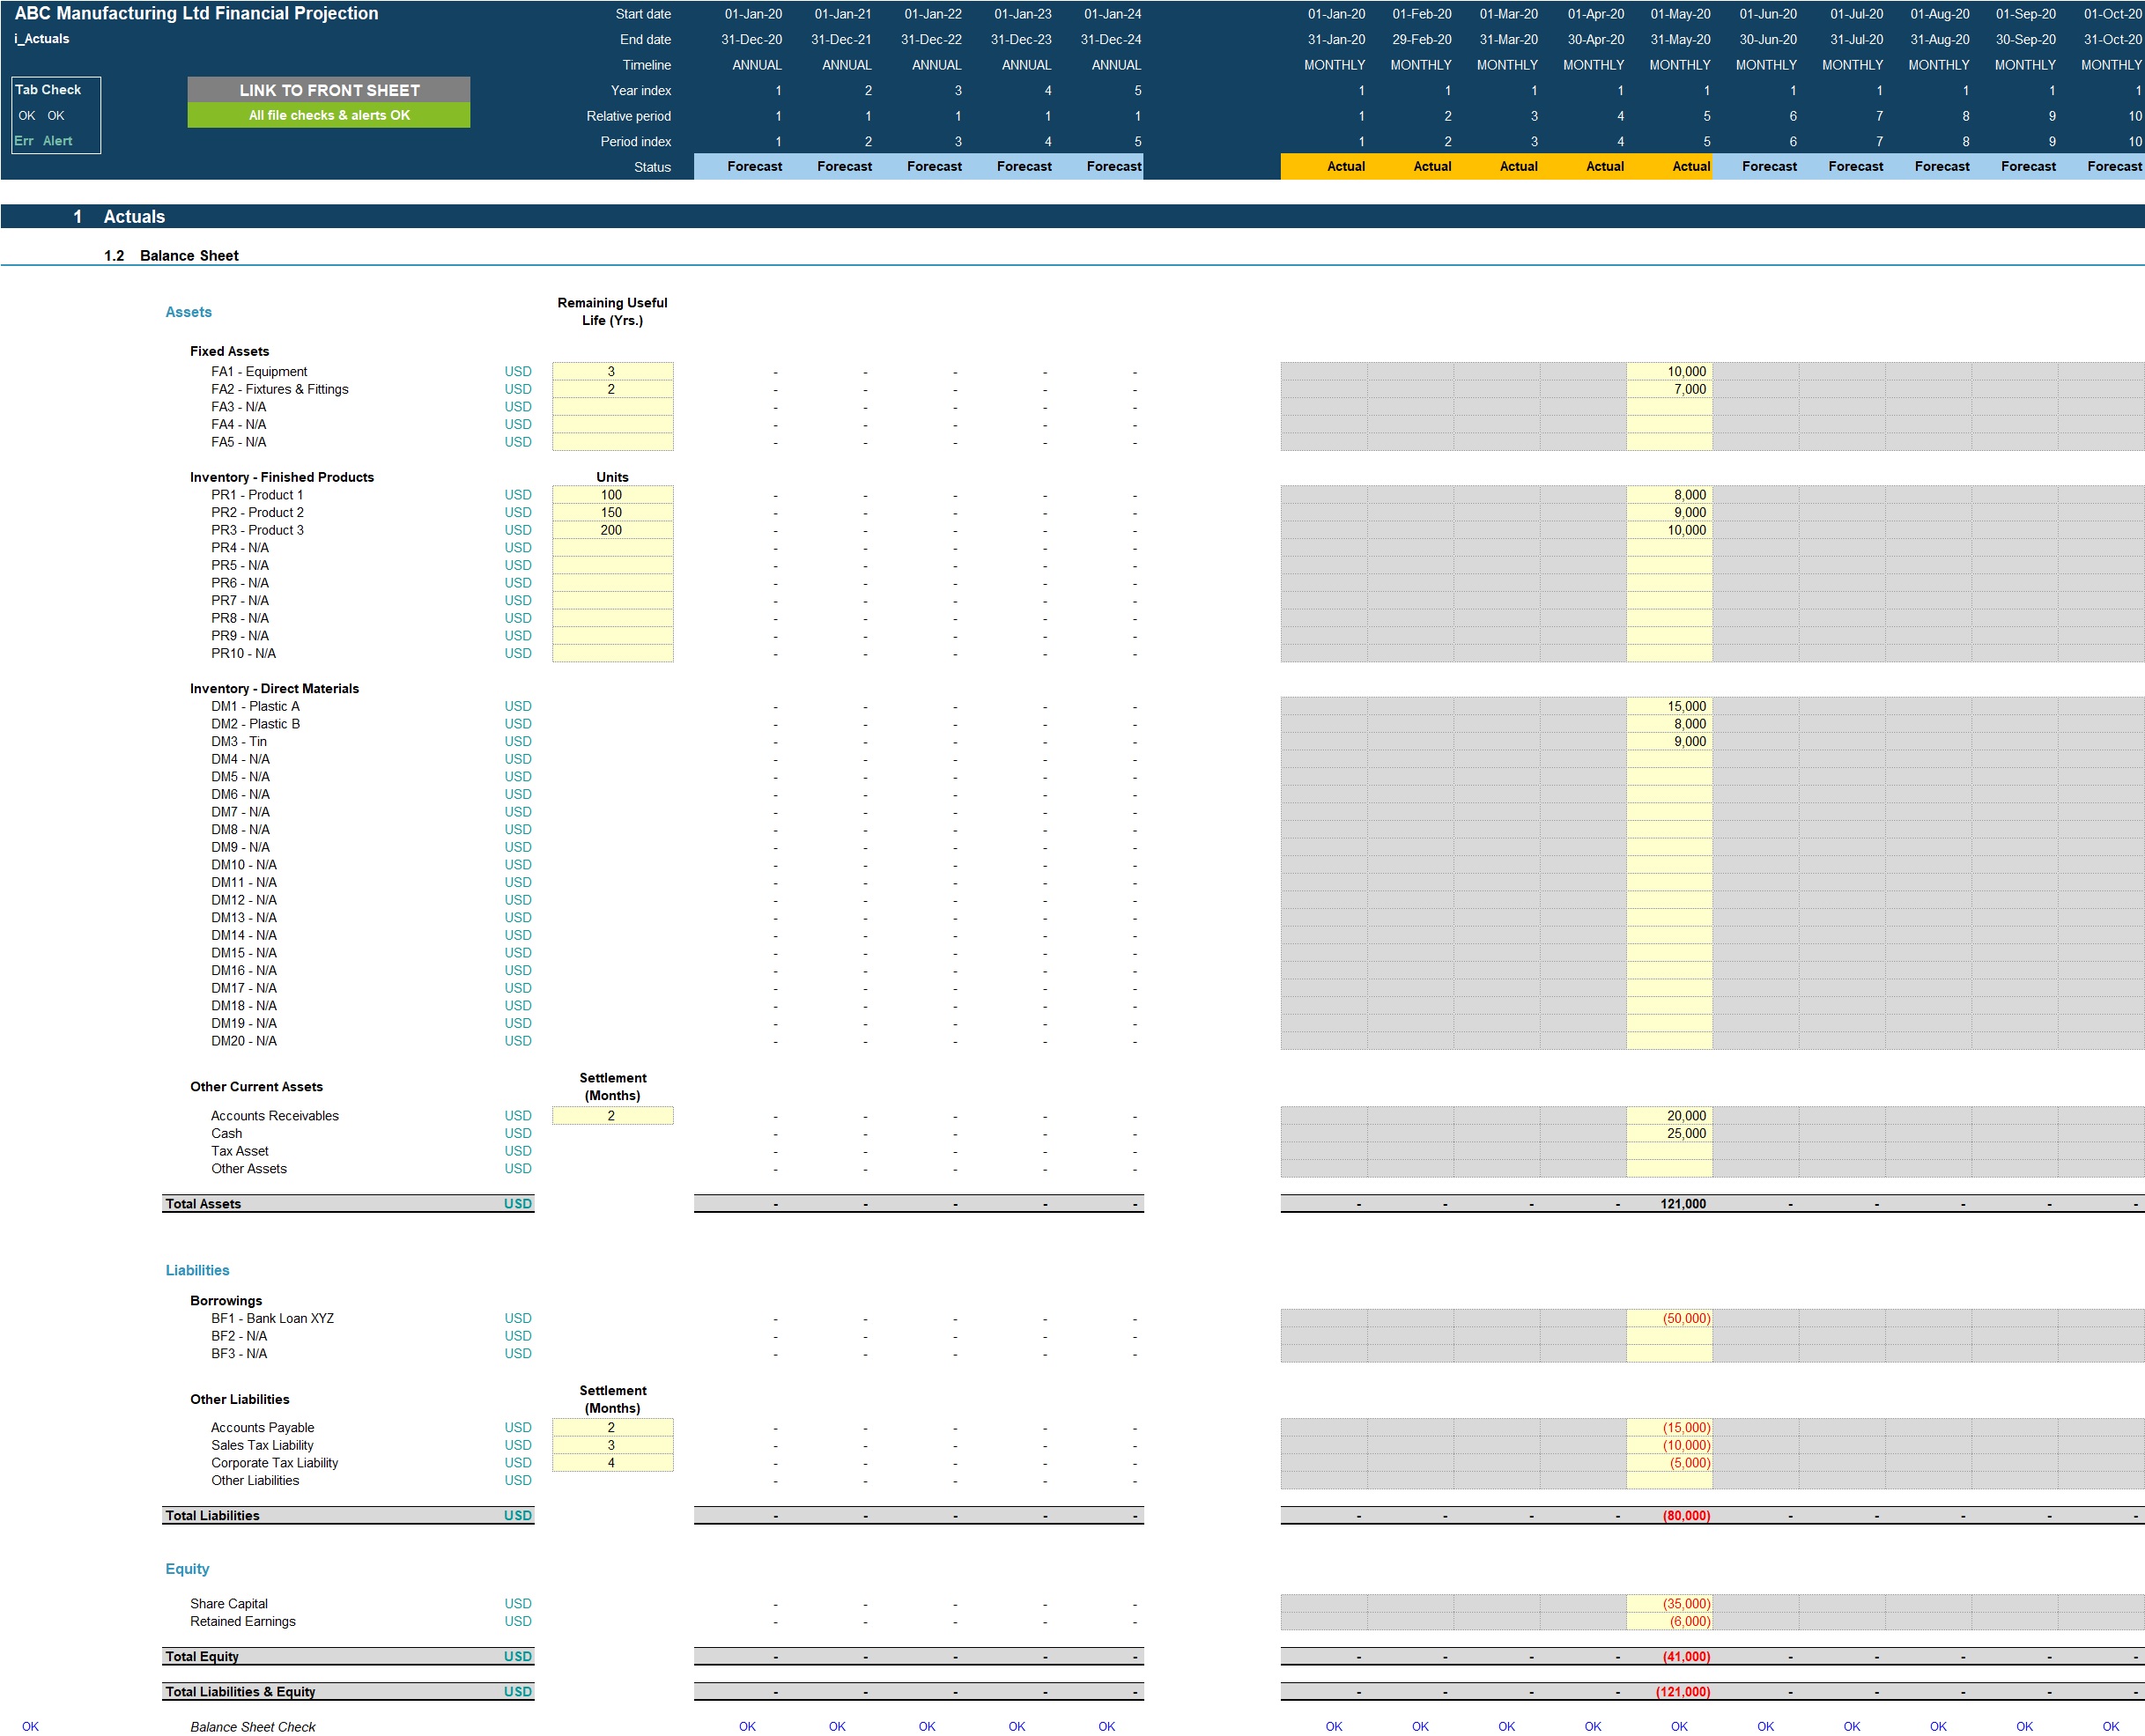
• Opening balance sheet (for existing businesses);
• Income Statement actuals (for trend analysis);
Projection Inputs:
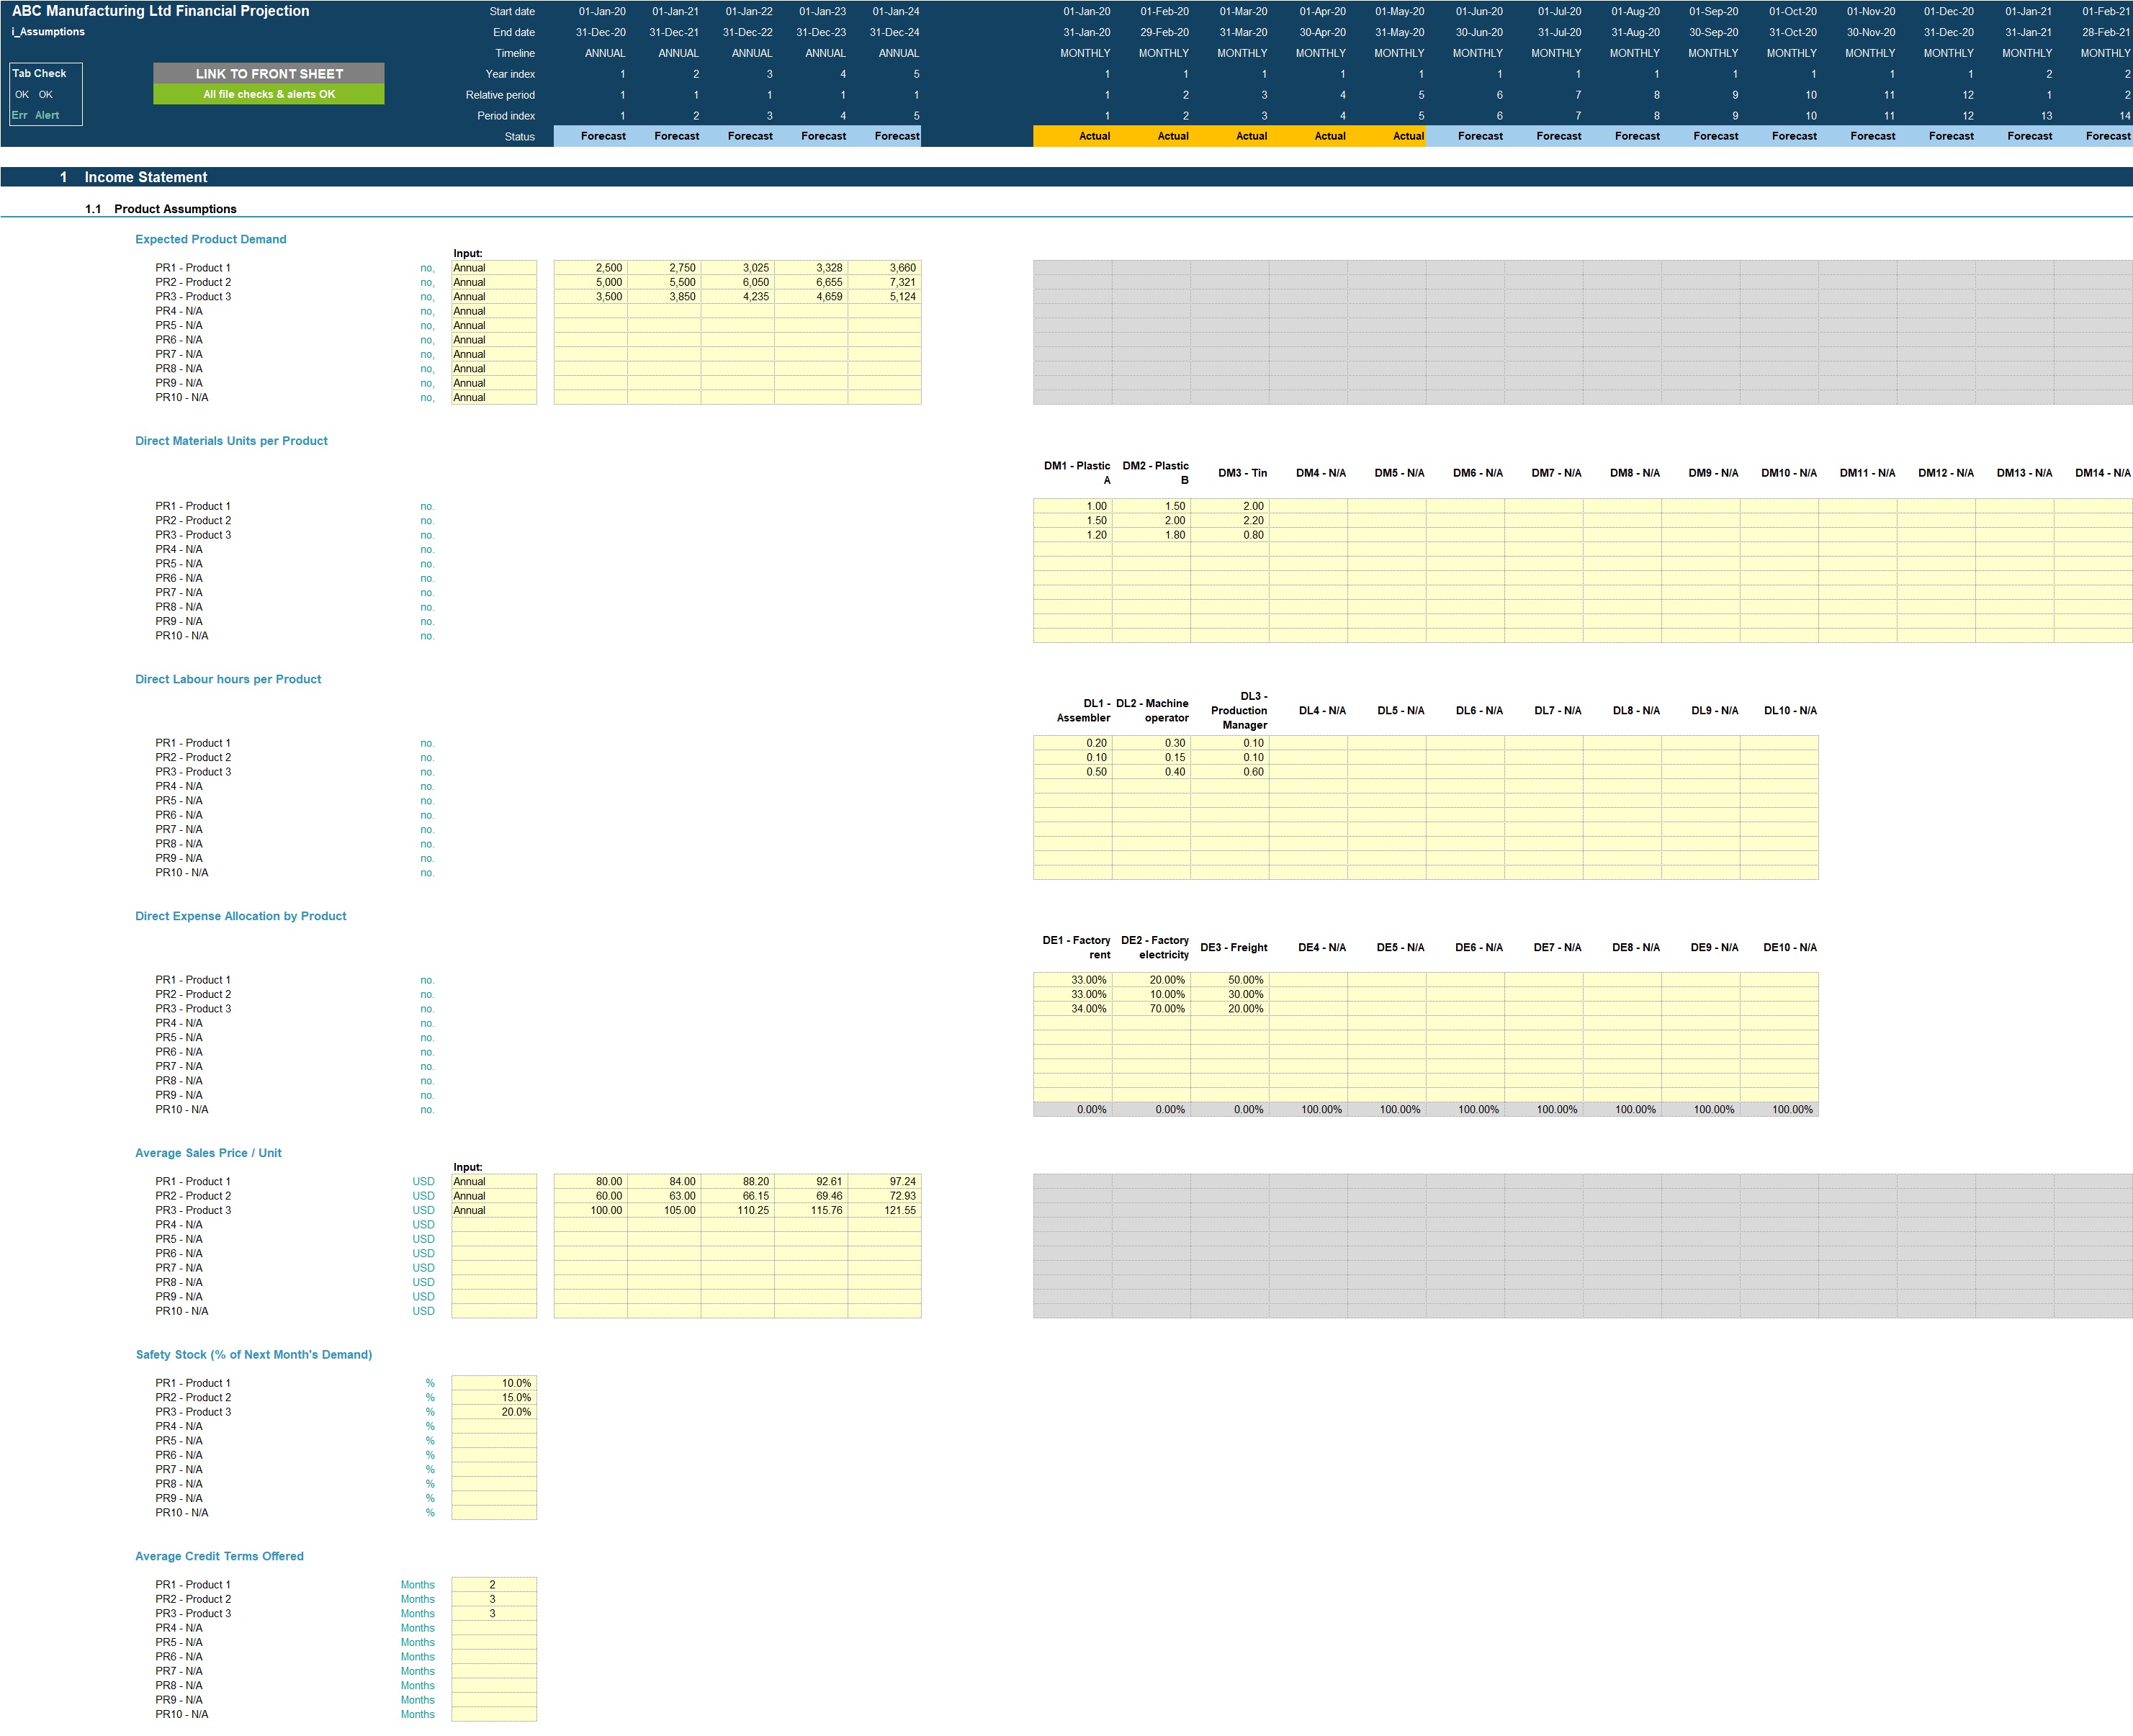
• Revenue inputs including sales volume, sales prices, average credit terms offered and safety stock percentage for finished products inventory calculation;
• Direct labour inputs include labour hours per product, current number of FTEs, annual cost per FTE, working days per year and production hours per day.
• Direct material inputs include direct material units per product, cost per unit, safety stock percentage for direct material inventory calculation and average credit terms received;
• Direct expense inputs include amount per year or month and allocation percentages across products;
• Variable cost inputs including percentage of revenue applicable to and cost percentage of revenue;
• Other costs inputs including admin staff costs, marketing costs and admin costs;
• Sales and corporate tax inputs including rate and payment periods;
• Dividend inputs including amount (percentage of retained earnings) and frequency;
• Fixed Assets including addition amounts and useful life;
• Borrowings including addition amounts and interest rate;
• Share Capital additions;
• Discount rate inputs (for valuation calculation).
MODEL STRUCTURE
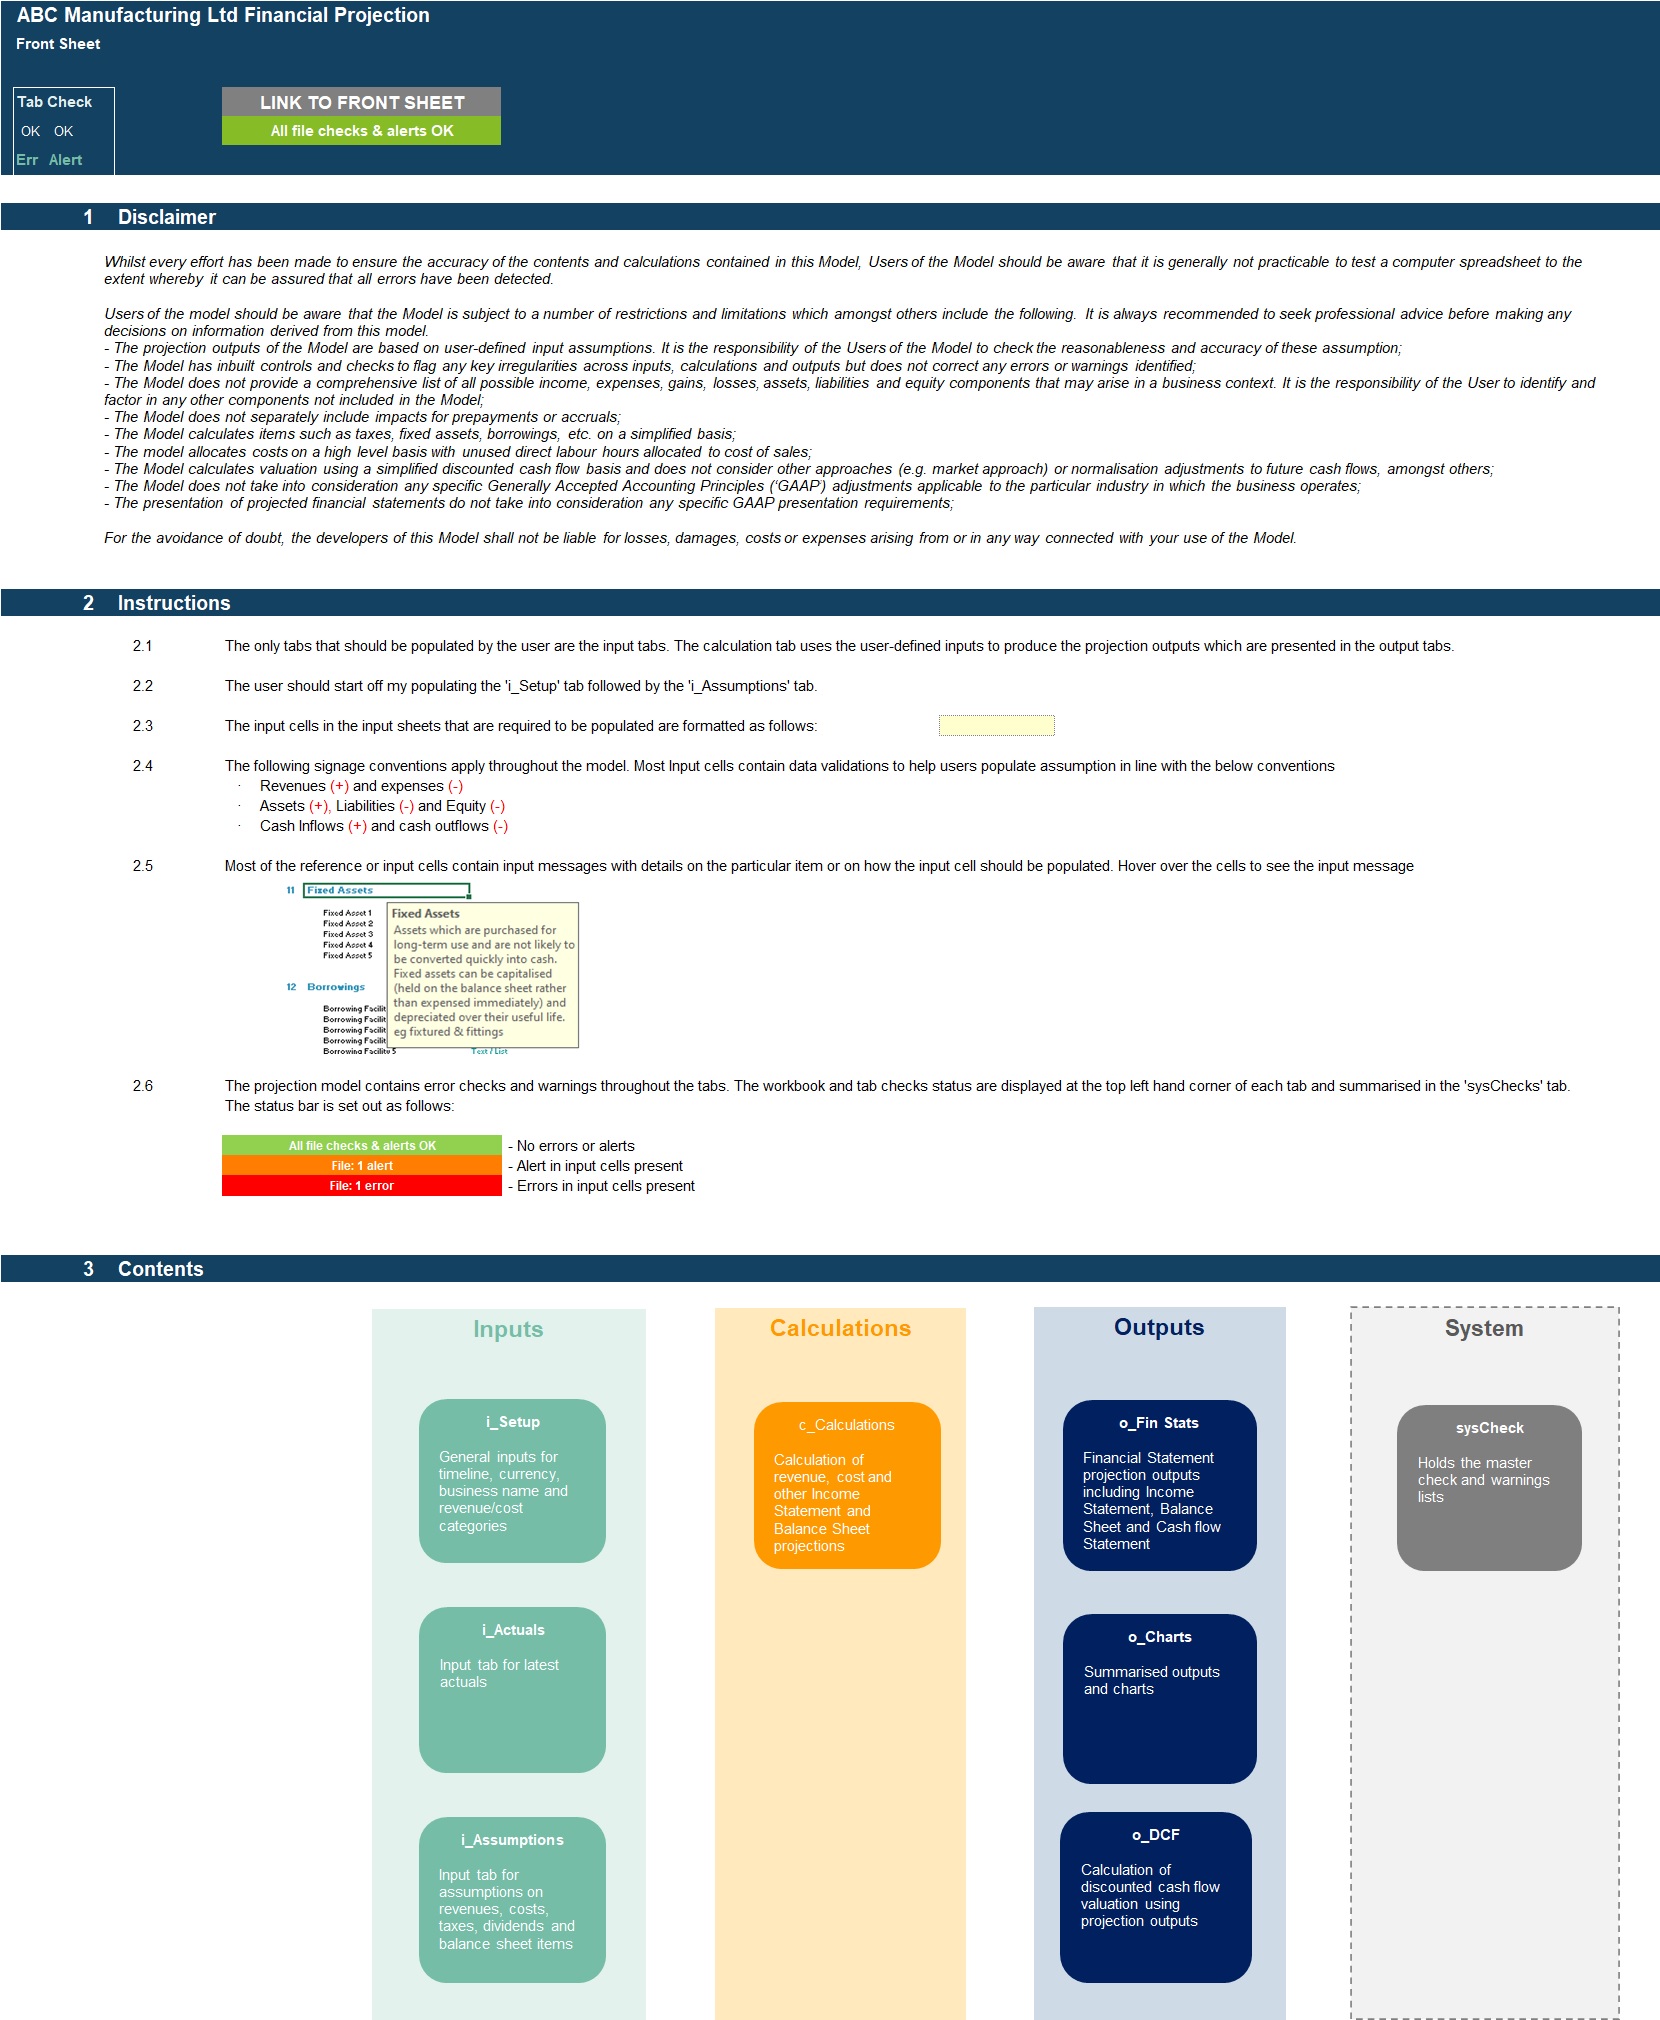
The model comprises of 9 tabs split into input ('i_'), calculation ('c_'), output ('o_') and system tabs. The tabs to be populated by the user are the input tabs ('i_Setup', ‘i_Actuals' and 'i_Assumptions'). The calculation tab uses the user-defined inputs to calculate and produce the projection outputs which are presented in 'o_Fin Stats', ‘o_Charts' and ‘o_DCF'.
System tabs include:
• A 'Front Sheet' containing a disclaimer, instructions and contents;
• A checks dashboard containing a summary of checks by tab.
KEY FEATURES
Other key features of this model include the following:
• The model follows good practice financial modelling guidelines and includes instructions, line item explanations, checks and input validations;
• The model contains a flexible timeline that allows for a mix of actual and forecast period across a 5-year period. This allows projections to be easily rolled forward;
• Timeline is split on a monthly basis and summarised on an annual basis;
• The model allows the user to model up to 10 separate products with their own unique combinations of direct materials, direct labour usage and direct expense allocation;
• The model is not password protected and can be modified as required following download;
• The model is reviewed using specialised model audit software to help reduce risk of formula inconsistency;
• The model allows for the following number of underlying categories for each line item (these can be easily expanded if required):
Products – 10 categories;
Direct materials – 20 categories;
Direct labour costs – 10 categories;
Direct expenses – 10 categories;
Other variable costs – 5 categories
Admin Staff costs – 8 categories;
Marketing costs – 5 categories;
Admin expenses – 15 categories;
Fixed assets – 5 categories;
Borrowings – 3 facilities
• Apart from projecting revenue and costs the tool includes the possibility to model receivables and payables, fixed assets, borrowings, dividends and corporate tax;
• Business Name, currency, starting projection period are fully customisable;
• Revenue, Cost and Fixed Asset descriptions are fully customisable;
• The model included an integrated discounted cash flow valuation using the projected cash flow outputs;
• The model includes instructions, line item explanations, checks and input validations to help ensure input fields are populated accurately;
• The model includes a checks dashboard which summarises all the checks included in the various tabs making it easier to identify any errors.
Got a question about the product? Email us at support@flevy.com or ask the author directly by using the "Ask the Author a Question" form. If you cannot view the preview above this document description, go here to view the large preview instead.
TOPIC FAQ
What are the core components of a three-statement financial projection for a manufacturing business?
Core components are the Income Statement, Balance Sheet, and Cash Flow Statement linked across the projection timeline. Projections require revenue drivers, cost of goods sold, inventory and working capital schedules, fixed assets and borrowings; outputs are typically presented monthly with annual summaries across a five-year rolling period, up to 5 years.How do you forecast product-level gross profit margins in manufacturing projections?
Forecast product margins by projecting sales volumes and prices, allocating direct materials, direct labour and direct expenses per product, and calculating COGS and gross profit per product. Visualising results helps; for example, Flevy’s Manufacturing Startup/Existing Business Financial Projection 3 Statement Model provides gross profit margin by product in table and bar-chart format.How should inventory and safety stock be modelled for manufacturing projections?
Model inventories by calculating required safety stock percentages for direct materials and finished goods, converting them to unit and cost balances, and reflecting changes in working capital through receivables and payables schedules. The approach requires explicit safety stock percentage inputs for both materials and finished goods.What should I consider when choosing an Excel financial model for a manufacturing startup on a tight timeline?
Prioritise a model with a flexible monthly timeline that mixes actuals and forecasts, built-in checks and input validations, clear instructions, and the necessary category capacity (products, materials, labour). Flevy’s Manufacturing Startup/Existing Business Financial Projection 3 Statement Model highlights these features and supports modelling up to 10 products.How much time and expertise do I need to use a downloadable three-statement model for manufacturing?
Basic accounting and Excel finance skills are typically required to populate assumptions accurately. Models that include line-item explanations, input validations, and a checks dashboard reduce setup time and error risk; look for documentation and validations that guide inputs and help ensure correct output generation.I have historical financials for an existing manufacturer—how do I integrate actuals into projections?
Use the model’s actuals inputs to load an opening balance sheet and income statement historicals, then define the point where forecasts begin. A model that allows a mix of actual and forecast periods will roll forward projections and summarise monthly data into annual outputs, across up to 5 years.Which valuation method is appropriate for a manufacturing startup and how is it implemented in a projections model?
Discounted cash flow (DCF) valuation is commonly used, projecting free cash flows from the forecasted 3 statements and discounting them by an appropriate rate. A projections model that integrates a DCF calculation will use projected cash flows to produce a valuation based on those outputs.What inputs are commonly required to project direct labour and material costs in a manufacturing model?
Direct labour inputs typically include labour hours per product, current FTEs, annual cost per FTE, working days per year, and production hours per day. Direct material inputs include units per product, cost per unit, safety stock percentage, and credit terms received, with capacity for multiple categories such as 20 material categories and 10 labour categories.Source: Best Practices in Manufacturing, Integrated Financial Model Excel: Manufacturing Startup/Existing Business Financial Projection 3 Statement Model Excel (XLSX) Spreadsheet, Projectify
ABOUT THE AUTHOR
We are financial modelling professionals, accountants and CFA charterholders with experience working within Deloitte supporting clients with their financial planning and decision support needs. Our aim is to provide robust and easy-to-use financial models that follow good practice financial modelling guidelines and assist individuals and businesses with key financial planning and analysis ... [read more]
Ask the Author a Question
You must be logged in to contact the author.
