
 Click main image to view in full screen. Unlock all 13 preview images:
Insurance MGA and Program Business Model – Excel XLSX
Excel (XLSX) + supplemental PDF


BENEFITS OF THIS DOWNLOADABLE EXCEL DOCUMENT
- Provides a bottom-up 60-month premium funnel that links submissions, quotes, binds and average premium directly to five-year GWP projections.
- Integrates reinsurance, commissions, fronting, reserving, captive participation and stakeholder returns into one reconciled program P&L.
- Supports scenario testing and management review through four dashboards, loss-ratio sensitivity analysis and a live Audit and QC framework.
INSURANCE EXCEL DESCRIPTION
🛡️ INSURANCE MGA AND PROGRAM BUSINESS MODEL – The Insurance MGA and Program Business Model is a premium, fully editable Excel suite created for MGA founders, program administrators, fronting carriers, reinsurers, captive-cell participants, insurance consultants, investors and finance teams that need a transparent view of specialty-program economics. It follows the business from submissions and underwriting conversion through gross written premium, reinsurance, commission allocation, losses, reserves, underwriting results and the final stakeholder profit split.
This is not a generic revenue-growth template or a basic premium calculator. It is a connected operating and financial model that follows the complete program-business value chain: submissions to quotes; quotes to binds; binds to gross written premium; GWP to ceded and retained premium; premium to commissions and losses; losses to reserve requirements; and the remaining economics to the MGA, retail agent, fronting carrier, reinsurer, captive cell and risk-capital provider.
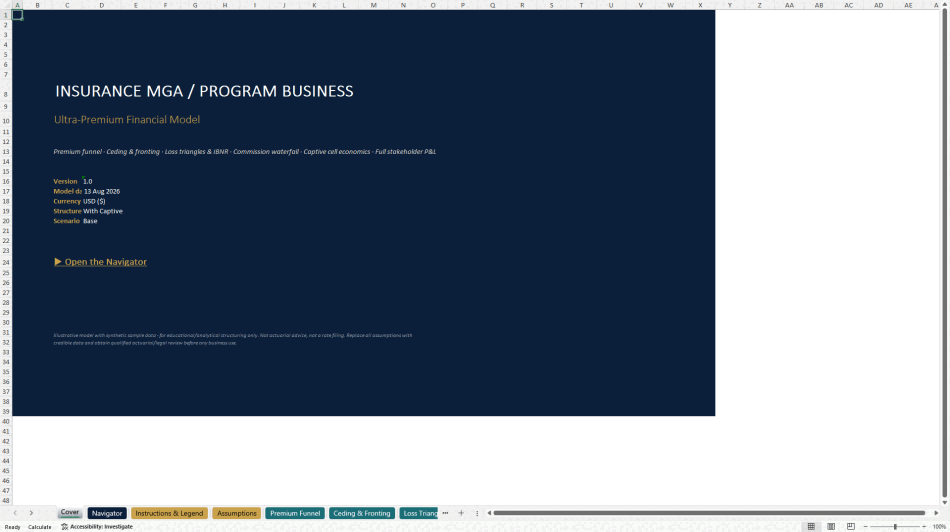
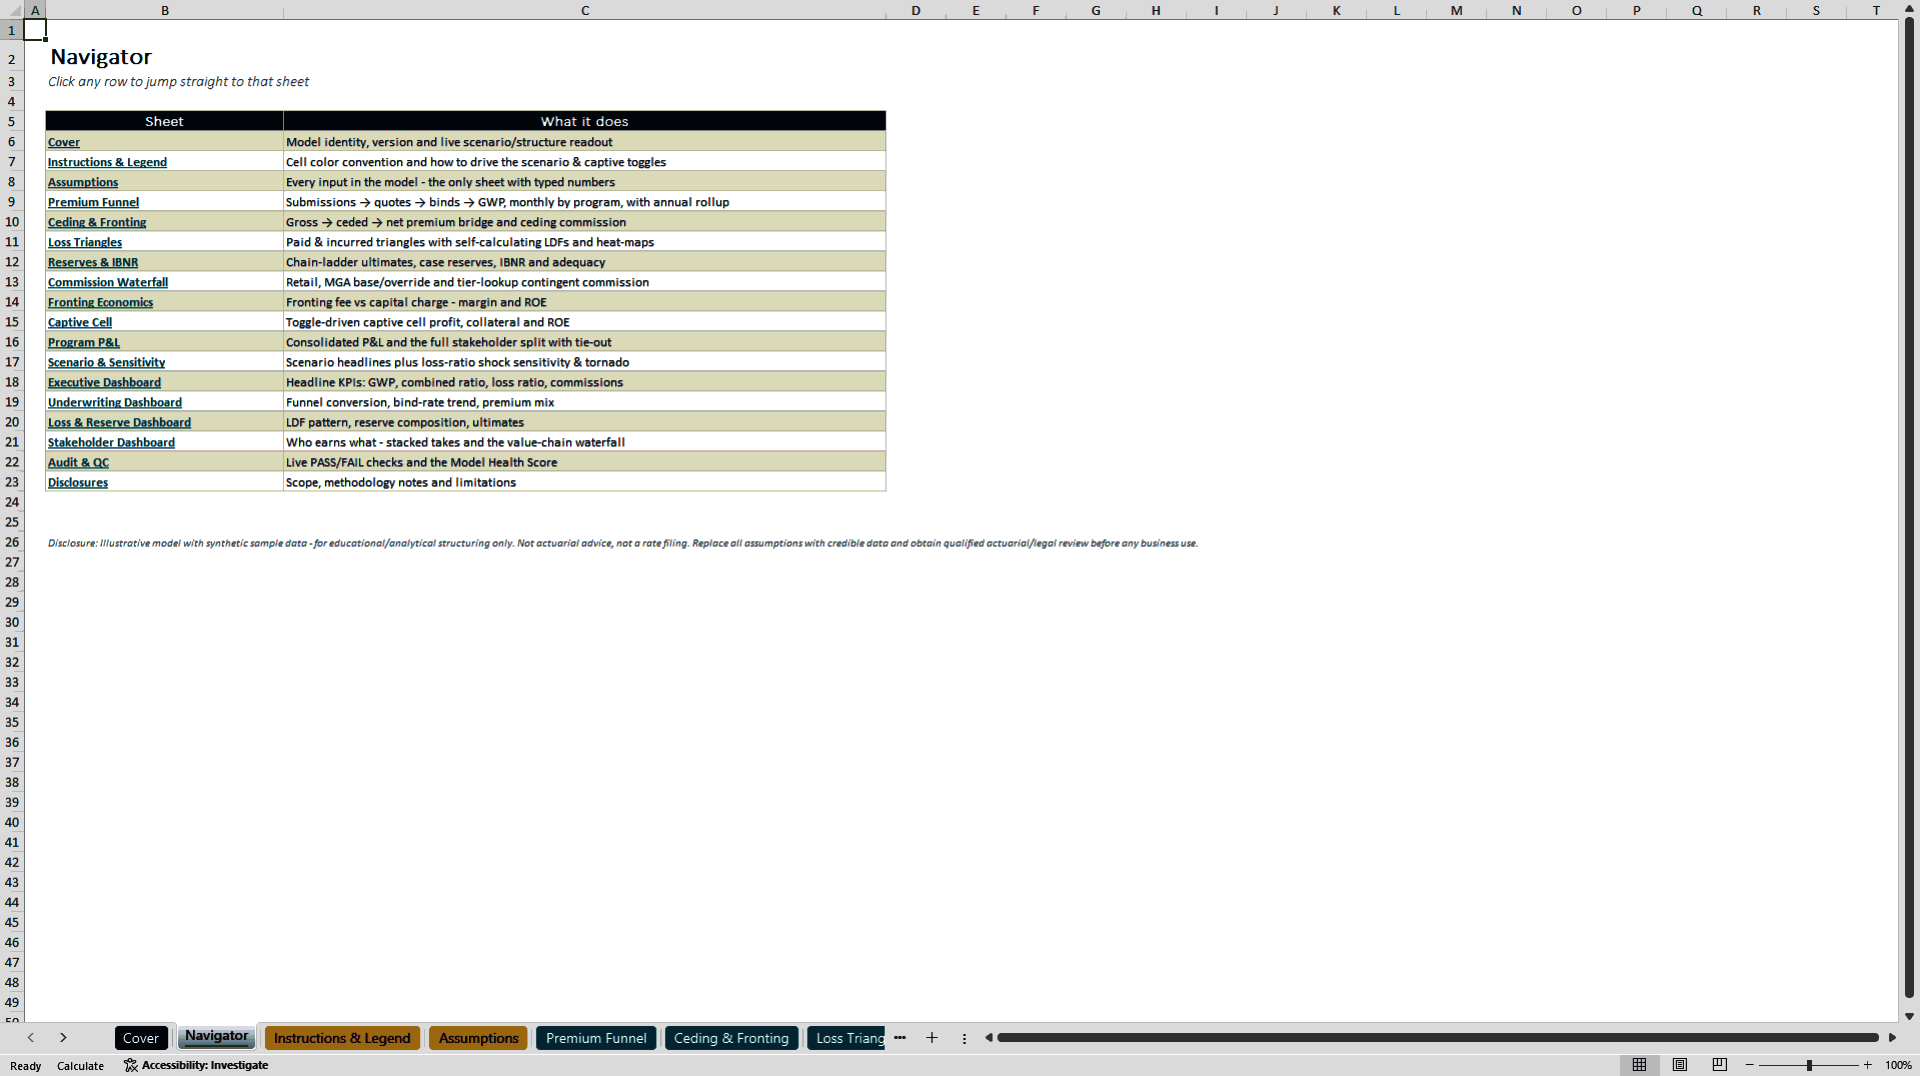
The workbook combines monthly operating drivers, five-year financial projections, loss-reserving mechanics, commission waterfalls, fronting economics, captive participation, scenario analysis and decision-ready dashboards in one professionally structured model. It is delivered as a native Excel workbook with 19 linked sheets, 27 charts and no macros or VBA. Inputs are visually separated from calculations, material outputs trace back to assumptions, and the Audit and QC sheet continuously tests the model's internal integrity.
📌 COMPLETE MODEL COVERAGE – The interconnected modules include global assumptions and operating controls; a 60-month submissions-to-premium funnel; five-year GWP projections by program; gross, ceded and net premium bridges; quota-share reinsurance and ceding commission; paid and incurred loss-development triangles; simplified chain-ladder ultimate loss and IBNR calculations; retail, MGA base, override and contingent commissions; fronting-carrier fee, capital charge, margin and ROE; with-captive versus without-captive economics; a consolidated program P&L; a complete stakeholder economics waterfall; Base, Upside and Downside scenarios; loss-ratio sensitivity analysis; four professional dashboards; and live formula, blank-cell, reconciliation and structural controls.
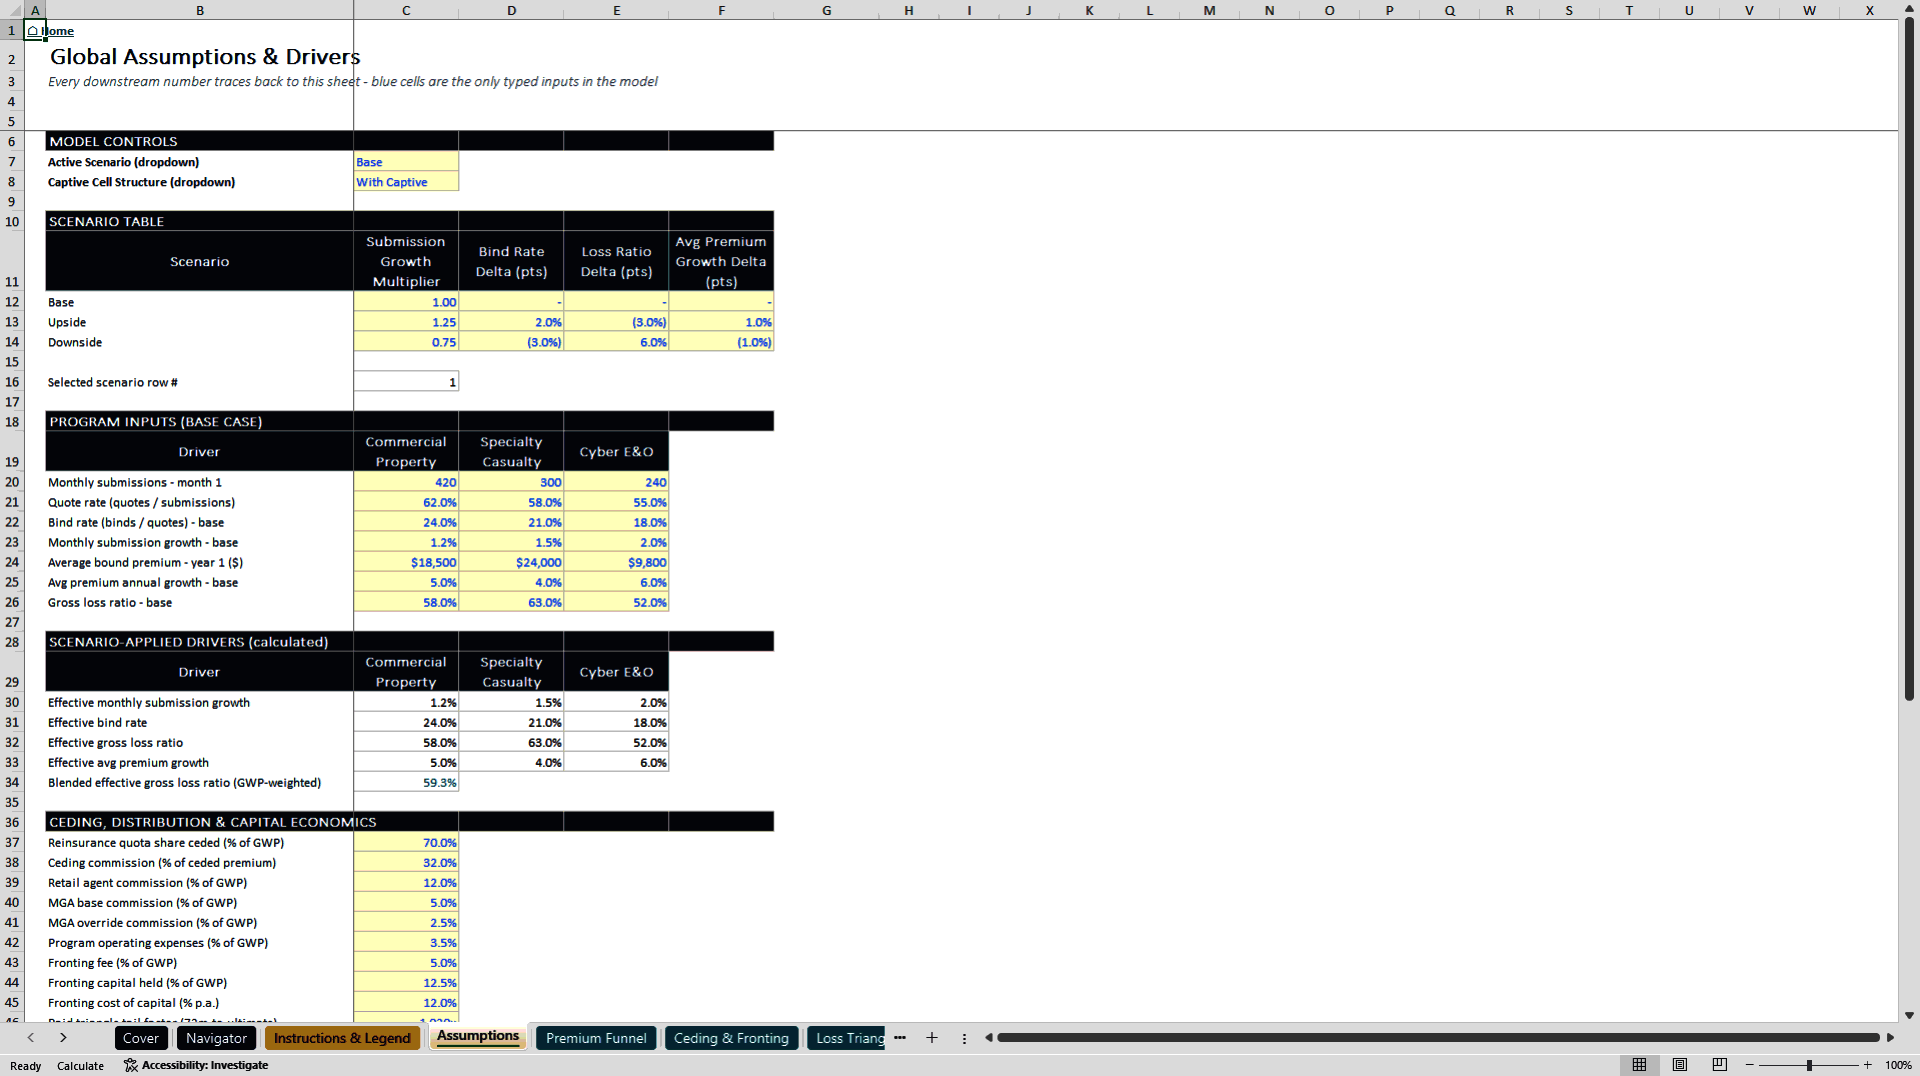
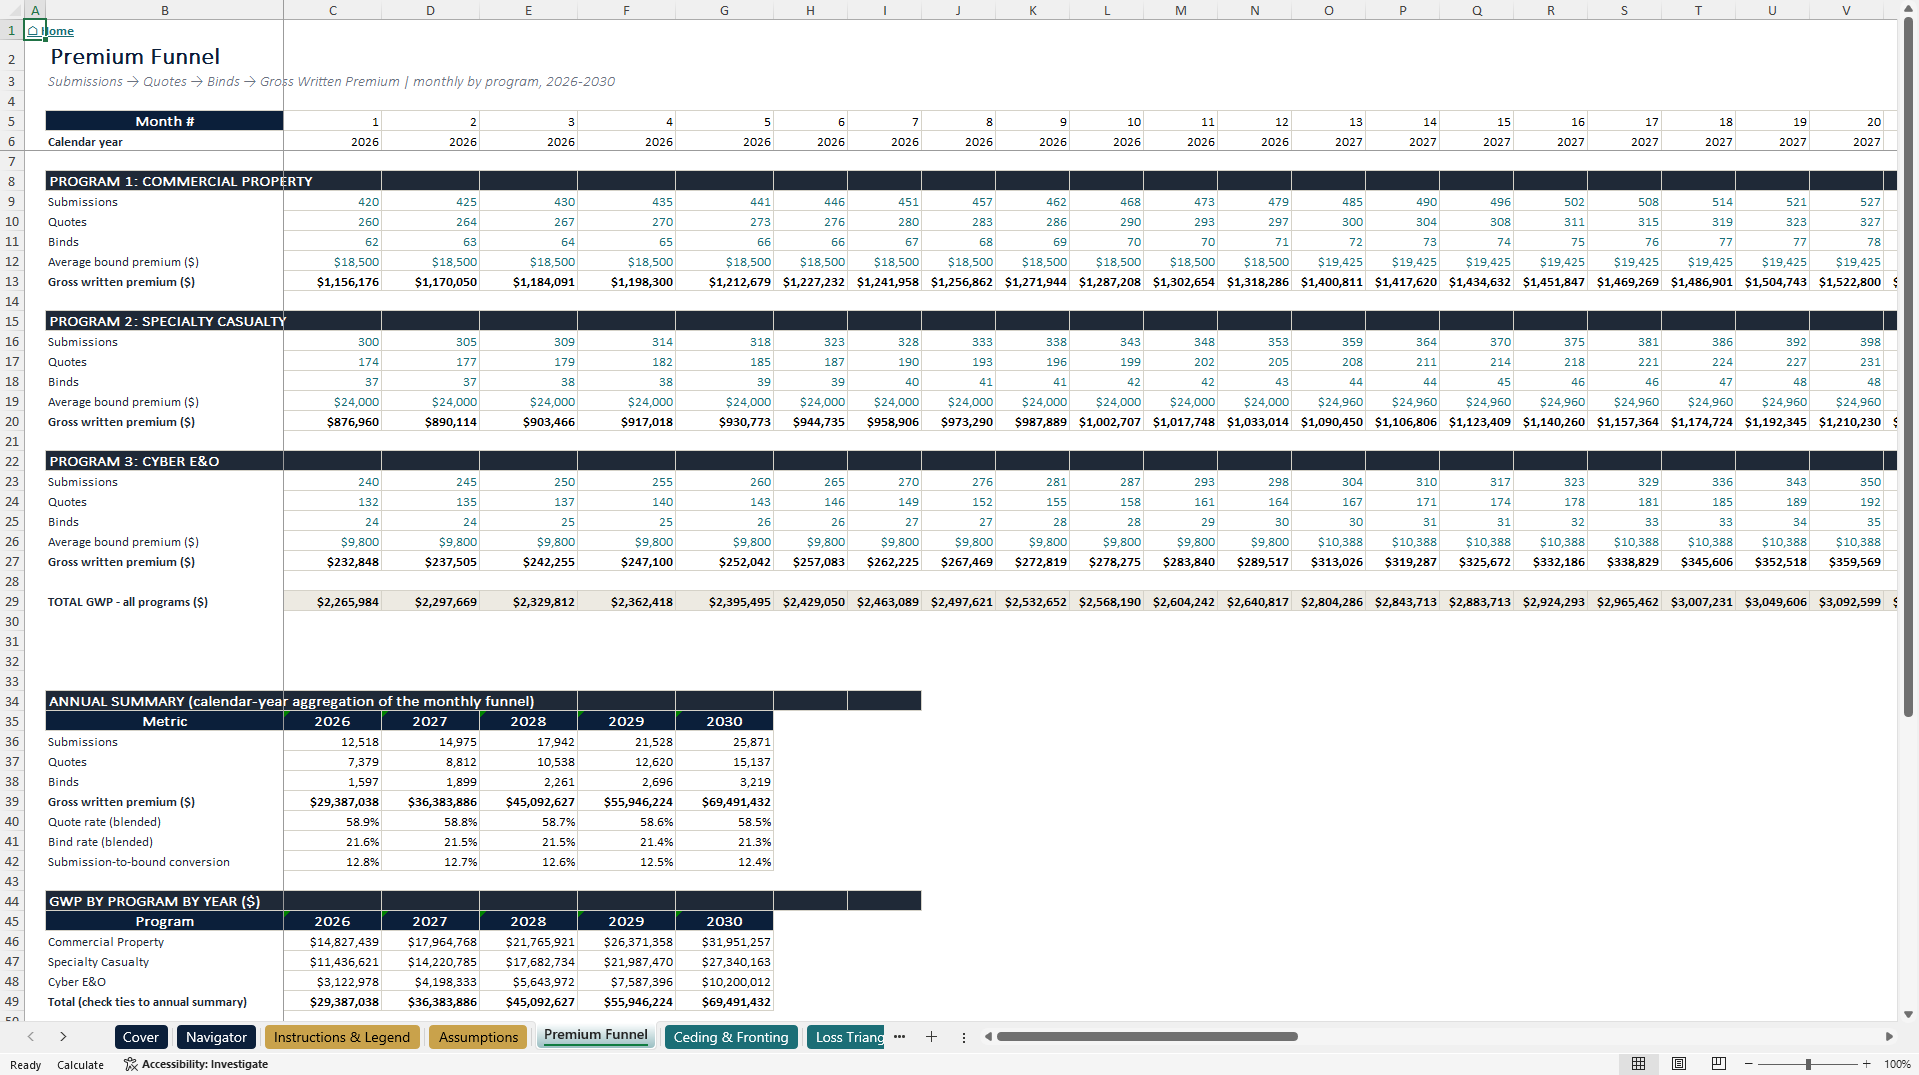
📈 PREMIUM FUNNEL AND GWP FORECASTING – The model starts with the operating engine of an MGA: its ability to source, quote and bind insurance business. The Premium Funnel covers 60 monthly periods from 2026 through 2030 across three illustrative specialty programs—Commercial Property, Specialty Casualty and Cyber E&O. For each program, users can enter opening monthly submission volume; quote rate; bind rate; monthly submission growth; average premium per bound policy; annual premium growth; and program-specific gross loss ratio.
The model calculates submissions, quotes, binds, average bound premium and gross written premium for every month. It then converts the monthly output into a calendar-year summary for 2026–2030, including blended quote rate, blended bind rate and submission-to-bound conversion. This allows buyers to identify exactly what drives premium growth. GWP is produced from the underlying pipeline and conversion assumptions rather than being entered as a simple top-down growth figure.
🔁 CEDING AND FRONTING STRUCTURE – The Ceding and Fronting module converts gross written premium into ceded premium and net written premium using an adjustable quota-share assumption. It calculates gross written premium; ceded premium under the quota-share treaty; net written premium retained by the program; ceding commission received; and the resulting retention ratio. This provides a clear gross-to-net premium bridge and makes the financial effect of reinsurance visible throughout the forecast period.
The separate Fronting Economics module evaluates the carrier's position by modelling fronting fee income as a percentage of GWP; captive-cell rental income where applicable; regulatory capital held as a percentage of GWP; capital charge based on the carrier's cost of capital; economic margin after the capital charge; fronting ROE; and fee income as a percentage of GWP. This is useful when assessing whether the proposed fee adequately compensates the carrier for the capital committed to the program.
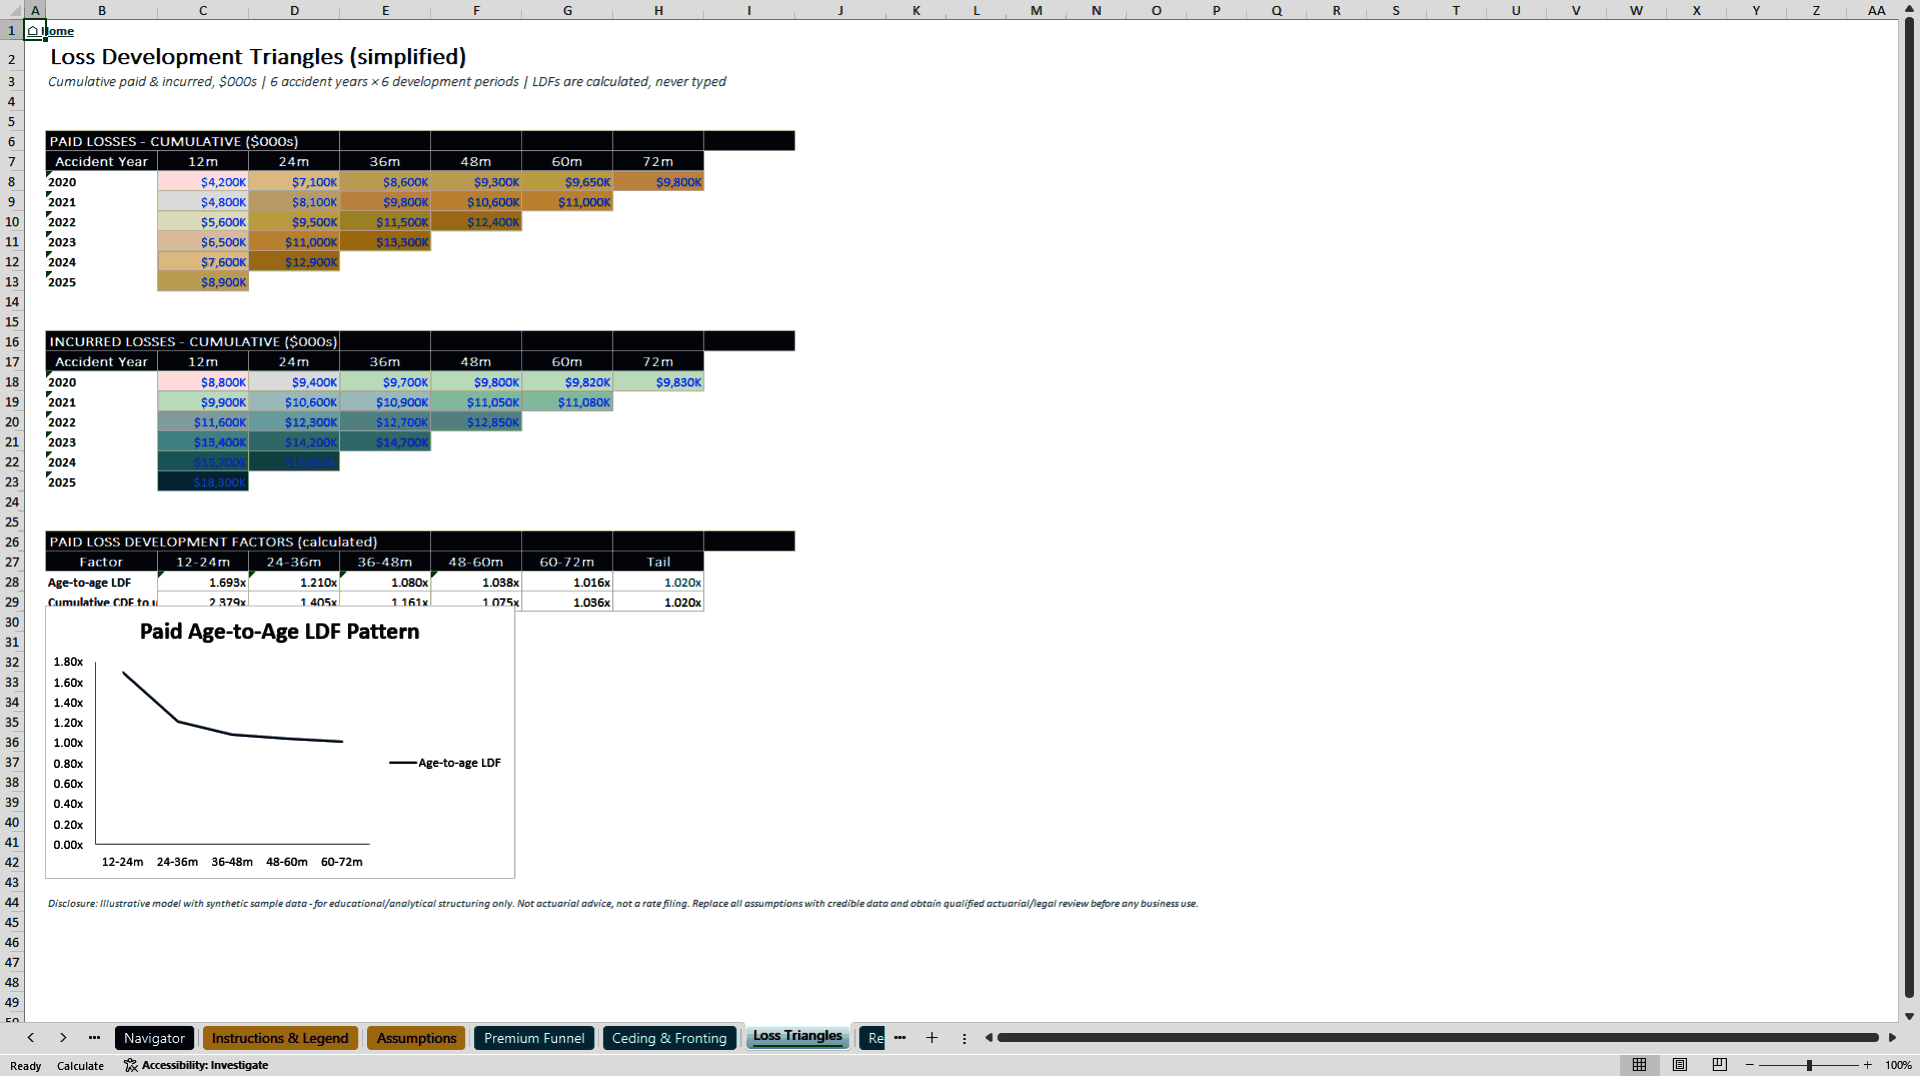
📉 LOSS TRIANGLES, RESERVE DEVELOPMENT AND IBNR – The workbook includes cumulative paid and incurred loss-development triangles using six accident years and six annual development periods. Instead of requiring development factors to be entered manually, the model calculates volume-weighted age-to-age paid-loss development factors from the triangle data and applies a user-controlled tail factor.
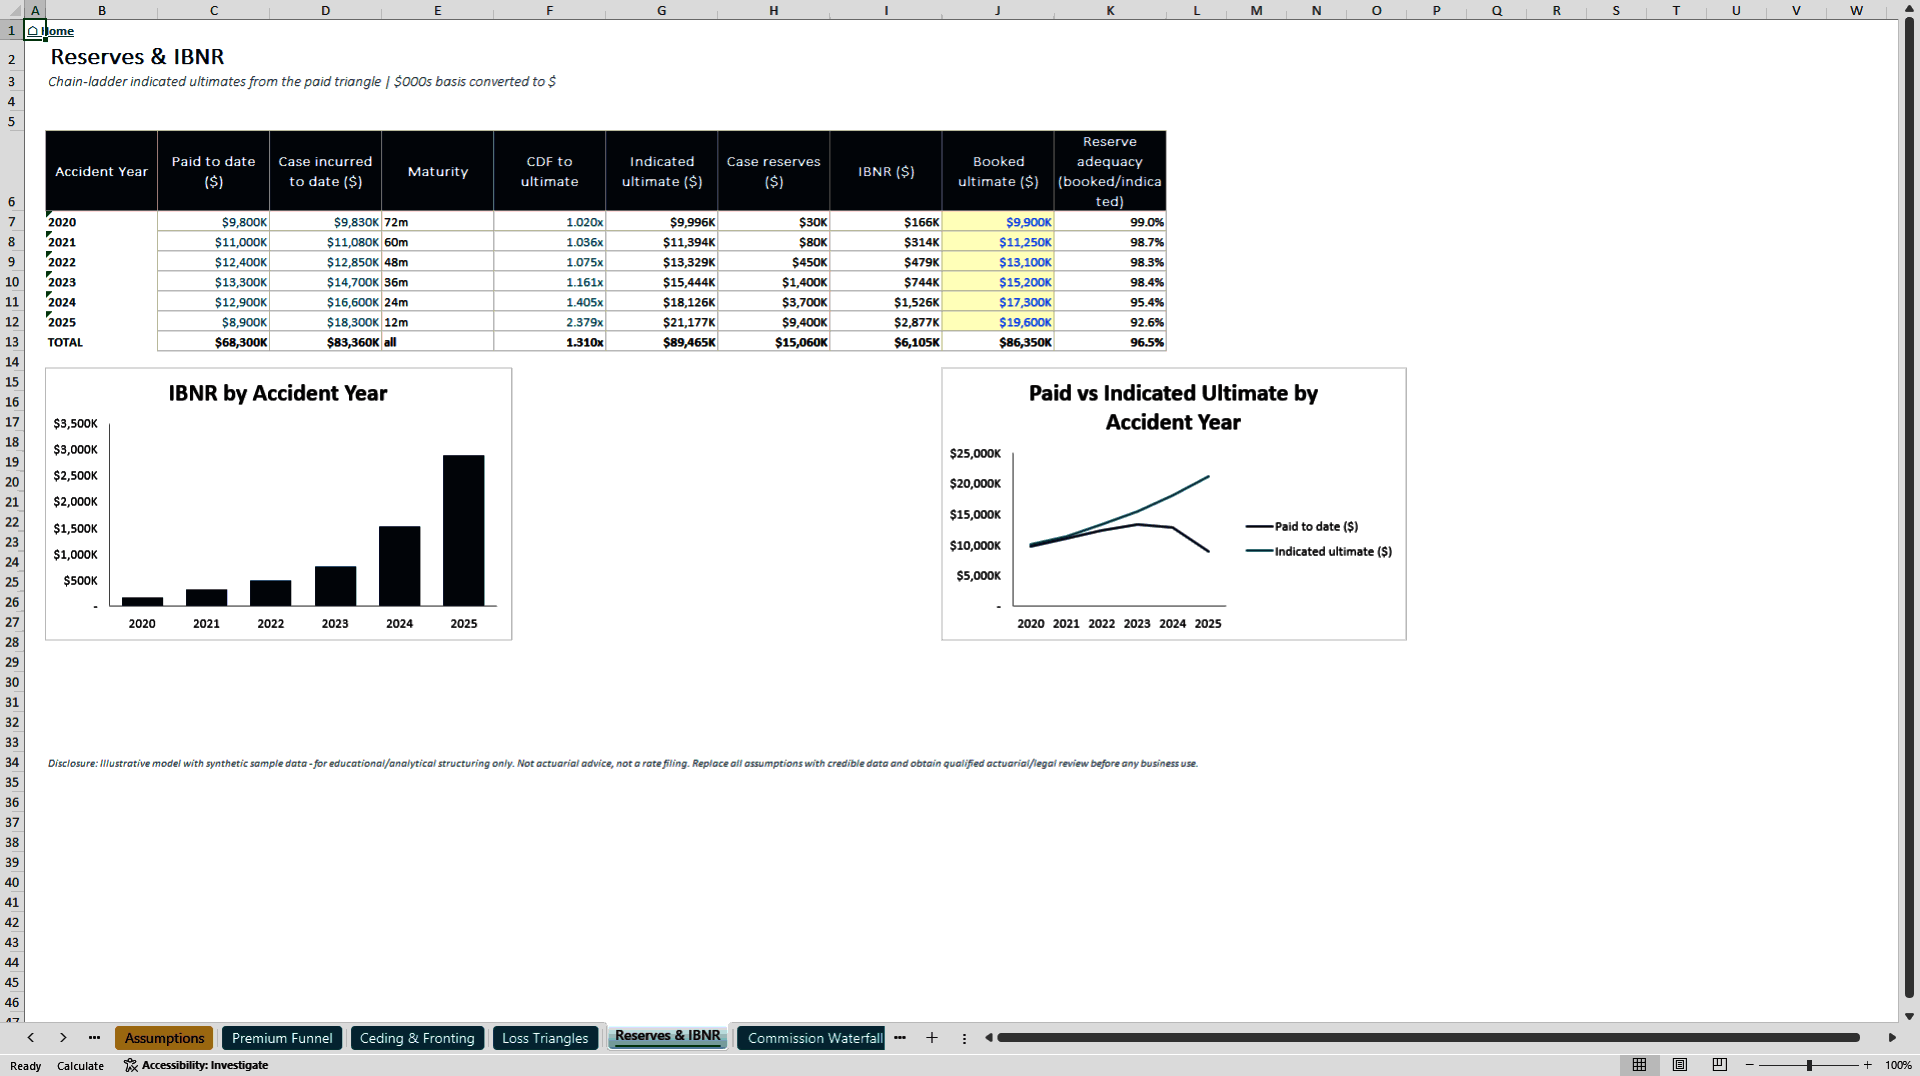
The Reserves and IBNR schedule then calculates paid losses to date; case incurred losses to date; current maturity; cumulative development factor to ultimate; simplified chain-ladder indicated ultimate loss; case reserves; IBNR; user-entered booked ultimate loss; and reserve adequacy by accident year. It also calculates total carried reserves and provides loss-development and reserve-composition views. This helps users understand how emerging claims experience may affect indicated ultimate losses, reserve needs and program economics.
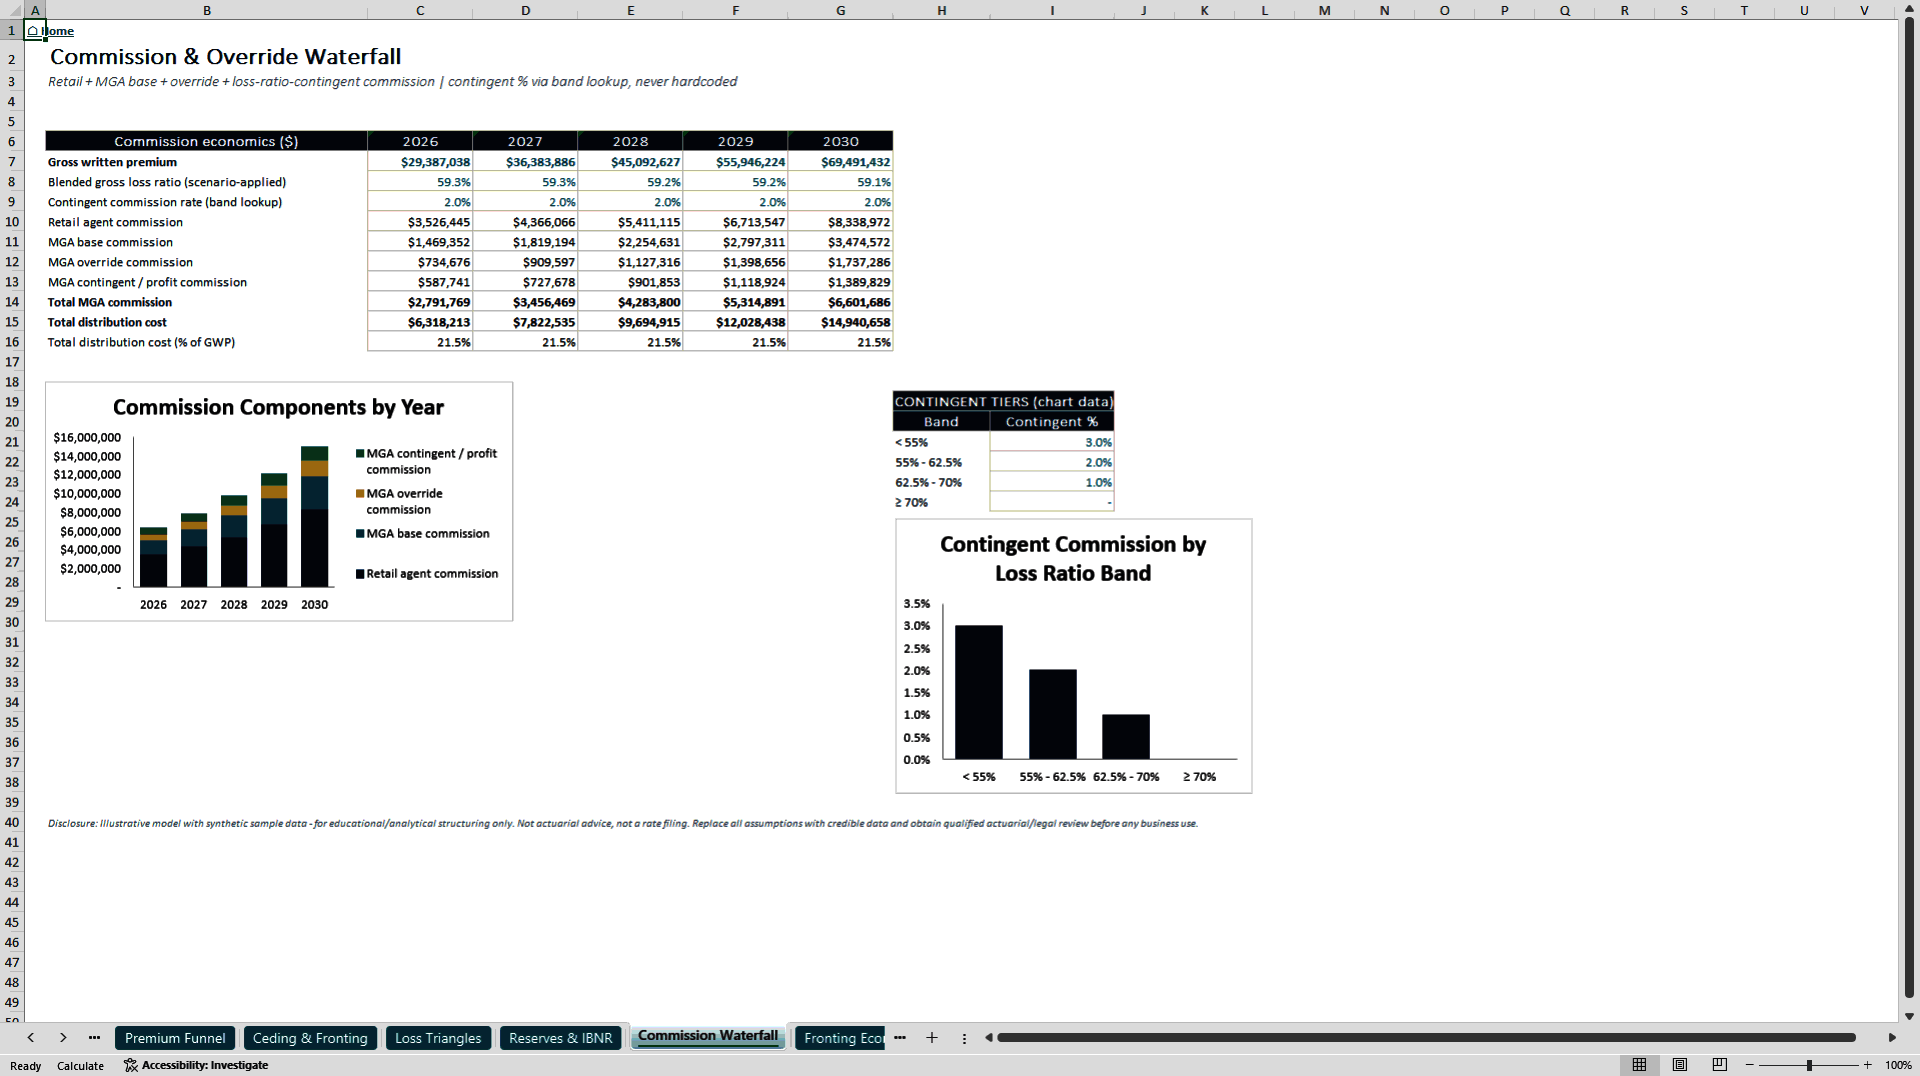
💼 MULTI-LAYER COMMISSION WATERFALL – The Commission Waterfall separates distribution cost into distinct economic layers rather than combining everything into one commission rate. It calculates retail agent commission; MGA base commission; MGA override commission; MGA contingent or profit commission; total MGA remuneration; total distribution cost; and distribution cost as a percentage of GWP.
Contingent commission is determined through a loss-ratio band table. The applicable rate is selected from the program's blended gross loss ratio, allowing underwriting performance to influence MGA remuneration. Because the commission layers are shown individually, the workbook makes it easier to analyse, negotiate and explain how economics are divided between the retail agent and MGA.
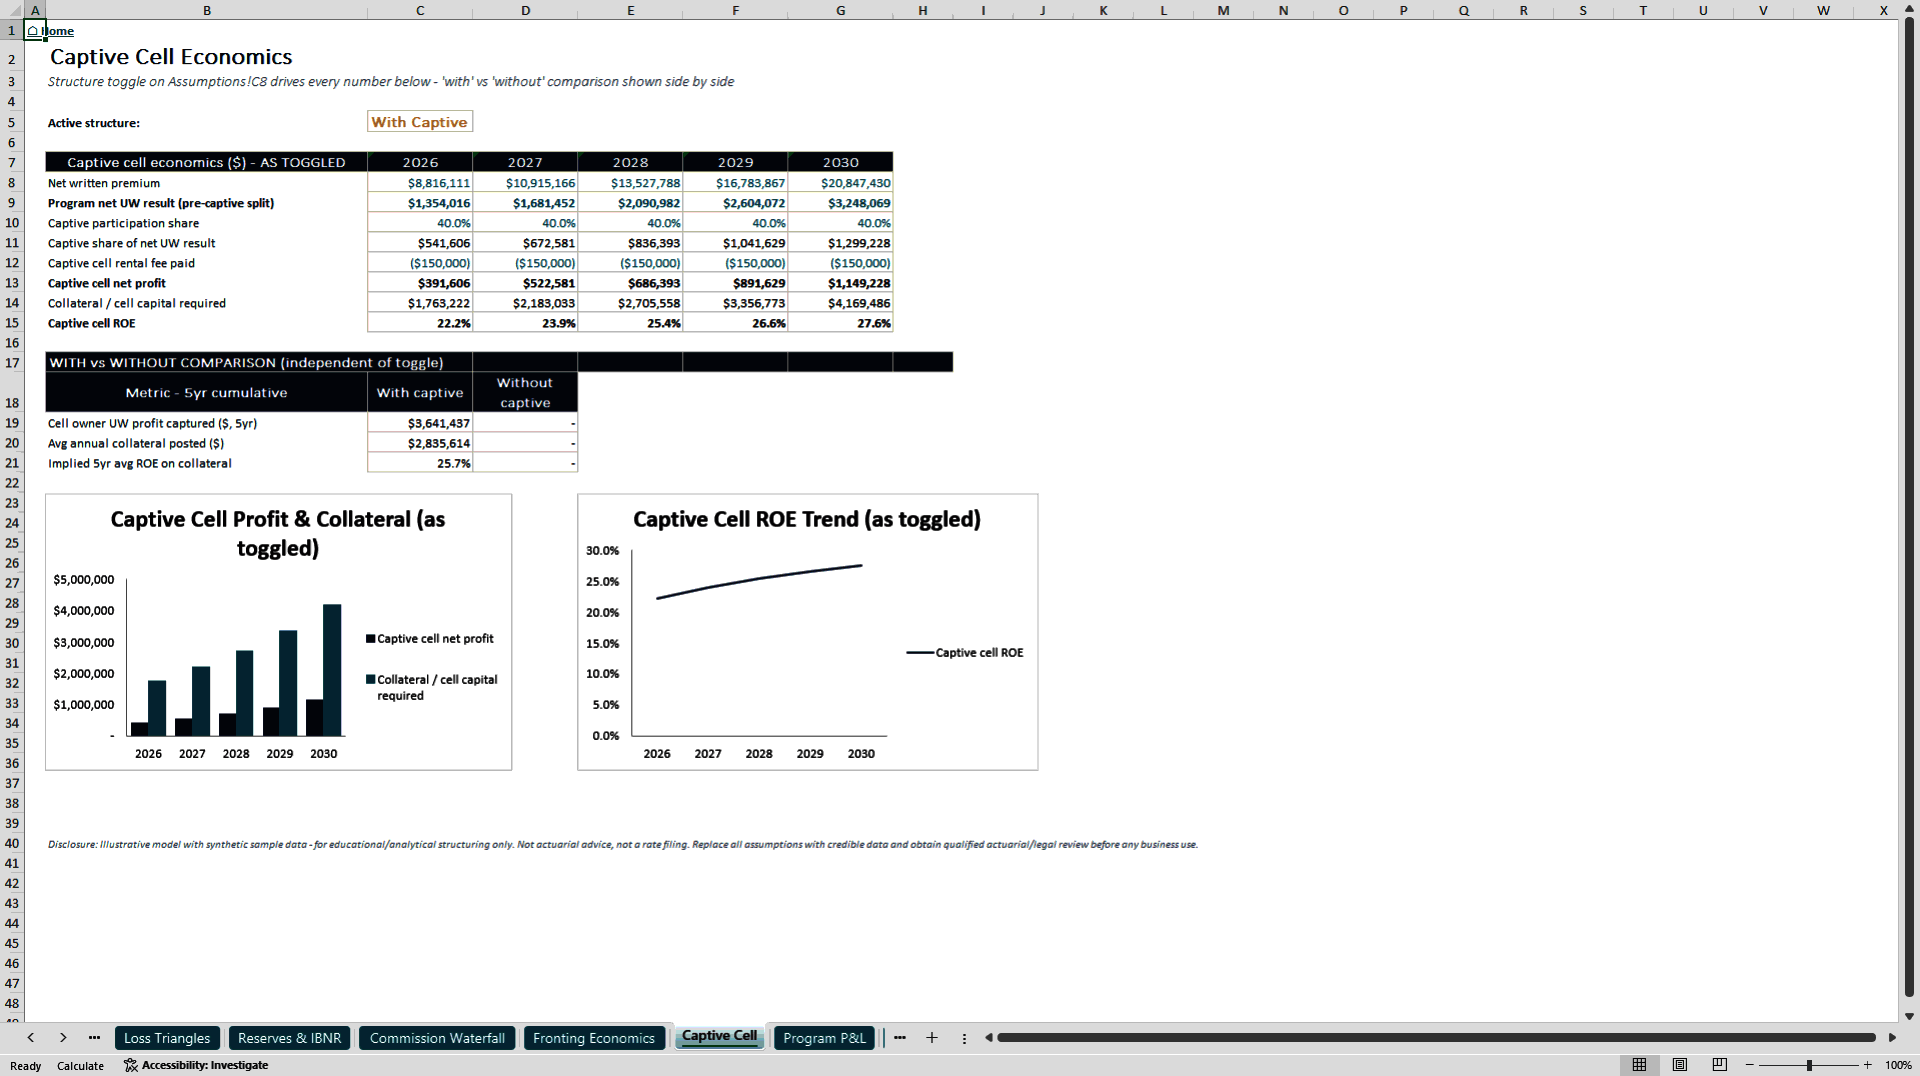
🏦 CAPTIVE-CELL ECONOMICS – The model includes an adjustable With Captive or Without Captive switch. This is a genuine economic toggle rather than a label change: it changes how underwriting profit is allocated and updates captive profit, collateral requirements, rental fees and the wider stakeholder P&L.
The Captive Cell schedule calculates net written premium; program underwriting result before the captive split; captive participation percentage; captive share of underwriting profit; annual cell rental fee; net captive-cell profit; required collateral or cell capital; and captive-cell ROE. A separate cumulative comparison shows the financial effect of operating with and without the captive, including captured underwriting profit, average collateral posted and implied return on collateral. This supports MGAs, program sponsors and capital partners evaluating whether participation in underwriting profit justifies the collateral commitment and facility cost.
💰 CONSOLIDATED PROGRAM P&L – The Program P&L consolidates the operating, reinsurance, loss and fee mechanics into one five-year financial statement. It reports gross written premium; gross ultimate losses; the gross underwriting economics pool; ceded premium; ceded loss recoveries; ceding commission received; retail agent commission; MGA base, override and contingent commissions; fronting fee; program operating expenses; net earned premium; net incurred losses; net expense load; net underwriting result; net loss ratio; net expense ratio; and net combined ratio.
The stakeholder section then reconciles the full gross economics pool across the retail agent; MGA; fronting carrier; reinsurer; program operating expenses; captive cell; captive facility sponsor; and risk-capital provider. This helps answer the central commercial question in program business: who earns what, why, and how does the allocation change when underwriting assumptions or the selected structure changes?
🧪 SCENARIOS AND SENSITIVITY – The workbook contains Base, Upside and Downside scenarios. The scenario switch changes submission growth, bind rates, loss ratios and average premium growth, and the selected assumptions flow through the funnel, commissions, underwriting economics, captive returns, P&L and dashboards. The sensitivity grid tests gross loss-ratio shocks and calculates their effect on 2026 net underwriting result, captive-cell profit, captive-cell ROE and the change in underwriting result versus the base case. This shows how quickly profitability and captive returns may improve or deteriorate as loss experience changes.
📊 FOUR PROFESSIONAL DASHBOARDS – The Executive Dashboard presents GWP, combined ratio, loss ratio, MGA commission and net underwriting result. The Underwriting Dashboard presents submissions, quotes, binds, conversion, bind-rate trend and premium mix. The Loss and Reserve Dashboard presents loss-development factors, indicated ultimate losses, IBNR, case reserves and reserve adequacy. The Stakeholder Dashboard presents the economics of the retail agent, MGA, fronting carrier, reinsurer, captive cell and risk-capital provider. These dashboards convert detailed schedules into clear outputs for management review, program discussions, investor analysis and internal decision-making.
✅ AUTOMATED AUDIT AND QC – The built-in Audit and QC sheet performs 31 live checks covering formula errors; blanks in active model tables; GWP reconciliation; gross-to-net premium tie-out; stakeholder waterfall reconciliation; P&L-to-chart-data tie-out; triangle-to-reserve-schedule reconciliation; captive-toggle integrity; contingent-commission band validation; cumulative-development-factor monotonicity; circular-reference control; hardcoding control; chart-series naming; implicit-intersection control; and external-link control. These checks feed a visible Model Health Score so users can quickly assess whether the workbook remains internally consistent after inputs are changed.
🎯 INTENDED USERS – The model is especially relevant for MGA founders and management teams; program administrators; specialty-insurance underwriting teams; fronting carriers; reinsurance professionals and brokers; captive managers and cell-facility sponsors; insurance consultants and transaction advisers; private-equity and strategic investors evaluating MGA economics; FP&A, finance and corporate-development professionals; and analysts or advanced students learning program-business economics.
🧭 HOW TO USE THE MODEL – First, review the Instructions and Legend sheet to understand the colour convention and control logic. Second, choose the active scenario and captive structure on the Assumptions sheet. Third, replace the synthetic inputs with credible program-specific submission, conversion, premium, loss, ceding, commission, fronting and capital data. Fourth, review the monthly funnel and annual GWP output for each line of business. Fifth, analyse the ceding structure, commission waterfall, fronting economics and captive-cell results. Sixth, replace the illustrative triangle data and booked ultimates with appropriate program information. Seventh, review the P&L, scenarios, sensitivity and dashboards. Finally, confirm that the Audit and QC Model Health Score remains at 100% before relying on any output.
Got a question about the product? Email us at support@flevy.com or ask the author directly by using the "Ask the Author a Question" form. If you cannot view the preview above this document description, go here to view the large preview instead.
Source: Best Practices in Insurance Excel: Insurance MGA and Program Business Model Excel (XLSX) Spreadsheet, PDMM Financial Models
ABOUT THE AUTHOR

PDMM Financial Models develops professional, decision-ready Excel models for business owners, entrepreneurs, investors, consultants, analysts, and finance teams. Our objective is to transform complex business assumptions into clear, structured analysis that supports better planning and investment decisions.
Our models cover business planning, forecasting, budgeting, feasibility analysis,
... [read more]
Ask the Author a Question
You must be logged in to contact the author.




























