
General Hospital 10-Year 3 Statement Financial Model – Excel XLSX
Excel (XLSX)
BENEFITS OF THIS DOWNLOADABLE EXCEL DOCUMENT
- Provides a structured framework for forecasting the financial performance of a hospital development and operations platform.
- Enables detailed modelling of patient volumes, clinical revenue streams, and hospital infrastructure investment.
- Supports strategic planning, capital raising, and long-term financial analysis for healthcare projects.
HEALTHCARE EXCEL DESCRIPTION
Curated by McKinsey-trained Executives
🏥 General Hospital Advanced 3-Statement Financial Model
The Complete Financial Forecasting System for Hospital Developers, Healthcare Operators & Medical Investors 💊📈
Finally understand exactly how your hospital project raises capital, builds out infrastructure, ramps patient volumes, and generates sustainable financial returns.
The General Hospital Advanced 3-Statement Financial Model is a fully integrated financial forecasting system built specifically for hospital developers, healthcare operators, private investors, and project finance teams.
It allows you to model patient volume growth across six clinical revenue streams, full hospital development budgeting from land through fit-out, departmental fee schedules, staffing and compensation structures, medical equipment CapEx, debt and equity financing, and complete hospital-level financial statements over a 10-year projection period.
No generic healthcare templates.
No guesswork.
Just a structured financial engine built around real hospital operational and development drivers.
💼 Built Around Real Hospital Revenue Streams
This model reflects the actual ways hospitals generate revenue – across six distinct income lines, all driven by patient volume and clinical operational inputs.
📊 Inpatient (IPD) Revenue
• Net IPD revenue calculated from occupied bed days and average revenue per patient day – fully adjustable in the Assumptions tab
• Payer-class revenue split modelled independently across Self-Pay, Insurance, and Government patients
• Insurance discount rate and government reimbursement discount applied automatically from the Assumptions tab
• Net IPD revenue reflects the blended realised rate after all payer discounts – not just gross billings
• IPD revenue ramps as bed occupancy builds from 45% in Year 1 to 78% at steady state from Year 3
💰 Surgical & Procedure Revenue
• Surgery revenue per procedure applied directly to the surgical procedure count – set once in Assumptions
• Surgical volume driven by IPD admissions multiplied by the surgical conversion rate (22% default)
• Revenue scales automatically as IPD admissions grow – no manual override required
• Annual fee escalation applied via a compounding price escalation factor across all revenue lines
• Surgical revenue is modest in the early ramp years and reaches full run-rate as occupancy stabilises from Year 3
🏢 Outpatient, Diagnostics, Pharmacy & Physiotherapy
• OPD consultation revenue per visit – scales with OPD visit throughput driven by a bed-linked visits-per-bed assumption (180 visits per bed per year)
• Diagnostics and imaging revenue per IPD patient – grows directly with inpatient admission count
• Pharmacy and lab revenue per patient day – scales with total occupied bed days
• Physiotherapy and rehabilitation revenue per session – driven by IPD admissions multiplied by the physiotherapy utilisation rate (18% default)
• All four ancillary lines compound annually via the same price escalation factor applied across the model
The model automatically calculates and rolls up:
📈 Net IPD revenue after payer discounts, by self-pay, insurance, and government class
📈 Surgical revenue tied directly to IPD admission growth and the surgical conversion rate
📈 OPD, diagnostics, pharmacy, and physiotherapy fees scaling with patient throughput
📈 Total hospital revenue growing strongly across the full 10-year forecast
Everything rolls up into a complete 10-year revenue forecast, with a revenue mix breakdown and year-on-year growth rate visible on the Revenue Model tab.
🏦 Hospital Development Model – Full Construction Budgeting
Your hospital's financial performance depends entirely on the development programme. The model includes a dedicated CapEx schedule that calculates the full development cost from land acquisition through to commissioning.
The development CapEx model covers:
✔ Land purchase – acres required multiplied by price per acre, both fully configurable
✔ Hospital building construction – built-up area calculated from licensed beds multiplied by area per bed, with hard cost per square foot spread across Year 1 and Year 2
✔ Parking structure – levels, spaces per level, and area per space multiplied by hard cost per square foot
✔ Soft costs – design, project management, and G&A loaded as a percentage of hard costs (18% default)
✔ Contingency – construction contingency as a percentage of hard costs (8% default)
✔ Medical equipment – initial equipment purchase commissioned in Year 1
✔ IT systems and EMR – initial systems investment
✔ Furniture and fittings
✔ Security systems
Total development CapEx concentrates heavily in Years 1 and 2. From Year 3 onward CapEx falls to zero as the hospital moves into full operation.
The development model also includes a built-up area breakdown across four use types: Administration (10%), Patient Care & Hospitality (45%), Storage & Supply (8%), and Medical Units including ICU, operating rooms, and labs (37%).
📊 Patient & Cohort Model – Volume Driven From Beds Up
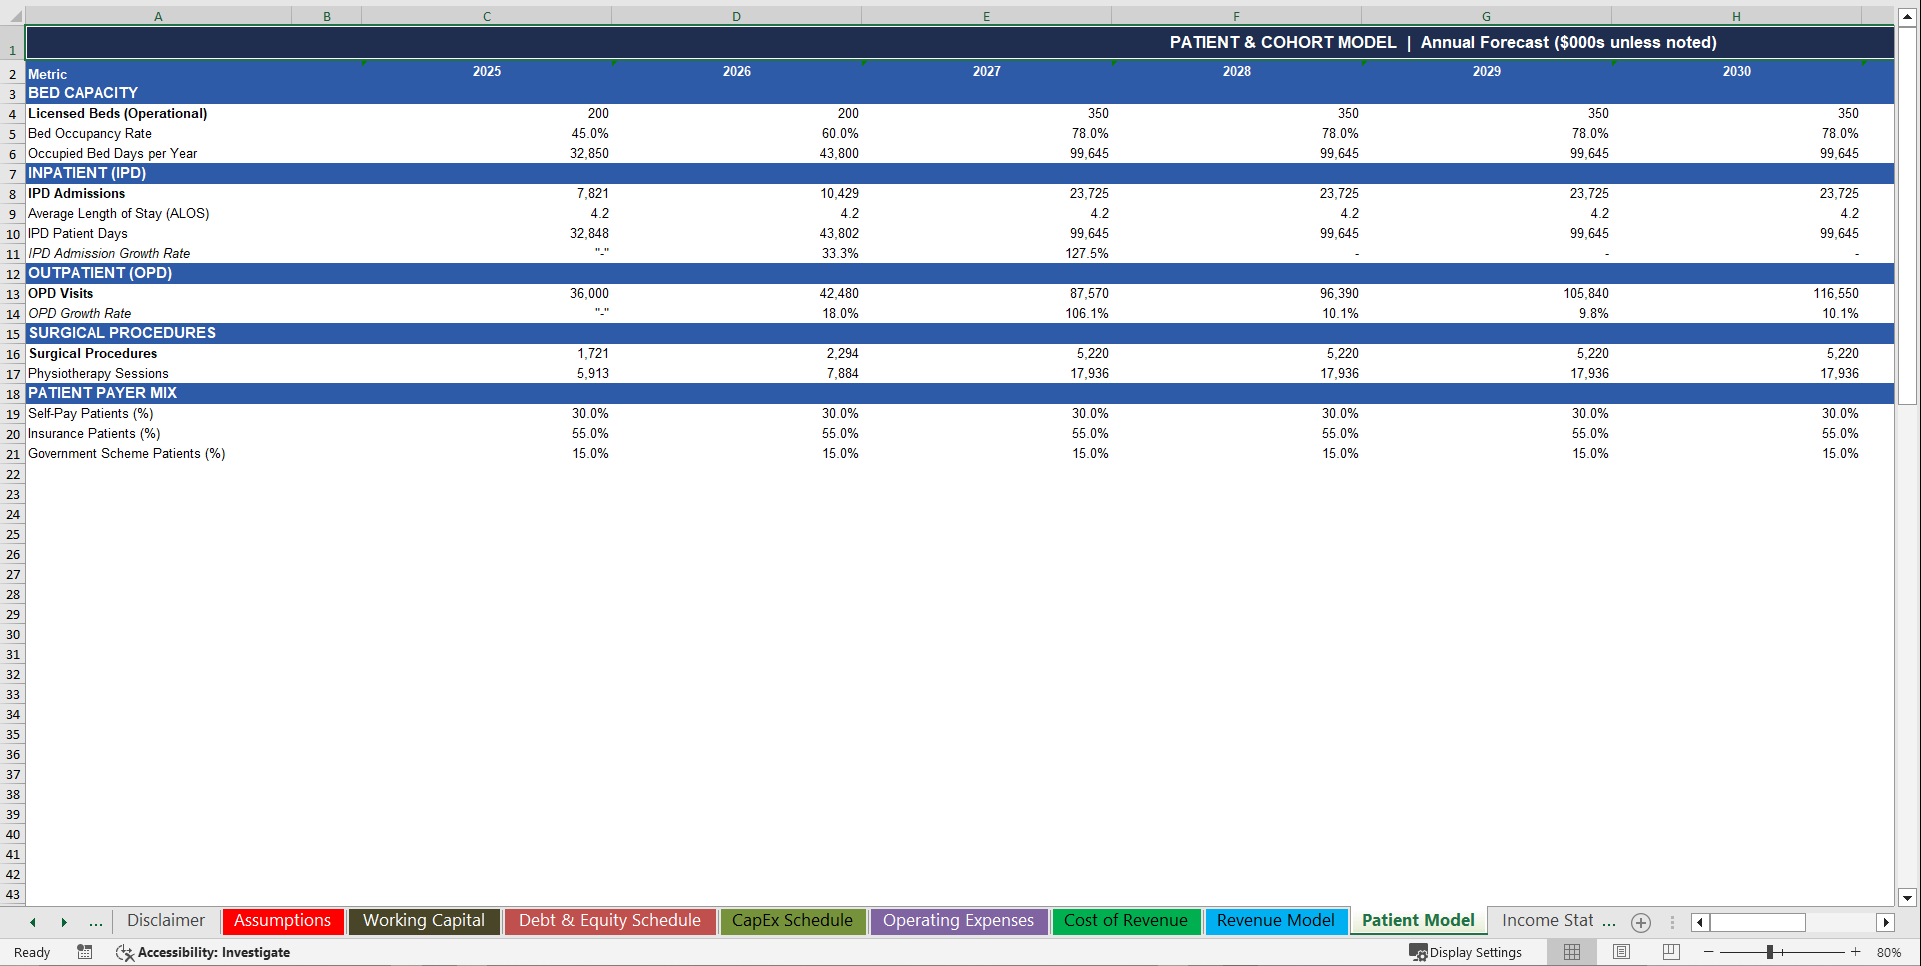
The model tracks patient volumes from bed capacity through to individual service line throughput, giving you a complete picture of clinical scale year by year.
The Patient Model tracks, for every year across the 10-year forecast:
• Licensed beds operational – opening bed count in Years 1–2, ramping to full licensed capacity from Year 3
• Bed occupancy rate – 45% in Year 1, 60% in Year 2, 78% from Year 3 at steady state – all adjustable
• Occupied bed days per year – beds multiplied by occupancy multiplied by 365
• IPD admissions – occupied bed days divided by average length of stay (ALOS, 4.2 days default)
• IPD patient days – admissions multiplied by ALOS
• OPD visits – bed count multiplied by OPD visits per bed (180 default), with a growth factor applied annually
• Surgical procedures – IPD admissions multiplied by surgical conversion rate (22%)
• Physiotherapy sessions – IPD admissions multiplied by physiotherapy utilisation rate (18%) multiplied by ALOS
• Payer mix – self-pay (30%), insurance (55%), and government scheme (15%)
The total patient volume trajectory tells the story of hospital scaling. In Years 1–2, only the opening bed complement is active and occupancy is ramping. From Year 3, full capacity is operational at steady-state occupancy. OPD visits continue growing through to Year 10 as the patient base expands year on year.
🔁 Cost of Revenue – Operationally Driven COGS
The model does not use a single blended cost rate. Cost of revenue is broken down across eight direct clinical cost lines, each calculated as a percentage of total revenue from the Assumptions tab.
The eight COGS lines are:
• Medical consumables and drugs – 12% of revenue
• Physician salaries (direct care) – 18% of revenue
• Nursing and paramedic salaries – 13% of revenue
• Lab and imaging variable costs – 5% of revenue
• Outsourced clinical services – 3% of revenue
• Utilities – clinical operations – 3% of revenue
• Clinical waste management – 1% of revenue
• Malpractice insurance – 1.5% of revenue
In addition to these percentage-of-revenue lines, the model adds:
• Medical equipment maintenance – 4% of initial equipment cost per year
• Depreciation of medical equipment – straight-line over 10 years, flowing automatically from the CapEx schedule
Every percentage is individually configurable. Gross profit and gross margin calculate dynamically as total revenue minus total cost of revenue.
📐 Operating Expenses – By Category and by Role
Operating expenses are tracked across four categories, each with its own growth logic and all linked from the Assumptions tab.
Technology & IT
• Year 1 IT and EMR investment covers initial HIS, EMR, PACS, and network setup
• Recurring annual licence cost grows at a configurable rate from Year 2 onward
Sales & Marketing
• Higher Year 1 launch spend steps down to a steady-state marketing budget from Year 3, growing annually
General & Administrative
• Year 1 G&A base growing at a configurable annual rate slightly above the general inflation assumption
Senior Management Personnel
The model builds compensation role by role across five senior positions:
• CEO
• COO
• CMO (Chief Medical Officer)
• CFO
• Department Heads (configurable count and average salary)
All salaries escalate at a configurable annual rate. A bonus pool equal to a set percentage of total senior base salary is added every year. Every input is set in the Assumptions tab.
🏗 CapEx & Depreciation Schedule
The model includes a dedicated CapEx and Depreciation Schedule across four asset categories with individually configured useful lives.
Development and Construction CapEx:
• Land, hospital building, parking structure, soft costs, and contingency – concentrated in Years 1 and 2
Equipment and Systems CapEx:
• Medical equipment – depreciated straight-line over a configurable useful life (10 years default)
• IT systems and EMR – depreciated straight-line over a shorter useful life (5 years default)
• Furniture and fittings – depreciated straight-line over 7 years
• Security systems – included in Year 1 CapEx
Depreciation schedule:
• Building depreciation – straight-line over 40 years on the total construction cost, beginning Year 2
• Medical equipment, IT, and furniture depreciation – all begin Year 2
• Total D&A is zero in Year 1 and stabilises from Year 2 as all commissioned assets begin depreciation
Net book value of buildings is tracked year by year. All CapEx flows into the cash flow statement and all depreciation flows into the income statement.
🏦 Debt & Equity Schedule
The model includes a dedicated Debt and Equity Schedule covering the full financing structure of the hospital development.
Equity:
• Initial equity contribution raised in Year 1 – configurable from the Assumptions tab
Construction Loan:
• Total construction loan drawn in two equal tranches across Years 1 and 2
• Configurable construction loan interest rate
• Full repayment at the end of Year 3 when the term loan is drawn
Term Loan:
• Term loan drawn in Year 3 to refinance the construction period
• Configurable term loan interest rate
• Configurable amortisation tenor with annual principal repayment beginning Year 4
• Debt Service Cover Ratio target configurable in the Assumptions tab
Total interest expense and total debt outstanding are calculated for every year and flow directly into the income statement and balance sheet.
📦 Working Capital Schedule
The model includes a Working Capital Schedule tracking four core operating accounts:
• Accounts receivable – calculated on a 45-day collection lag on total revenue, reflecting insurance collection timing
• Inventory and prepaid expenses – sized on a 20-day cost-of-revenue holding assumption
• Accounts payable – calculated on a 30-day supplier payment term applied to total COGS
• Accrued expenses – one month of total operating expenses accrued at year-end
All collection and payment periods are adjustable from the Assumptions tab. Net working capital and the year-on-year change in net working capital feed directly into the cash flow statement, ensuring that revenue growth translates into realistic cash timing – not just accounting income.
📊 Fully Integrated 3-Statement Financial Model
The model generates three complete, fully linked financial statements.
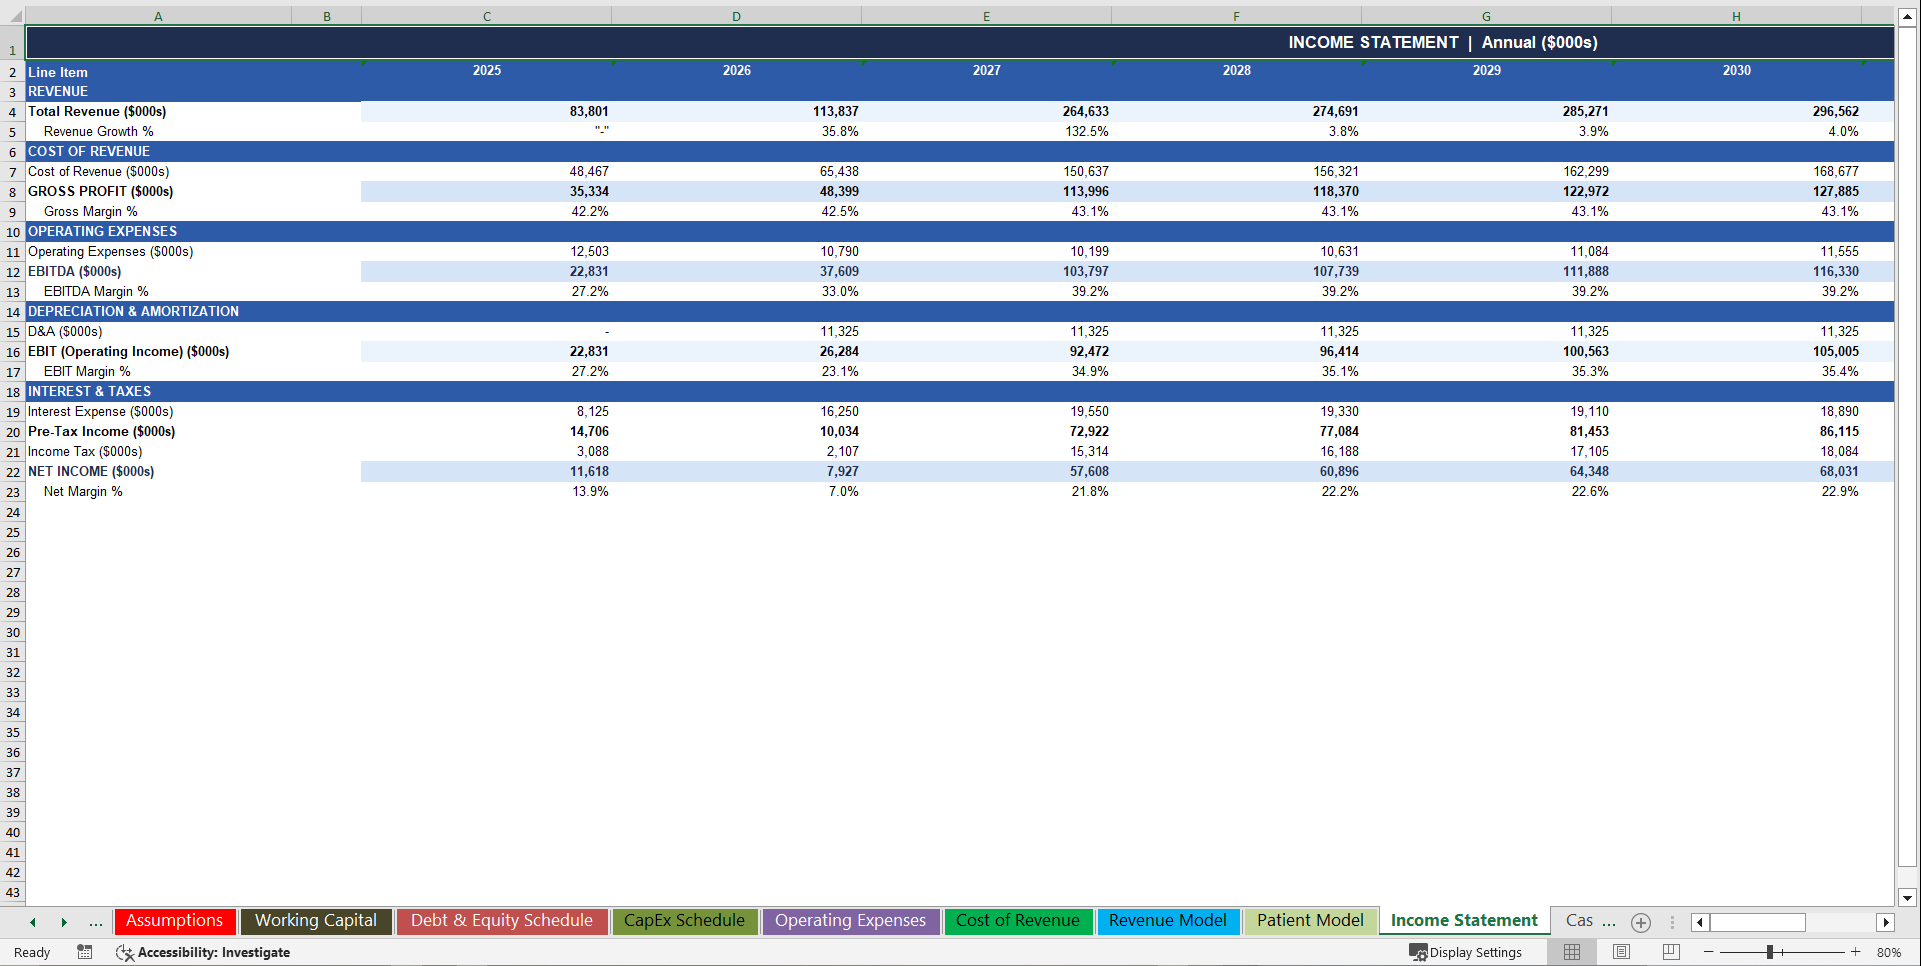
📑 Income Statement
Tracks hospital platform performance from revenue to net income:
• Total Revenue – all six clinical lines aggregated
• Cost of Revenue – all eight direct COGS lines plus equipment maintenance and depreciation
• Gross Profit and Gross Margin %
• Operating Expenses – IT, marketing, G&A, and senior personnel compensation
• EBITDA and EBITDA Margin %
• D&A – straight-line depreciation on all four asset classes
• EBIT (Operating Income)
• Interest Expense – construction loan and term loan interest combined
• Pre-Tax Income
• Income Tax – at a configurable corporate tax rate
• Net Income and Net Margin %
The model reflects a fundamental truth of hospital economics: early years carry high capital costs and low occupancy. Profitability builds rapidly once the bed ramp completes and all service lines reach steady-state utilisation.
💵 Cash Flow Statement (Indirect Method)
Tracks cash movement through three activities:
• Cash from Operations – Net Income, plus D&A add-back, minus change in net working capital
• Cash from Investing – total CapEx outflows concentrated in Years 1 and 2, falling to zero from Year 3
• Cash from Financing – equity raised, construction loan drawdowns, term loan drawdown, debt repayments, and interest paid
Ending cash balance links directly to the balance sheet cash line.
🧾 Balance Sheet
Assets tracked: cash and cash equivalents, accounts receivable, inventory and prepaid expenses, land at cost, buildings at net book value, and medical equipment net of accumulated depreciation.
Liabilities tracked: accounts payable, accrued expenses, and long-term debt outstanding.
Equity tracked: paid-in capital cumulative and retained earnings cumulative.
The balance sheet balances to zero across all 10 years – verified with a built-in balance check row.
📊 Scenario & Sensitivity Analysis
The model includes a full Scenario Analysis module so you can stress-test your hospital plan across five distinct outcomes, all evaluated at Year 5.
The five scenarios are:
• Base Case (Modelled) – the full model as built, reflecting all Assumptions tab inputs
• High Growth (+20% Patients) – 20% uplift on patient volumes with proportional revenue and EBITDA impact
• Low Utilisation (Occ 55%) – occupancy compressed to 55% versus 78% steady state, reflecting a slow ramp
• Cost Inflation Shock (+15% COGS) – cost of revenue increases by 15%, compressing gross margin and EBITDA
• Regulatory Shock (−10% Revenue) – total revenue reduced by 10%, reflecting reimbursement cuts or pricing pressure
Each scenario shows Year 5 Revenue, EBITDA, Net Income, Bed Occupancy, Net Margin, and Cash Balance – giving you a clear view of downside protection and upside potential across different operating conditions.
A Sensitivity Table shows Year 5 Revenue across a matrix of six bed occupancy rates (45%–90%) and five patient growth rates (5%–25%), giving you a direct read of how occupancy and volume assumptions interact to drive the top line.
📈 Executive Dashboard
The Dashboard is the first sheet you open – a complete at-a-glance overview of the hospital platform forecast.
Ten KPI tiles show the key platform metrics at a glance, all pulling live from the model:
• Total Revenue (Year 10)
• EBITDA (Year 10)
• Net Income (Year 10)
• Cash Balance (Year 10)
• Gross Margin % (Year 10)
• EBITDA Margin % (Year 10)
• Net Margin % (Year 10)
• Bed Occupancy Rate (Year 10)
• IPD Admissions (Year 10)
• OPD Visits (Year 10)
Six fully working charts are linked directly to model data and update automatically when any assumption changes:
• Revenue & EBITDA Trend – clustered bar chart showing total revenue and EBITDA side by side across all 10 years
• Patient Volume Trend – line chart showing IPD admissions and OPD visits growing across the forecast
• Margin Trends – line chart showing gross margin % and EBITDA margin % across all 10 years
• Bed Occupancy Rate – line chart showing occupancy building from 45% to 78% and holding at steady state
• CapEx vs Revenue – bar chart illustrating the front-loaded development investment against the growing revenue base
• Net Income Trend – line chart showing net income growing from Year 1 through to Year 10
⚙️ Simple, Professional Input Structure
The model is designed to be immediately usable – no Excel consultant required.
🔵 Blue cells = hardcoded inputs you control
⚫ Black cells = automated formula calculations
🟢 Green cells = cross-sheet links pulling from other tabs
All inputs are centralised in a single Assumptions tab. Change any driver once and it flows through every sheet, every formula, and every chart automatically. The 70+ configurable inputs span every aspect of the model:
General: Forecast start year, inflation rate, corporate tax rate, discount rate / WACC
Hospital Development: Land area and price, licensed beds, area per bed, hard costs per square foot by building type, soft cost %, contingency %, parking levels and spaces
Area Breakdown: Administration (10%), Patient Care & Hospitality (45%), Storage & Supply (8%), Medical Units (37%)
Depreciation Lives: Building (40 years), Medical Equipment (10 years), IT Systems (5 years), Furniture (7 years)
Patient Metrics: Opening and full-capacity bed count, occupancy by year, ALOS, OPD visits per bed, patient growth rates by phase, readmission rate, payer mix percentages
Revenue Rates: Revenue per patient day, per OPD visit, per surgical procedure, per diagnostic episode, per pharmacy day, per physiotherapy session – all individually set; plus ICU and VIP room premium multipliers and annual fee escalation rate
Cost of Revenue: All 8 COGS percentages individually configurable
Operating Expenses: IT Year 1 and annual licence costs, marketing Year 1 and steady-state levels, G&A base and growth rate
Personnel: Base salary for each of the five senior roles; headcount of department heads; salary escalation rate; bonus pool percentage
CapEx: Initial values for medical equipment, IT systems, furniture, and security systems
Financing: Equity contribution, construction loan size and interest rate, term loan size, interest rate and tenor, DSCR target
Working Capital: Accounts receivable days, accounts payable days, inventory / prepaid days
No numbers are hardcoded in the forecast tabs. Every projection derives from the Assumptions sheet.
🏆 Who This Model Is For
Perfect for:
✔ Hospital developers and healthcare real estate investors
✔ Private equity firms evaluating hospital platform acquisitions or build-outs
✔ Emerging healthcare operators building their first or second facility
✔ Family offices and sovereign funds structuring a formal hospital investment
✔ PE-backed hospital management companies modelling platform economics
✔ Investment bankers and advisors preparing hospital platform valuations
✔ CFOs and finance teams at established hospital groups
✔ Fundraising pitches and LP due diligence packages for healthcare funds
✔ Strategic planning for hospital platform build-out and team expansion
If your business involves developing hospital infrastructure, deploying clinical capital, generating revenue from patient services, and scaling a professional healthcare platform, this model provides the complete structured financial planning framework.
📅 13-Sheet Model – Complete Tab Structure
The model delivers a full professional workbook across 13 fully structured, colour-coded sheets.
• Dashboard – 10 KPI tiles and 6 working charts, fully linked to all model data
• Assumptions – single source of truth for all 70+ model inputs
• Patient Model – bed capacity, occupancy, IPD admissions, OPD visits, surgical procedures, physiotherapy sessions, and payer mix
• Revenue Model – IPD (by payer class), OPD, surgery, diagnostics, pharmacy, and physiotherapy – with price escalation factor and revenue mix breakdown
• Cost of Revenue – 8 direct COGS lines as % of revenue, plus equipment maintenance and depreciation; gross profit and gross margin
• Operating Expenses – IT, marketing, G&A, and senior personnel compensation by role with salary escalation and bonus pool
• CapEx Schedule – development and equipment CapEx with full straight-line depreciation across 4 asset classes and net book value tracking
• Debt & Equity Schedule – equity, construction loan (drawdown, interest, repayment), and term loan (drawdown, balance, interest, amortisation)
• Working Capital – accounts receivable, inventory, accounts payable, accrued expenses, net working capital, and change in NWC
• Income Statement – Revenue → Gross Profit → EBITDA → EBIT → Net Income with all margins across 10 years
• Balance Sheet – all assets, liabilities, and equity fully linked; balance check confirmed zero across all 10 years
• Cash Flow Statement – indirect method: CFO, CFI, and CFF fully separated; ending cash balance links directly to balance sheet
• Sensitivity Analysis – five-scenario matrix at Year 5 and occupancy-versus-patient-growth sensitivity table
🚀 Plan the Future of Your Hospital Platform
With the General Hospital Advanced 3-Statement Financial Model, you can finally understand how your bed strategy, development programme, and clinical volume ramp affect revenue, profitability, and cash generation – all in one connected system.
The model correctly captures what makes hospital economics distinctive. Early years carry high capital costs and low occupancy, as the development investment is deployed and the patient ramp begins. Profitability builds rapidly once the full bed complement is operational and occupancy reaches steady state. Peak revenue and cash generation occur in the later years of the forecast as the revenue base compounds through annual fee escalation and the hospital reaches full clinical maturity.
Everything is connected in one institutional-quality financial forecasting framework.
✅ Full hospital development budgeting – land, construction, fit-out, parking, soft costs, and contingency
✅ Patient volume model – beds to occupancy to IPD, OPD, surgical, diagnostics, pharmacy, and physiotherapy
✅ Six-line revenue model with payer discounts, annual escalation, and revenue mix breakdown
✅ Eight-line cost of revenue model with gross margin calculated dynamically
✅ Four-category operating expense model – IT, marketing, G&A, and role-by-role senior compensation
✅ CapEx and straight-line depreciation schedule across four asset classes with net book value tracking
✅ Debt and equity schedule – construction loan, term loan, and equity with full interest and amortisation
✅ Working capital schedule with cash timing and indirect cash flow integration
✅ Full 3-statement model – Income Statement, Balance Sheet, Cash Flow – fully linked and balancing to zero
✅ Five-scenario analysis plus occupancy-versus-growth sensitivity table
✅ Executive dashboard with 6 working charts and 10 KPI tiles
✅ Single Assumptions tab with 70+ inputs controlling the entire model
All inside one structured, professional-grade general hospital financial model – 10-year forecast.
Key Words:
Strategy & Transformation, Growth Strategy, Strategic Planning, Strategy Frameworks, Innovation Management, Pricing Strategy, Core Competencies, Strategy Development, Business Transformation, Marketing Plan Development, Product Strategy, Breakout Strategy, Competitive Advantage, Mission, Vision, Values, Strategy Deployment & Execution, Innovation, Vision Statement, Core Competencies Analysis, Corporate Strategy, Product Launch Strategy, BMI, Blue Ocean Strategy, Breakthrough Strategy, Business Model Innovation, Business Strategy Example, Corporate Transformation, Critical Success Factors, Customer Segmentation, Customer Value Proposition, Distinctive Capabilities, Enterprise Performance Management, KPI, Key Performance Indicators, Market Analysis, Market Entry Example, Market Entry Plan, Market Intelligence, Market Research, Market Segmentation, Market Sizing, Marketing, Michael Porter's Value Chain, Organizational Transformation, Performance Management, Performance Measurement, Platform Strategy, Product Go-to-Market Strategy, Reorganization, Restructuring, SWOT, SWOT Analysis, Service 4.0, Service Strategy, Service Transformation, Strategic Analysis, Strategic Plan Example, Strategy Deployment, Strategy Execution, Strategy Frameworks Compilation, Strategy Methodologies, Strategy Report Example, Value Chain, Value Chain Analysis, Value Innovation, Value Proposition, Vision Statement, Corporate Strategy, Business Development, Business plan pdf, business plan, PDF, Business Plan DOC, Business Plan Template, PPT, Market strategy playbook, strategic market planning, competitive analysis tools, market segmentation frameworks, growth strategy templates, product positioning strategy, market execution toolkit, strategic alignment playbook, KPI and OKR frameworks, business growth strategy guide, cross-functional strategy templates, market risk management, market strategy PowerPoint doc, guide, ebook, e-book ,McKinsey Change Playbook, Organizational change management toolkit, Change management frameworks 2025, Influence model for change, Change leadership strategies, Behavioral change in organizations, Change management PowerPoint templates, Transformational leadership in change, supply chain KPIs, supply chain KPI toolkit, supply chain PowerPoint template, logistics KPIs, procurement KPIs, inventory management KPIs, supply chain performance metrics, manufacturing KPIs, supply chain dashboard, supply chain strategy KPIs, reverse logistics KPIs, sustainability KPIs in supply chain, financial supply chain KPIs, warehouse KPIs, digital supply chain KPIs, 1200 KPIs, supply chain scorecard, KPI examples, supply chain templates, Corporate Finance SOPs, Finance SOP Excel Template, CFO Toolkit, Finance Department Procedures, Financial Planning SOPs, Treasury SOPs, Accounts Payable SOPs, Accounts Receivable SOPs, General Ledger SOPs, Accounting Policies Template, Internal Controls SOPs, Finance Process Standardization, Finance Operating Procedures, Finance Department Excel Template, FP&A Process Documentation, Corporate Finance Template, Finance SOP Toolkit, CFO Process Templates, Accounting SOP Package, Tax Compliance SOPs, Financial Risk Management Procedures.
NOTE: Our digital products are sold on an "as is" basis, making returns and refunds unavailable post-download. Please preview and inquire before purchasing. Please contact us before purchasing if you have any questions! This policy aligns with the standard Flevy Terms of Usage.
Got a question about the product? Email us at support@flevy.com or ask the author directly by using the "Ask the Author a Question" form. If you cannot view the preview above this document description, go here to view the large preview instead.
Source: Best Practices in Healthcare, Integrated Financial Model Excel: General Hospital 10-Year 3 Statement Financial Model Excel (XLSX) Spreadsheet, SB Consulting
ABOUT THE AUTHOR
SB Consulting is dedicated to empowering businesses to communicate their ideas with impact. This consulting firm specializes in teaching organizations how to create effective corporate and management presentations. With training from top-tier global consulting firms, including McKinsey, BCG, and Porsche Consulting, extensive expertise in presentation design and ... [read more]
Ask the Author a Question
You must be logged in to contact the author.
