Want FREE Templates on Digital Transformation? Download our FREE compilation of 50+ slides. This is an exclusive promotion being run on LinkedIn.

Gantt Chart Simple Model   Excel template (XLSM)
$20.00

Gantt Chart Simple Model (Excel template (XLSM)) Preview Image Gantt Chart Simple Model (Excel template (XLSM)) Preview Image Gantt Chart Simple Model (Excel template (XLSM)) Preview Image Gantt Chart Simple Model (Excel template (XLSM)) Preview Image Gantt Chart Simple Model (Excel template (XLSM)) Preview Image Gantt Chart Simple Model (Excel template (XLSM)) Preview Image
Arrow   Unlock all preview images:   Login Register

Gantt Chart Simple Model (Excel XLSM)

File Type: Excel template (XLSM)
Secondary File: Excel (XLSM)

$20.00
Created by a certified Financial Modeler with 10 years+ of experience, including work with KPMG, McKinsey, and Deloitte, and managing $250MM+ in corporate finances. My goal is to provide institutional quality templates and analysis.
Add to Cart


BUY WITH CONFIDENCE

Immediate digital download upon purchase.
Lifetime document updates included with purchase.
Fully editable & customizable XLSM document.
Supplemental XLSM document also included.
Trusted by over 10,000+ organizations.

BENEFITS OF DOCUMENT

  1. Gantt Chart
  2. Project Manager Gant Chart
  3. Corporate Project communications

DESCRIPTION

This product (Gantt Chart Simple Model) is an Excel template (XLSM) with a supplemental Excel document, which you can download immediately upon purchase.

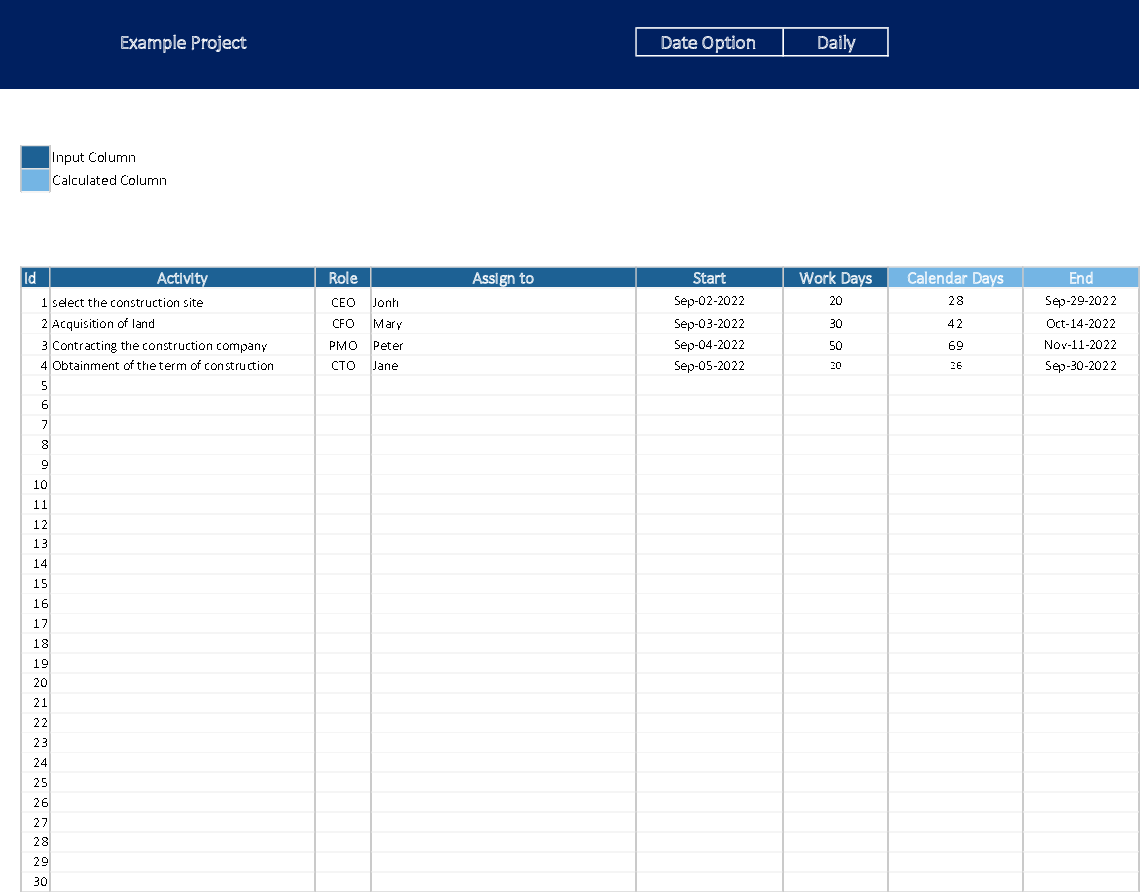
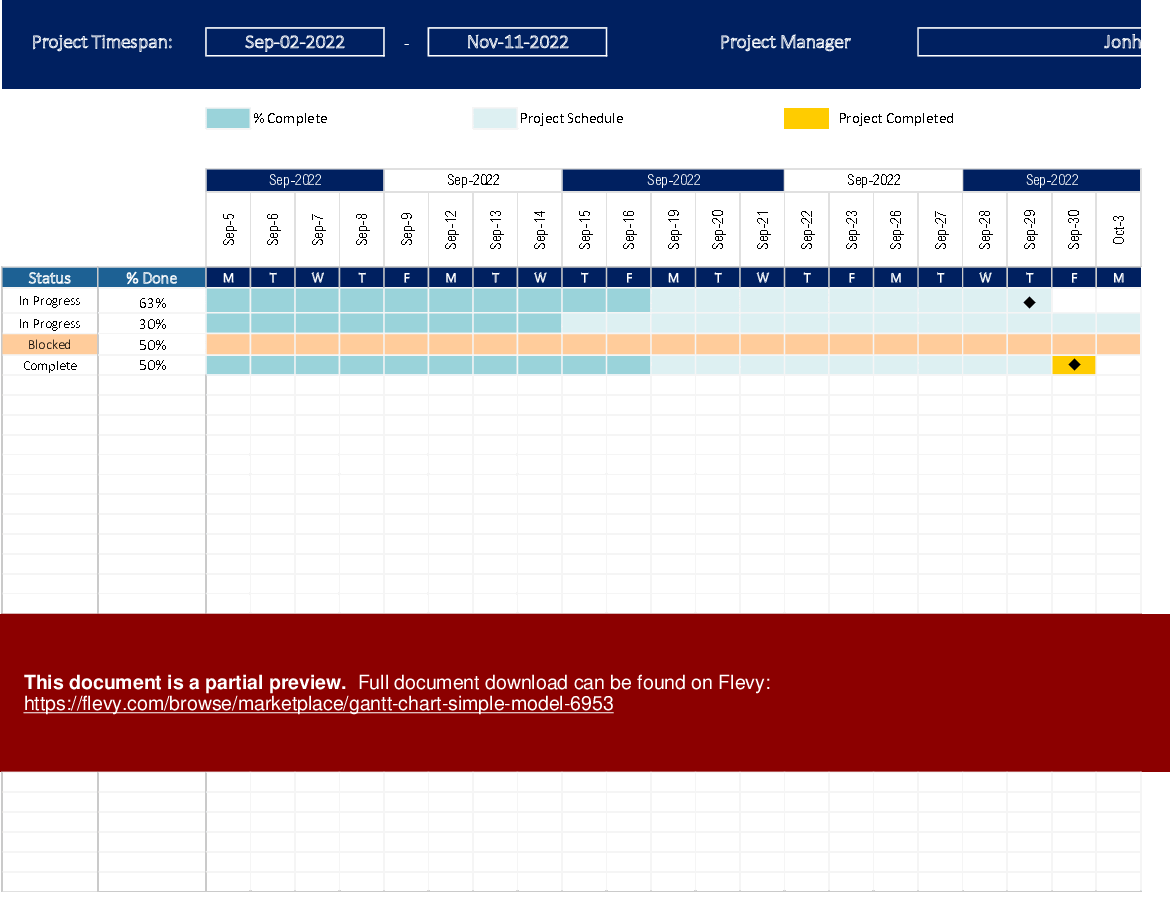
This model is easy to use, customizable Gantt Chart template. Help track project goals and timelines. Useful for home, school, or business projects, with nice features such as the possibility to toggle between daily and weekly view

A Gantt chart is a project management tool used to plan and track tasks over a period of time. It is a type of bar chart that provides a visual representation of a project schedule. The chart illustrates the start and end dates of each task within a project, showing their duration and dependencies.

Gantt charts were first developed by Henry Gantt in the early 1900s as a way to visualize production schedules in factories. Today, they are used in a wide range of industries, including construction, software development, event planning, and marketing.

The chart consists of horizontal bars representing each task or activity, with the length of the bar representing the duration of the task. The bars are arranged along a time axis, which shows the timeline of the project. Gantt charts can also include additional information, such as task dependencies, milestones, and resources allocated to each task.

One of the main benefits of Gantt charts is that they allow project managers to see the entire project schedule at a glance. This enables them to identify potential scheduling conflicts, dependencies, and delays before they become major issues. Gantt charts also make it easy to track progress and make adjustments to the project schedule as needed.

Another advantage of Gantt charts is that they provide a clear visual representation of the project plan. This can be helpful when communicating with stakeholders, team members, and other project participants. Gantt charts can be used to create reports and presentations that show the status of the project, highlighting areas of success and areas that require attention.
n conclusion, Gantt charts are a valuable tool for project managers who need to plan, schedule, and track tasks over a period of time. They provide a visual representation of the project schedule, enabling project managers to identify potential issues and make adjustments as needed. With the help of Gantt charts, project managers can ensure that their projects are completed on time and within budget.

Got a question about the product? Email us at support@flevy.com or ask the author directly by using the "Ask the Author a Question" form. If you cannot view the preview above this document description, go here to view the large preview instead.

Source: Best Practices in Gantt Chart Templates Excel: Gantt Chart Simple Model Excel (XLSM) Spreadsheet, Jair Almeida


$20.00
Created by a certified Financial Modeler with 10 years+ of experience, including work with KPMG, McKinsey, and Deloitte, and managing $250MM+ in corporate finances. My goal is to provide institutional quality templates and analysis.
Add to Cart
  

OVERVIEW

File Type: Excel xlsm (XLSM)
Secondary File: Excel xlsm (XLSM)
File Size: 61.9 KB

ABOUT THE AUTHOR

Author: Jair Almeida
Additional documents from author: 48

Working as a business controller, I am used to producing reports for management, analyzing performance indicators, and developing comparative analyses in terms of pricing and commercial offers. I'm always looking for creative ways to exceed expectations and deliver top-quality management information in order to identify what drives businesses.

Ask the Author a Question

Must be logged in

Did you know?
The average daily rate of a McKinsey consultant is $6,625 (not including expenses). The average price of a Flevy document is $65.


Trusted by over 10,000+ Client Organizations
Since 2012, we have provided best practices to over 10,000 businesses and organizations of all sizes, from startups and small businesses to the Fortune 100, in over 130 countries.
AT&T GE Cisco Intel IBM Coke Dell Toyota HP Nike Samsung Microsoft Astrazeneca JP Morgan KPMG Walgreens Walmart 3M Kaiser Oracle SAP Google E&Y Volvo Bosch Merck Fedex Shell Amgen Eli Lilly Roche AIG Abbott Amazon PwC T-Mobile Broadcom Bayer Pearson Titleist ConEd Pfizer NTT Data Schwab


Read Customer Testimonials


Customers Also Like These Documents

Related Management Topics


Gantt Chart Templates Project Management Information Technology RACI Project Planning Workbook Calendar PRINCE2 Scheduling Cloud

Download our FREE Strategy & Transformation Framework Templates

Download our free compilation of 50+ Strategy & Transformation slides and templates. Frameworks include McKinsey 7-S Strategy Model, Balanced Scorecard, Disruptive Innovation, BCG Experience Curve, and many more.