Data Analytics Services Financial Model   Excel template (XLSX)
$80.00

Data Analytics Services Financial Model (Excel template (XLSX)) Preview Image
Log in to unlock full preview.
Data Analytics Services Financial Model (Excel template (XLSX)) Preview Image
Arrow   Click main image to view in full screen.

Data Analytics Services Financial Model (Excel XLSX)

Excel (XLSX)

$80.00
A comprehensive editable, MS Excel spreadsheet for tracking Data Analytics services company finances, including yearly Online and Offline Marketing % Opportunities and development, Cash Flows, Income Statements, Balance Sheets.
Add to Cart


Immediate download
Fully editable Excel
Free lifetime updates

BENEFITS OF DOCUMENT

  1. Provides thorough oversight, tracking, and reporting of Data Analytics company finances, including updates on budget utilisation and projections.
  2. Eliminates the need to create project finance trackers from scratch and includes all common Data Analytics company actual and projection components.

DESCRIPTION

This product (Data Analytics Services Financial Model) is an Excel template (XLSX), which you can download immediately upon purchase.

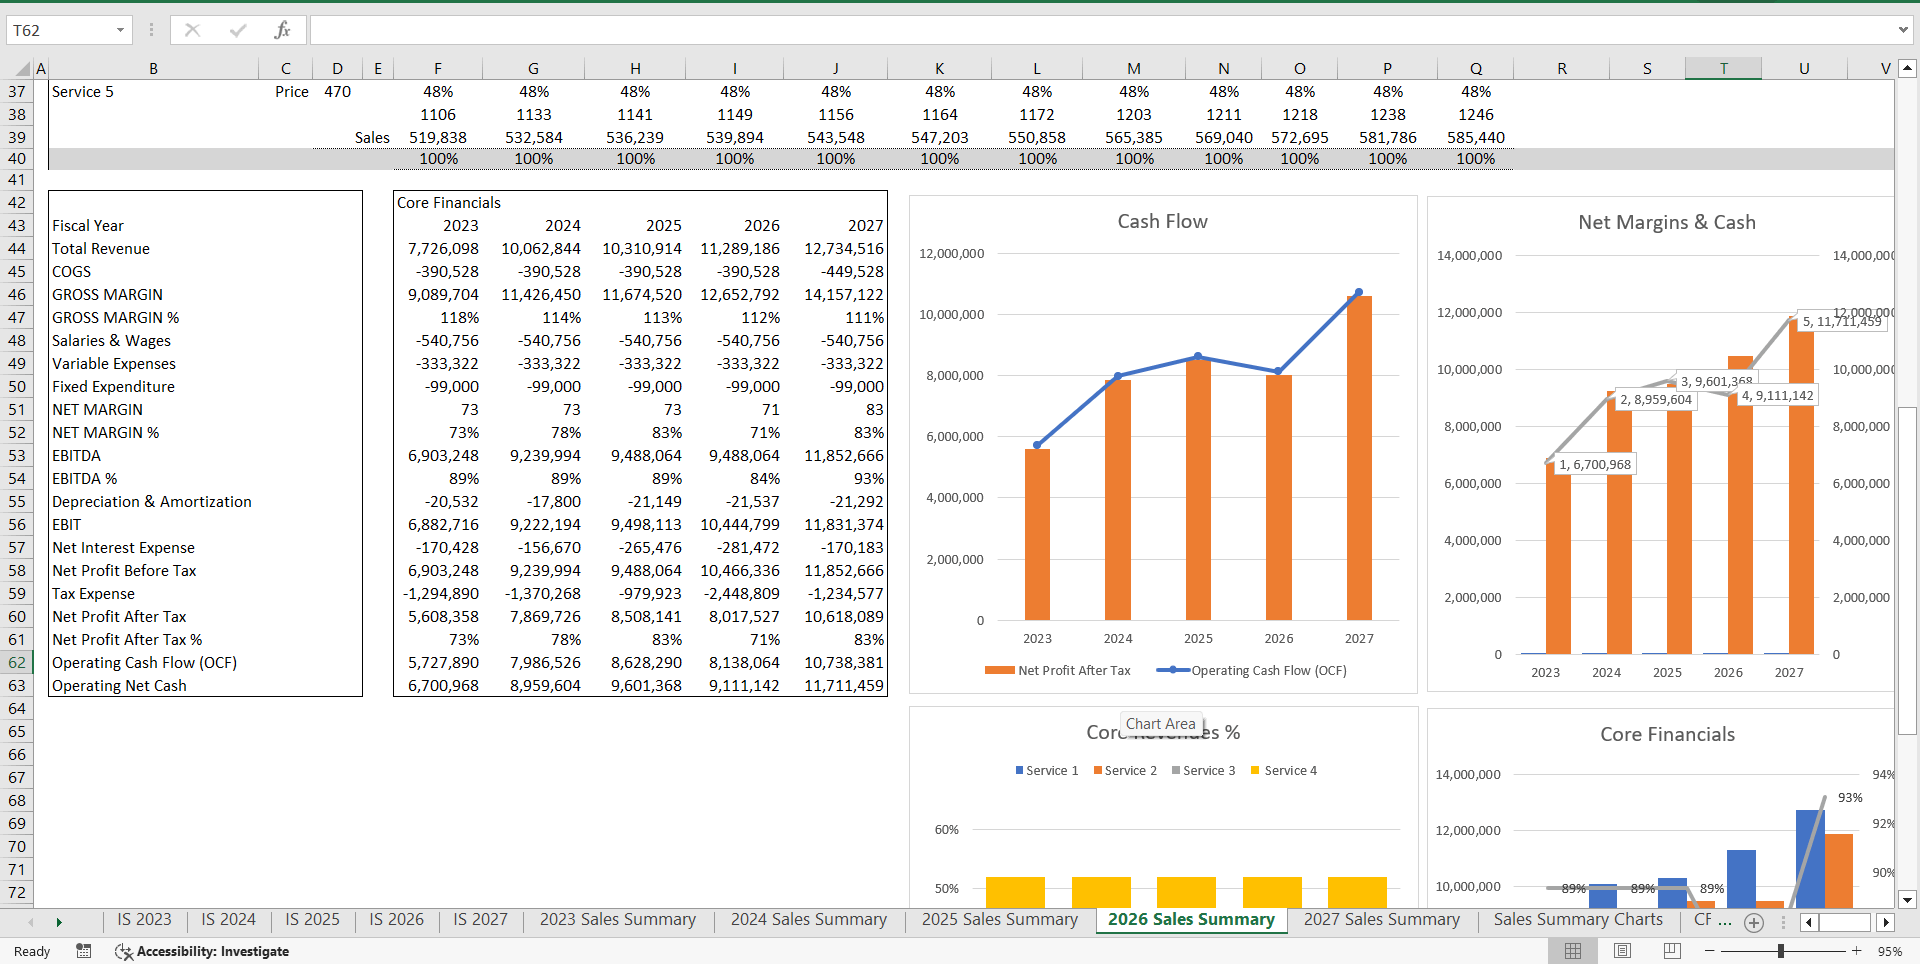
This 3-statement financial model for data analytics and consultancy companies is a comprehensive tool used to forecast a company's future financial performance by integrating its income statement, balance sheet, and cash flow statement.

Benefits of MRR Subscription service:
Flexibility: Teams in different regions can work around the clock, leveraging the expertise of team members during their peak hours.
Scalability: The flexibility in scaling resources aligns with non-traditional workflows
Cost-effectiveness: Customers only pay for the result, without the need to assemble a team, pick technologies, or pay for idle time or overtime.

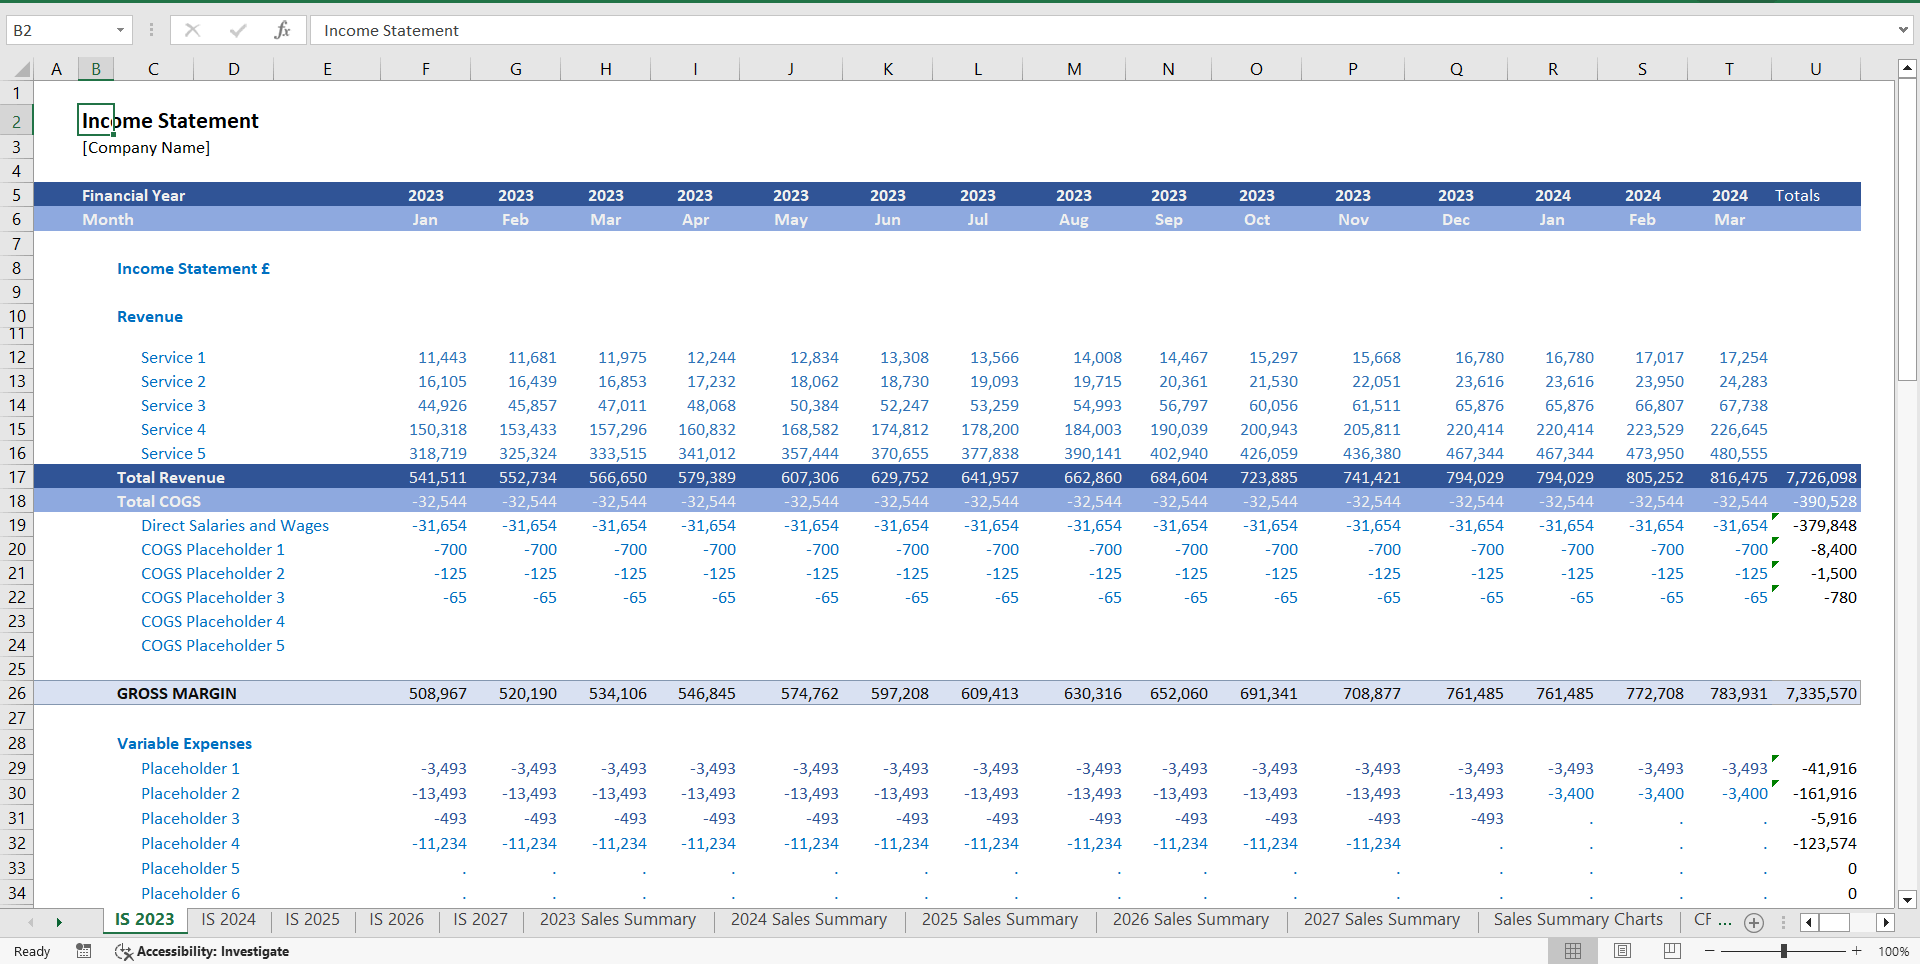
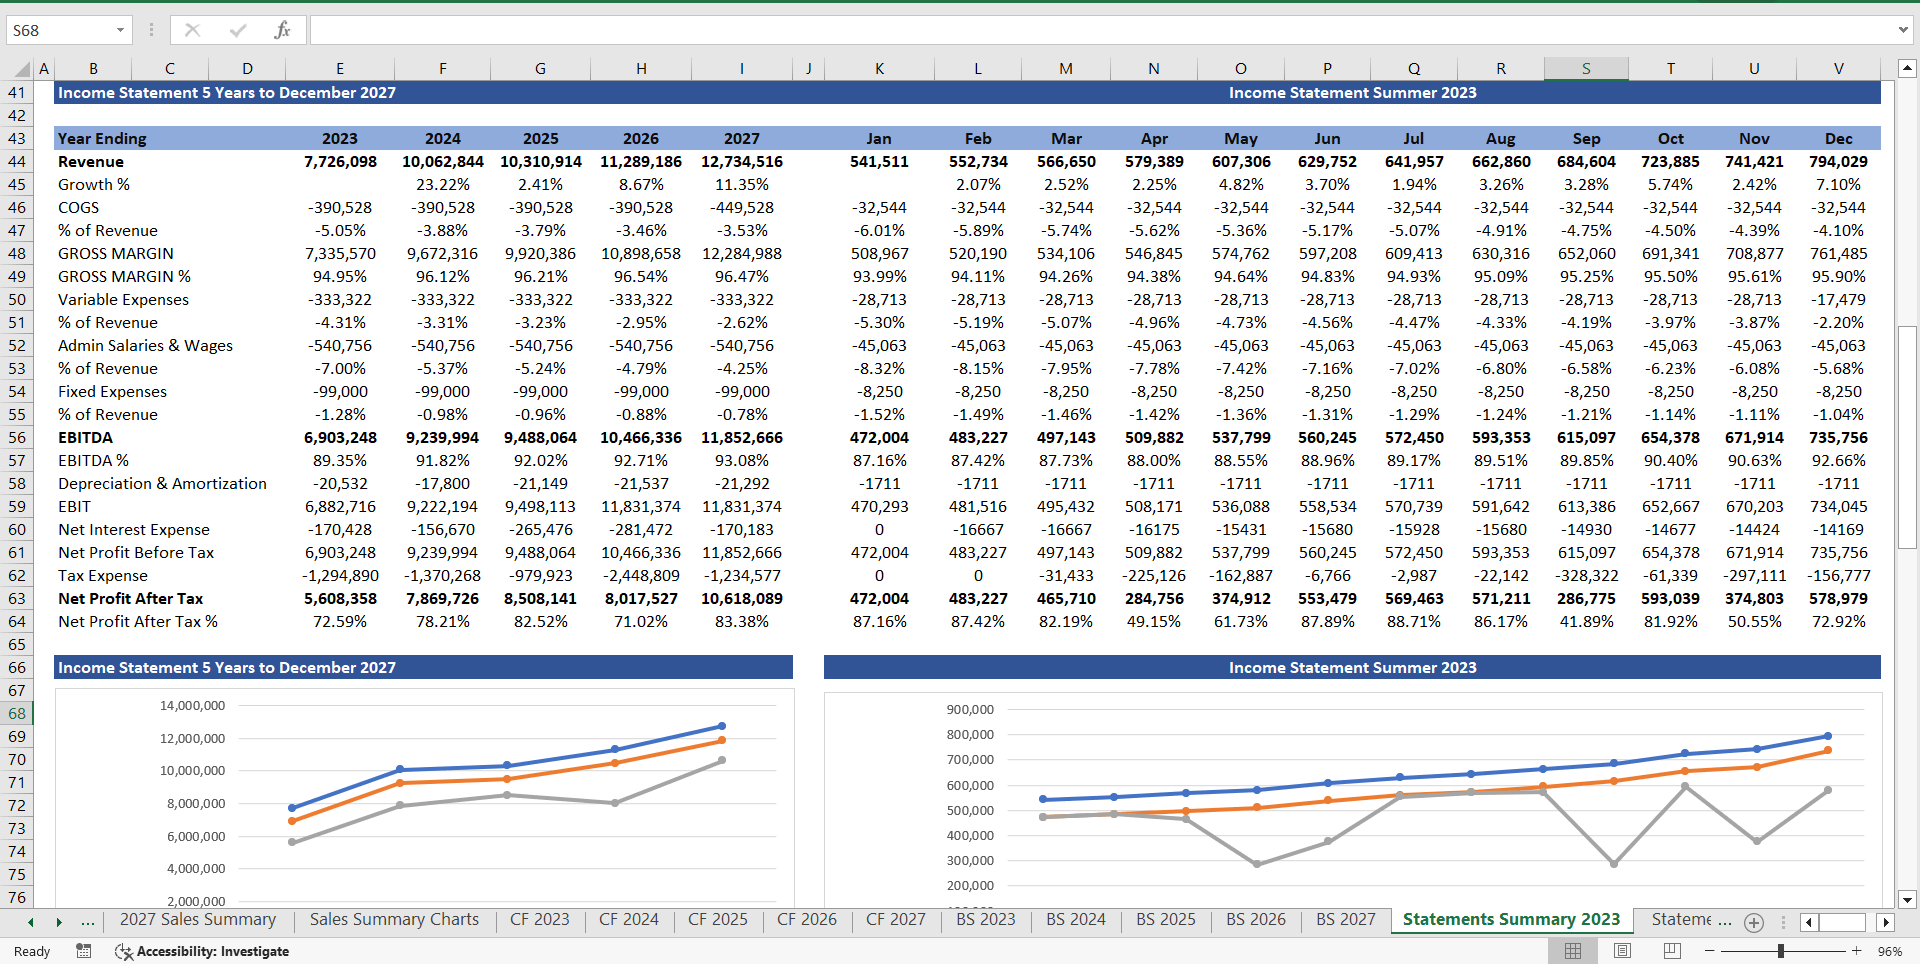
1. Income Statement:
The income statement, also known as the profit and loss (P&L) statement, summarizes a company's revenues, expenses, and profits over a specific period, typically quarterly or annually.
In the context of a data analytics finance model, the income statement may include:
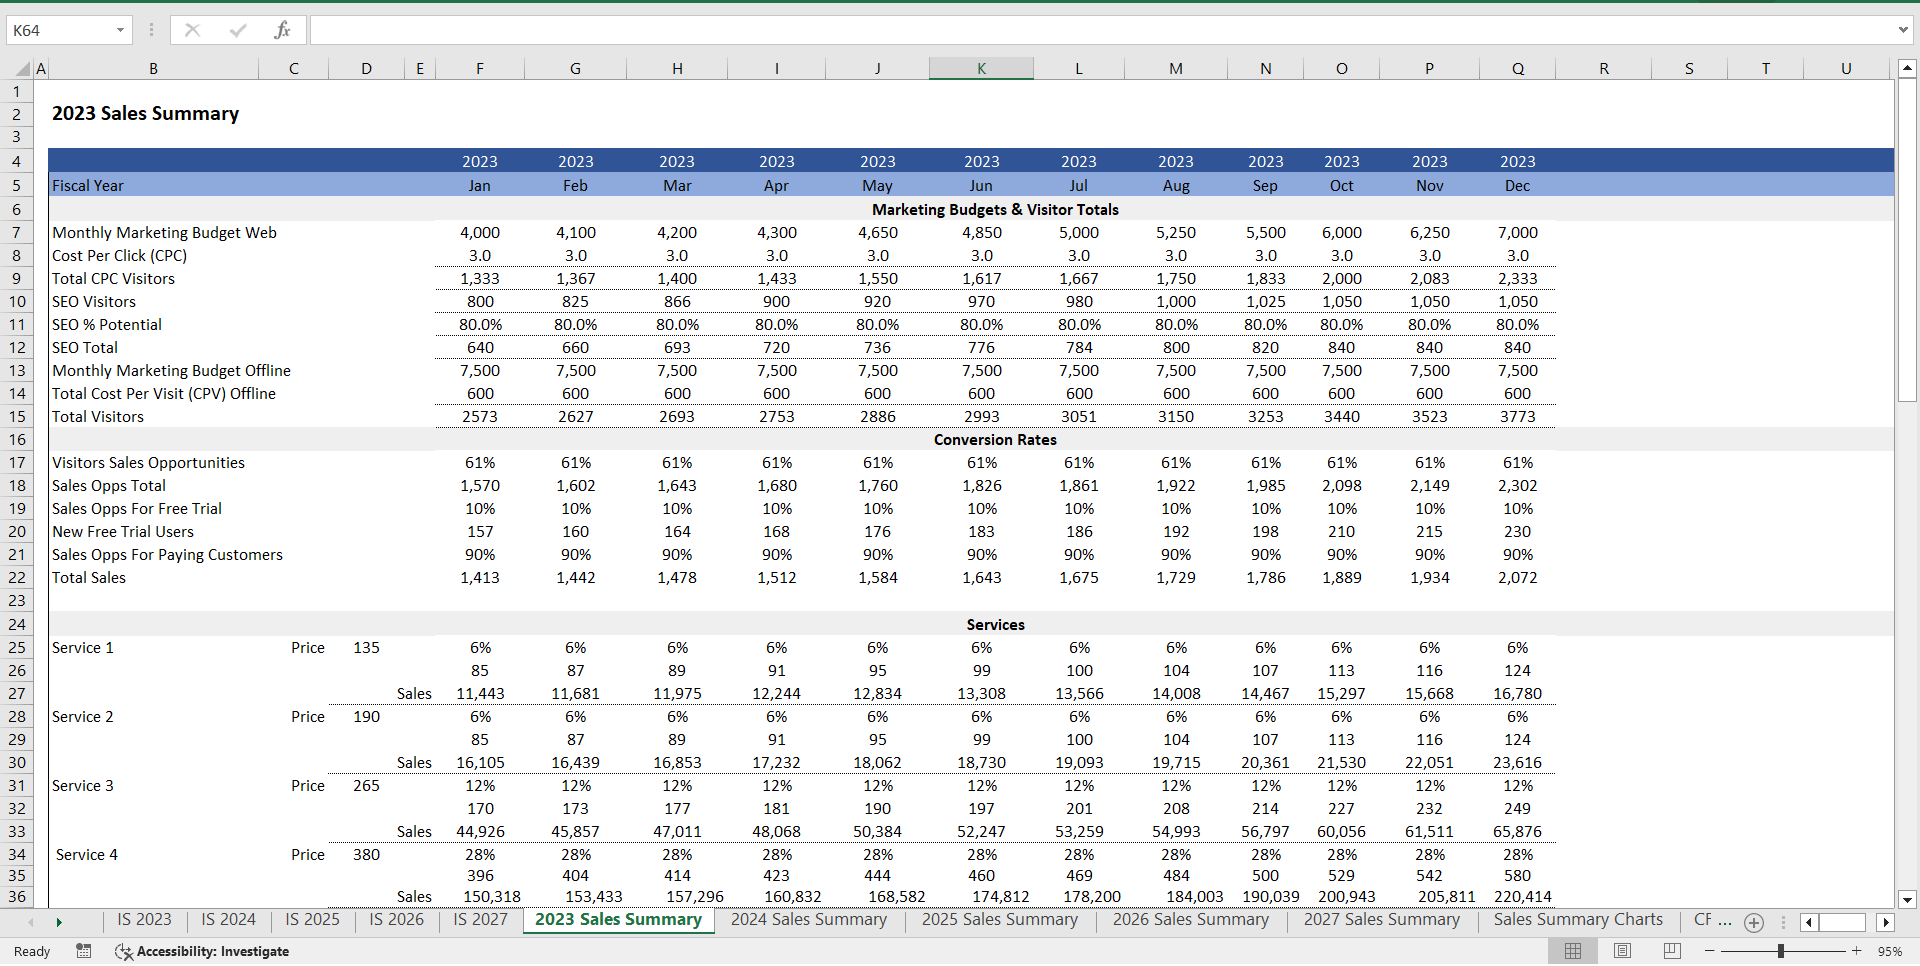
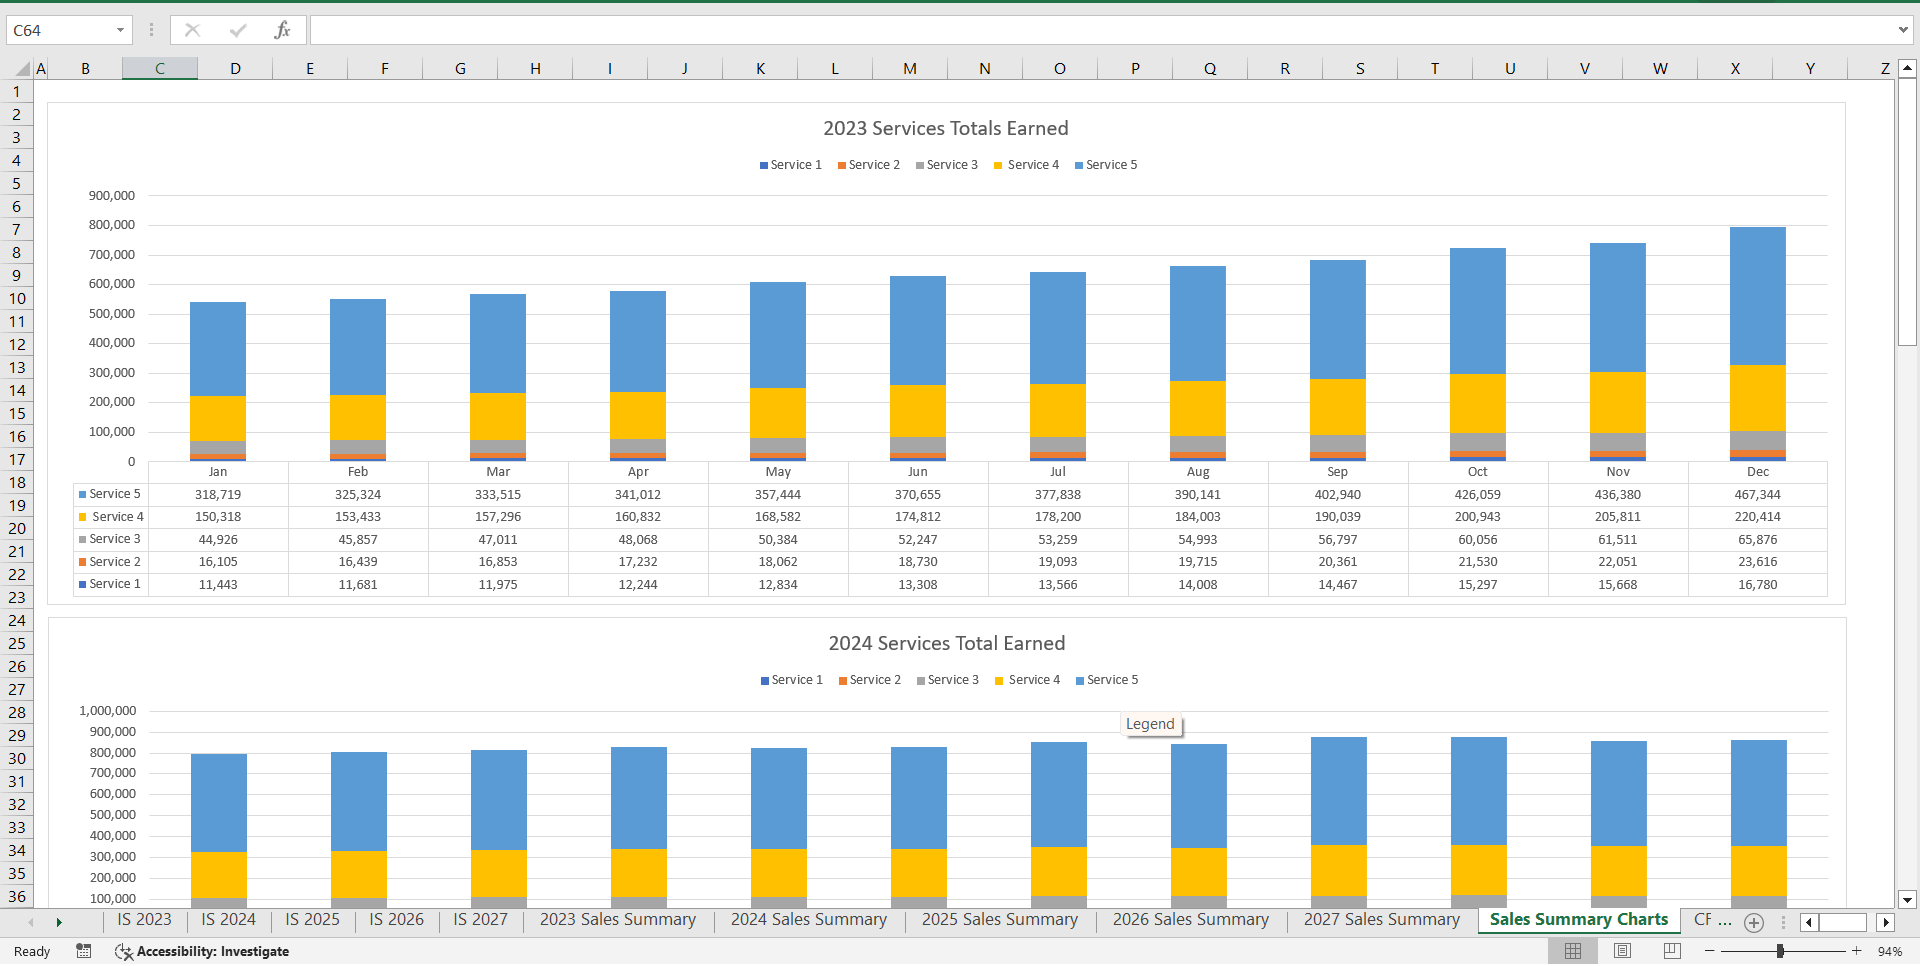
Revenue Forecasting: Utilize historical sales data and market trends to project future revenue streams. This can involve analyzing customer demographics, product performance, and pricing strategies.
Expense Projection: Estimate various operating expenses such as salaries, marketing costs, research and development expenses, and other overhead costs. Data analytics techniques can help identify cost-saving opportunities and optimize spending patterns.
Profit Margin Analysis: Calculate gross profit margin, operating profit margin, and net profit margin to assess the company's profitability. Data analytics can uncover insights into factors influencing profit margins and help optimize pricing strategies or cost structures.
Income Tax Calculation: Estimate income taxes based on projected taxable income and applicable tax rates. Analyze tax implications of different scenarios and tax planning strategies using data analytics.
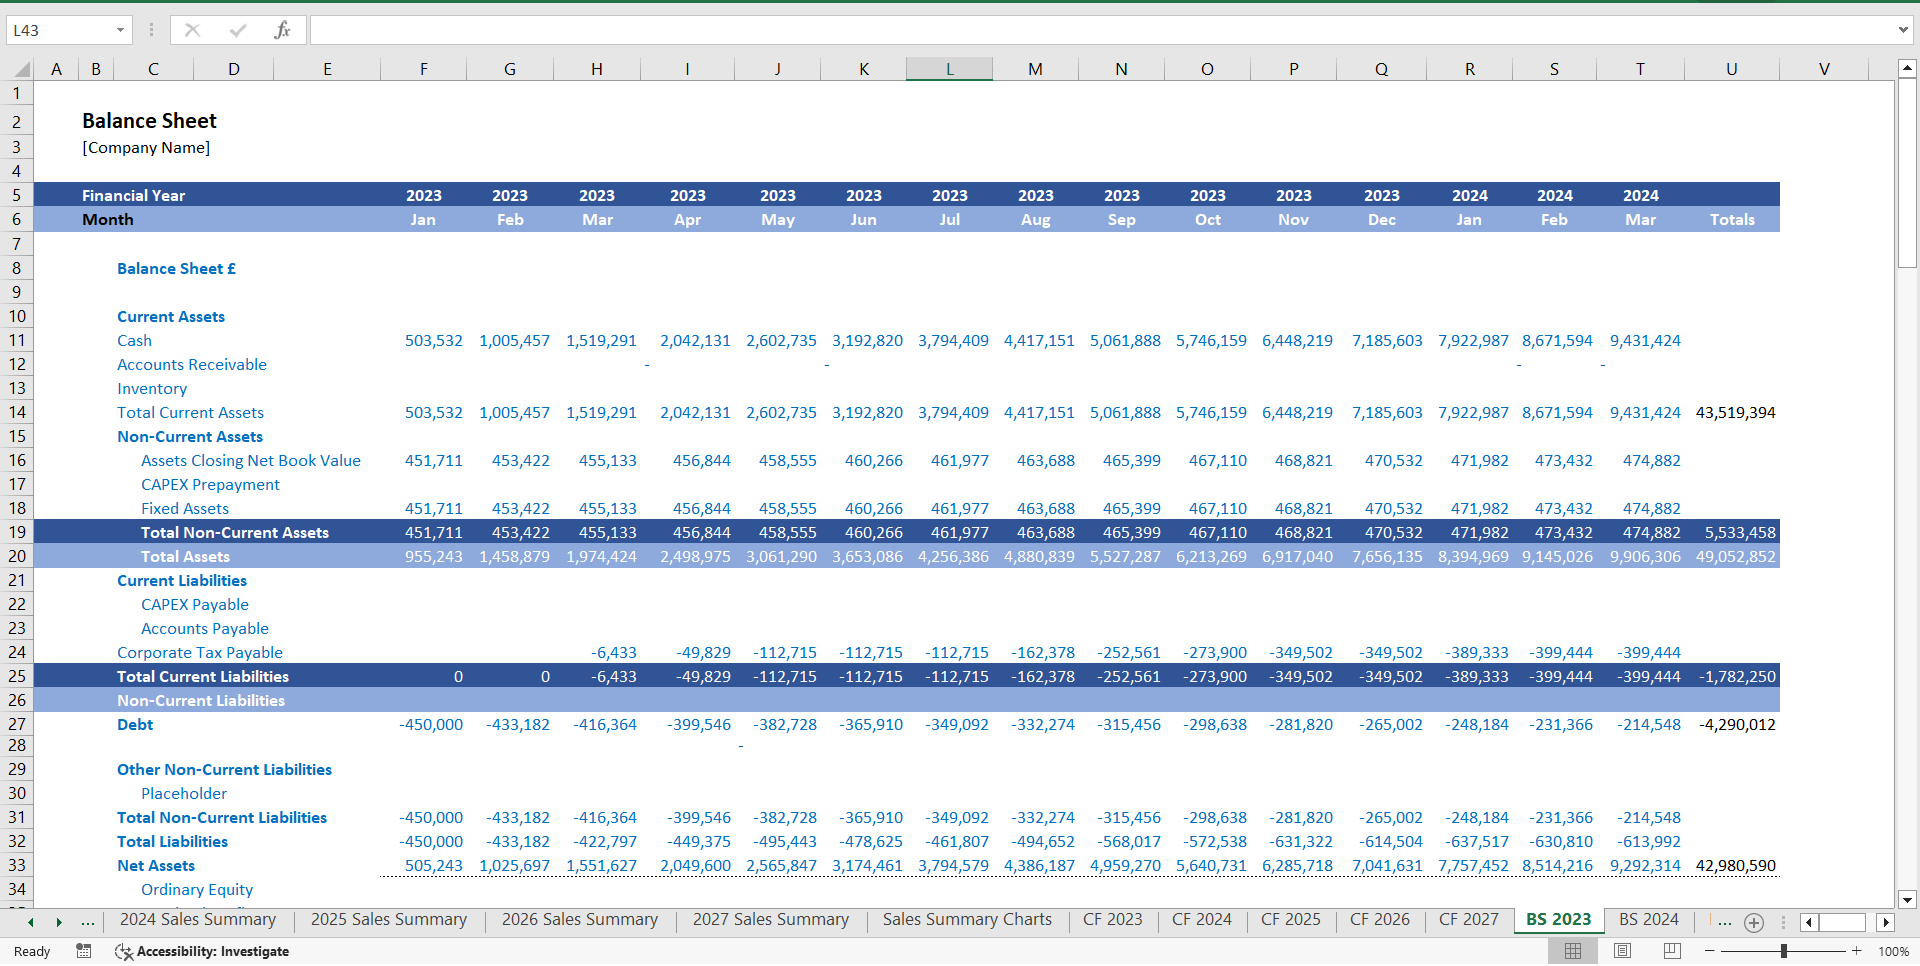
2. Balance Sheet:
The balance sheet provides a snapshot of a company's financial position at a specific point in time, showing its assets, liabilities, and shareholders' equity.
In a data analytics finance model, the balance sheet may include:
Asset Forecasting: Predict future asset levels such as cash, accounts receivable, inventory, and property, plant, and equipment (PP&E) based on historical trends and business projections. Data analytics can help optimize inventory management and asset utilization.
Liability Projection: Estimate liabilities such as accounts payable, accrued expenses, short-term and long-term debt. Analyze payment patterns and debt repayment schedules to effectively manage liquidity and debt levels.
Equity Analysis: Calculate shareholders' equity by considering retained earnings, additional paid-in capital, and other equity components. Data analytics can assist in analyzing shareholder value creation and optimizing capital structure decisions.
Working Capital Management: Evaluate working capital levels by comparing current assets to current liabilities. Use data analytics to optimize cash flow management, minimize working capital requirements, and improve liquidity.

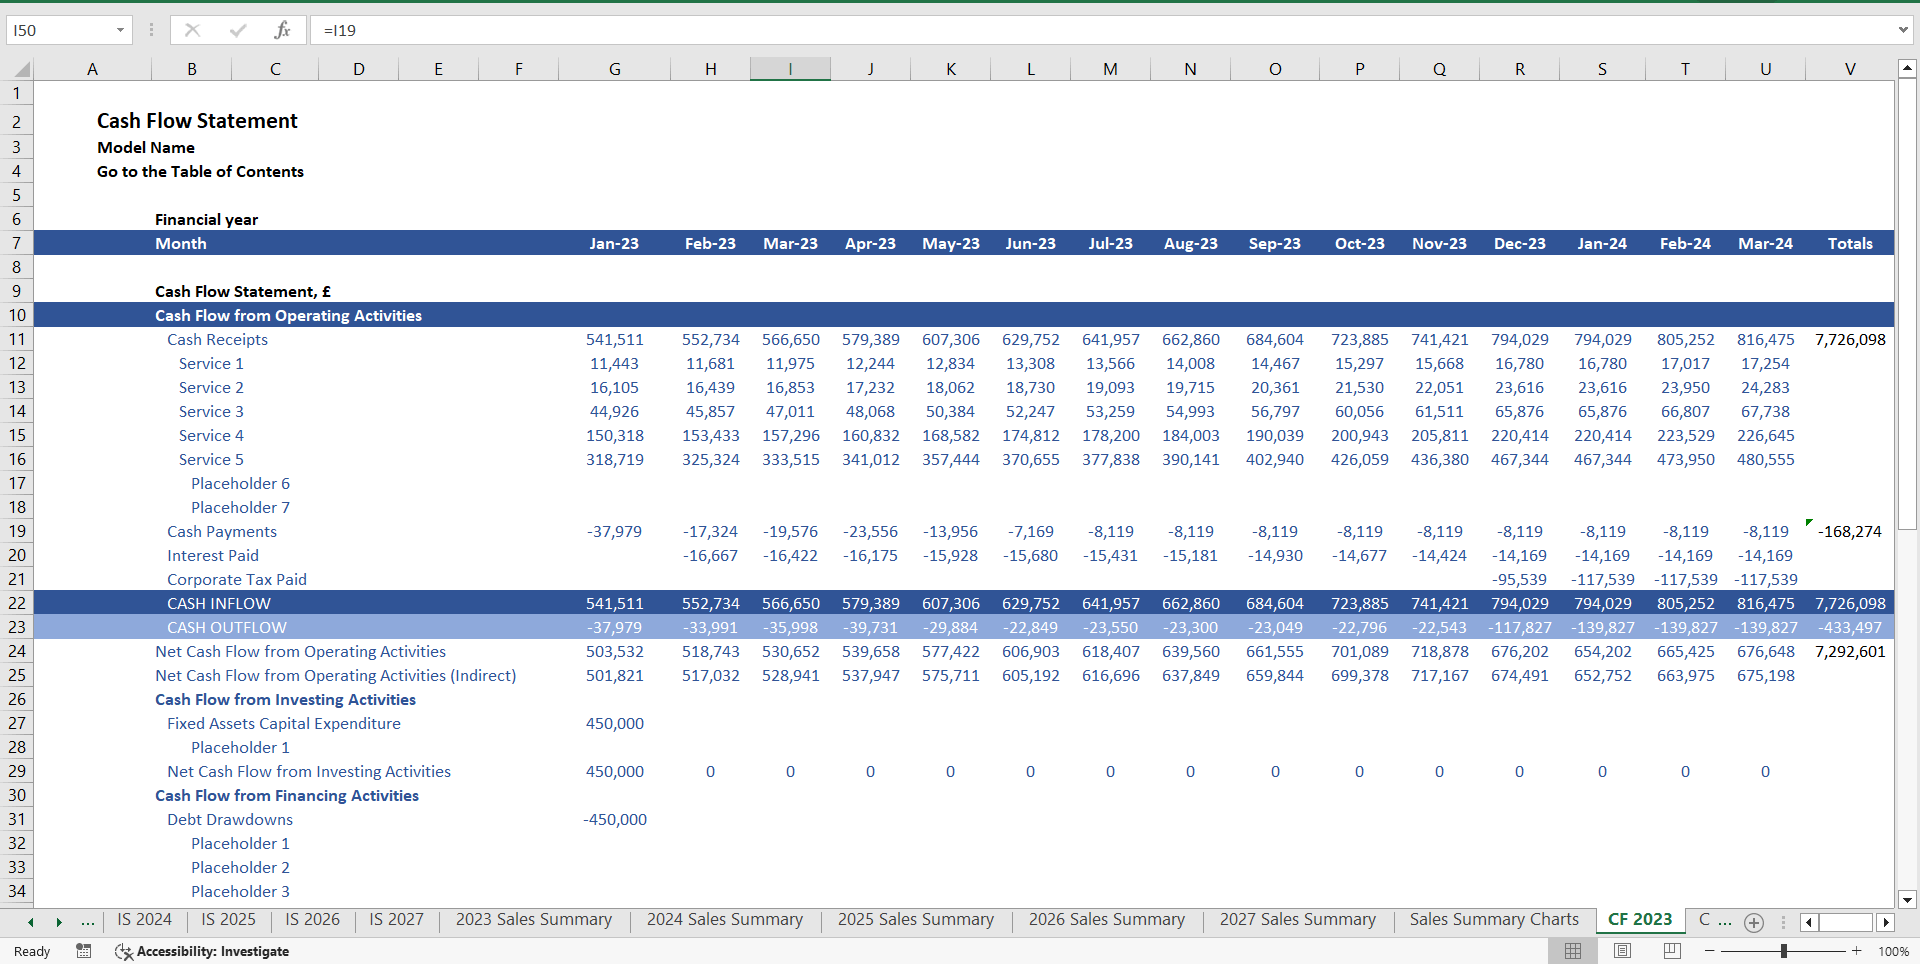
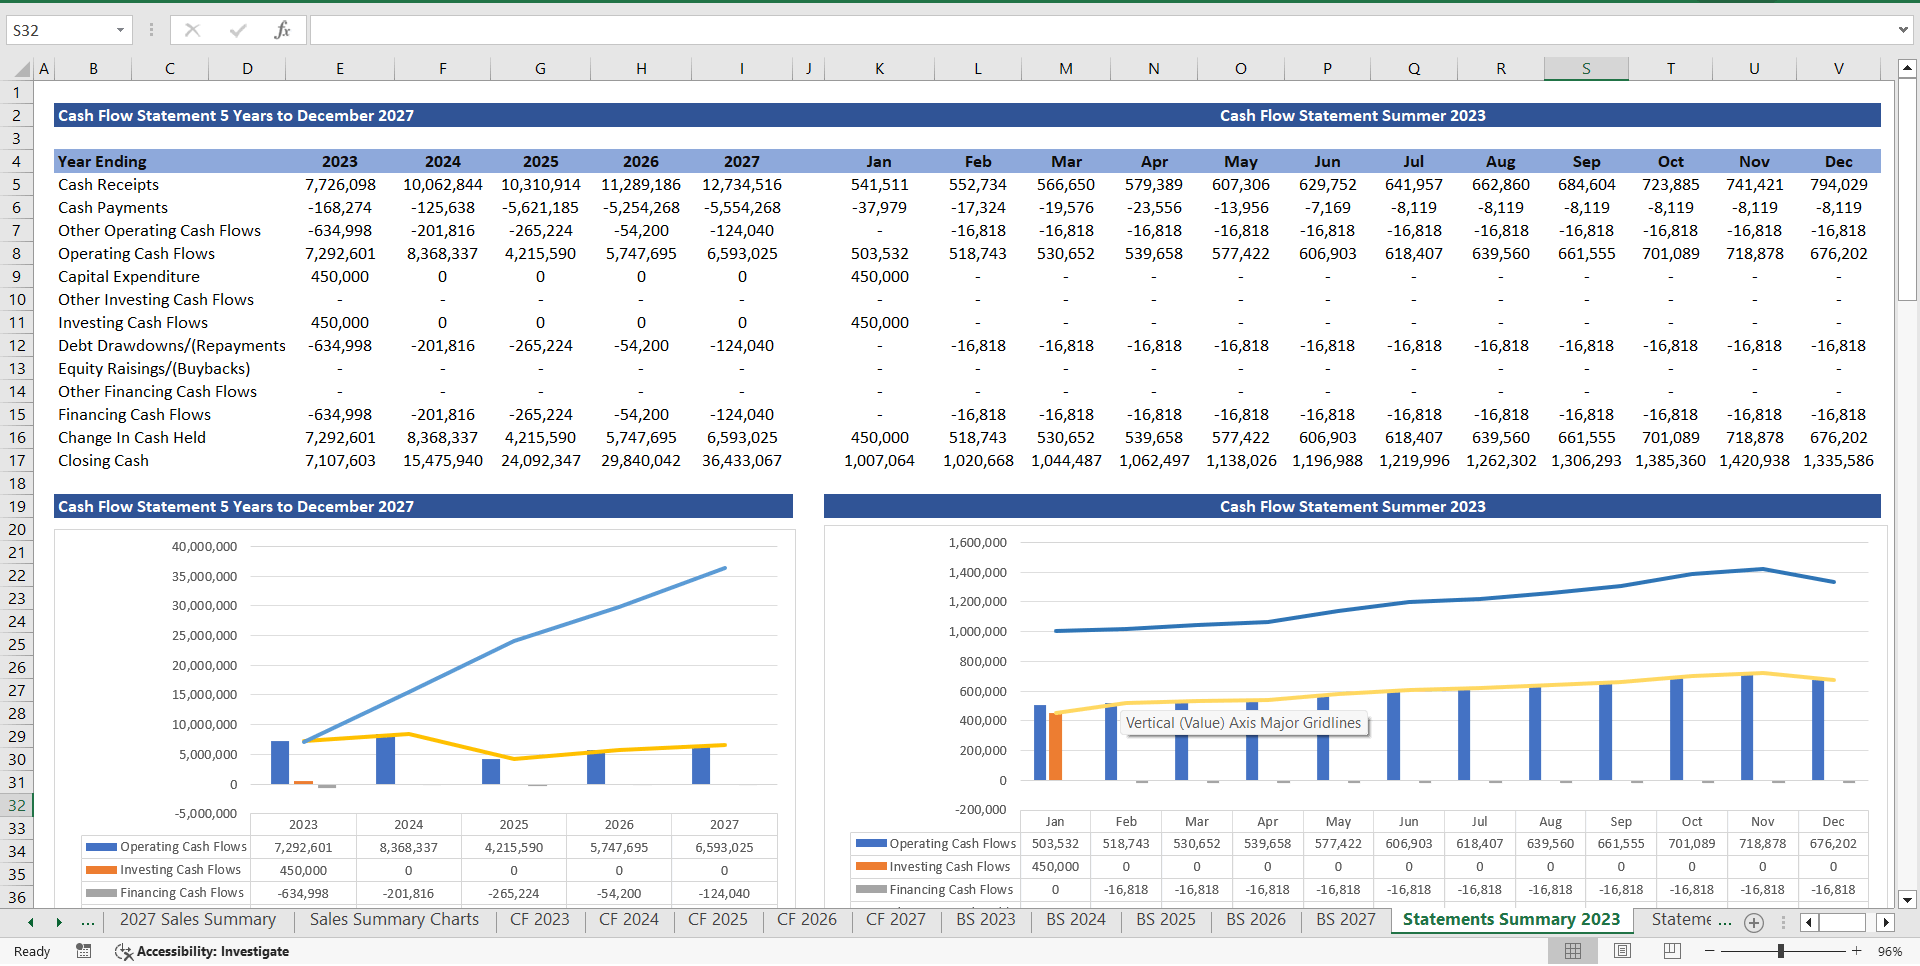
3. Cash Flow Statement:
The cash flow statement tracks the flow of cash into and out of a company during a specific period, categorizing cash flows into operating, investing, and financing activities.
In a data analytics finance model, the cash flow statement may involve:
Operating Cash Flow Forecasting: Predict cash inflows and outflows from core business operations, considering factors such as sales revenue, operating expenses, and changes in working capital. Analyze cash conversion cycles and operating efficiency using data analytics.
Investing Cash Flow Analysis: Evaluate cash flows related to investments in property, plant, and equipment, acquisitions, and divestitures. Use data analytics to assess the return on investment (ROI) of capital expenditures and identify value-enhancing investment opportunities.
Financing Cash Flow Projection: Forecast cash flows from financing activities such as debt issuance, equity financing, dividend payments, and share repurchases. Analyze capital structure decisions and financing alternatives using data analytics techniques.


4. MRR Subscription Revenue
Tracking Focuses on tracking the recurring revenue that forms the backbone of a subscription-based business.
Monthly Recurring Revenue (MRR): Total monthly revenue generated from active subscriptions.
MRR = (Number of subscribers in each tier × Tier price).
Annual Recurring Revenue (ARR):
Total expected revenue over a year from recurring subscriptions.
ARR = MRR × 12.
Metrics to Monitor
Subscriber Growth Rate:
(New Subscribers – Cancellations) / Starting Subscribers.
Churn Rate:
(Number of Cancellations / Starting Subscribers).
Lifetime Value (LTV):
Average Revenue Per User (ARPU) × Average Subscriber Lifetime.
Customer Acquisition Cost (CAC):
Total Sales & Marketing Costs / Number of New Subscribers.
LTV/CAC Ratio:
Indicates the ROI on customer acquisition.
Dashboard ComponentsMRR by Tier:
Breakdown of MRR across different subscription plans (e.g., Basic, Standard, Premium).
MRR Growth:
Month-over-month MRR change percentage.
Churn Analysis:
Identify patterns or reasons for subscriber cancellations.
ARR Projections:
Forecast ARR based on historical MRR trends and growth rates.


A 5-year 3-statement financial model for data analytics provides a holistic view of a company's financial performance, enabling stakeholders to make informed decisions, assess risks, and develop strategic plans. By leveraging data analytics tools and techniques, organizations can enhance the accuracy and reliability of their financial forecasts and drive sustainable growth and profitability.
Provides thorough oversight, tracking, and reporting of Data Analytics finances, including updates on budget utilisation and projections.

Got a question about the product? Email us at support@flevy.com or ask the author directly by using the "Ask the Author a Question" form. If you cannot view the preview above this document description, go here to view the large preview instead.

Source: Best Practices in Integrated Financial Model Excel: Data Analytics Services Financial Model Excel (XLSX) Spreadsheet, Willcox PMO


$80.00
A comprehensive editable, MS Excel spreadsheet for tracking Data Analytics services company finances, including yearly Online and Offline Marketing % Opportunities and development, Cash Flows, Income Statements, Balance Sheets.
Add to Cart
  

ABOUT THE AUTHOR

Author: Willcox PMO
Additional documents from author: 62

As a senior Project Manager at Willcox PMO I oversee all functions relating to the development of the company, and as a previous network architect at Cisco; I also oversee all aspects of the company's IT development. Additionally, I'm responsible for overseeing the strategic direction and planning of all the company activities in order to achieve our company project development goals while ... [read more]

Ask the Author a Question

Must be logged in

Did you know?
The average daily rate of a McKinsey consultant is $6,625 (not including expenses). The average price of a Flevy document is $65.


Trusted by over 10,000+ Client Organizations
Since 2012, we have provided best practices to over 10,000 businesses and organizations of all sizes, from startups and small businesses to the Fortune 100, in over 130 countries.
AT&T GE Cisco Intel IBM Coke Dell Toyota HP Nike Samsung Microsoft Astrazeneca JP Morgan KPMG Walgreens Walmart 3M Kaiser Oracle SAP Google E&Y Volvo Bosch Merck Fedex Shell Amgen Eli Lilly Roche AIG Abbott Amazon PwC T-Mobile Broadcom Bayer Pearson Titleist ConEd Pfizer NTT Data Schwab


Read Customer Testimonials

 
"I am extremely grateful for the proactiveness and eagerness to help and I would gladly recommend the Flevy team if you are looking for data and toolkits to help you work through business solutions."

– Trevor Booth, Partner, Fast Forward Consulting
 
"As a young consulting firm, requests for input from clients vary and it's sometimes impossible to provide expert solutions across a broad spectrum of requirements. That was before I discovered Flevy.com.

Through subscription to this invaluable site of a plethora of topics that are key and crucial to consulting, I "

– Nishi Singh, Strategist and MD at NSP Consultants
 
"As a niche strategic consulting firm, Flevy and FlevyPro frameworks and documents are an on-going reference to help us structure our findings and recommendations to our clients as well as improve their clarity, strength, and visual power. For us, it is an invaluable resource to increase our impact and value."

– David Coloma, Consulting Area Manager at Cynertia Consulting
 
"Last Sunday morning, I was diligently working on an important presentation for a client and found myself in need of additional content and suitable templates for various types of graphics. Flevy.com proved to be a treasure trove for both content and design at a reasonable price, considering the time I "

– M. E., Chief Commercial Officer, International Logistics Service Provider
 
"Flevy.com has proven to be an invaluable resource library to our Independent Management Consultancy, supporting and enabling us to better serve our enterprise clients.

The value derived from our [FlevyPro] subscription in terms of the business it has helped to gain far exceeds the investment made, making a subscription a no-brainer for any growing consultancy – or in-house strategy team."

– Dean Carlton, Chief Transformation Officer, Global Village Transformations Pty Ltd.
 
"I have used FlevyPro for several business applications. It is a great complement to working with expensive consultants. The quality and effectiveness of the tools are of the highest standards."

– Moritz Bernhoerster, Global Sourcing Director at Fortune 500
 
"One of the great discoveries that I have made for my business is the Flevy library of training materials.

As a Lean Transformation Expert, I am always making presentations to clients on a variety of topics: Training, Transformation, Total Productive Maintenance, Culture, Coaching, Tools, Leadership Behavior, etc. Flevy "

– Ed Kemmerling, Senior Lean Transformation Expert at PMG
 
"As a small business owner, the resource material available from FlevyPro has proven to be invaluable. The ability to search for material on demand based our project events and client requirements was great for me and proved very beneficial to my clients. Importantly, being able to easily edit and tailor "

– Michael Duff, Managing Director at Change Strategy (UK)


Your Recently Viewed Documents


Customers Also Like These Documents

Related Management Topics


Integrated Financial Model Financial Analysis M&A (Mergers & Acquisitions) Consulting Training Energy Industry Renewable Energy Solar Energy Private Equity Data Center Real Estate Public-Private Partnership

Download our FREE Strategy & Transformation Framework Templates

Download our free compilation of 50+ Strategy & Transformation slides and templates. Frameworks include McKinsey 7-S Strategy Model, Balanced Scorecard, Disruptive Innovation, BCG Experience Curve, and many more.