 Click main image to view in full screen.
Collection Curve and Receipts Forecasting – PowerPoint PPTX Template
PowerPoint (PPTX) + Zip archive file (ZIP) 12 Slides


BENEFITS OF THIS DOWNLOADABLE POWERPOINT DOCUMENT
- Forecast 13 weeks of customer receipts from how your customers actually pay, not from payment terms
- Build collection curves by customer segment from your own paid-invoice history in minutes, with a ready Excel builder
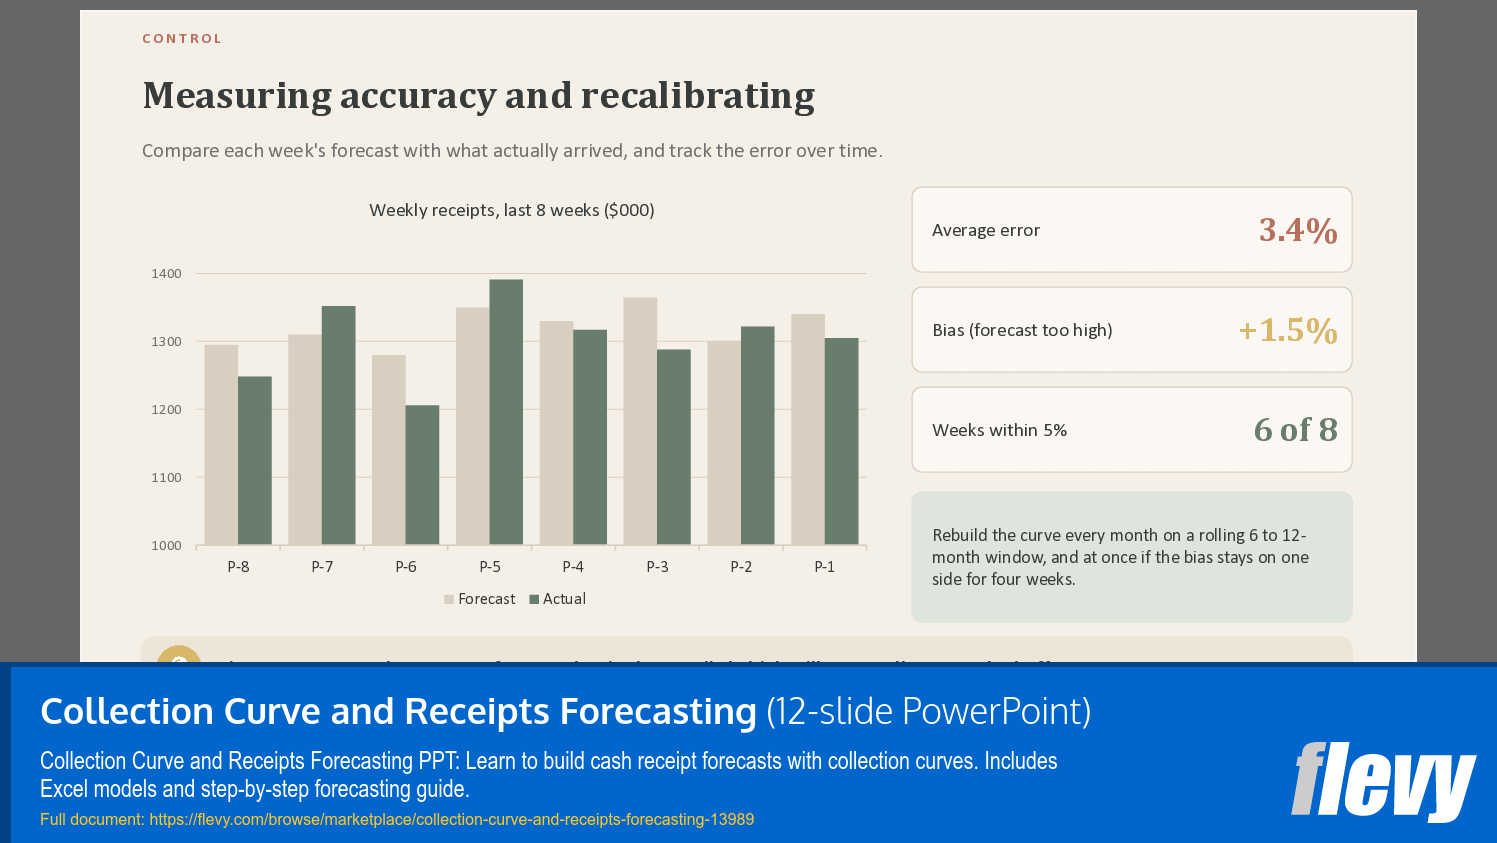
- Track forecast error and bias every week and know exactly when to recalibrate
CASH FLOW MANAGEMENT PPT TEMPLATE DESCRIPTION
Customer receipts are the largest line in most cash forecasts, and the hardest to get right. Customers pay when they choose to, not when the contract says, so forecasts built on payment terms are wrong week after week even when the monthly total looks fine.
This toolkit shows how to forecast receipts with a collection curve: the share of each week's invoicing that is collected in the same week, one week later, two weeks later and so on. It combines a short guide with the working files to build the curve from your own data, run a 13-week receipts forecast and measure its accuracy.
WHAT IS INCLUDED
• Collection Curve and Receipts Forecasting guide (PowerPoint, 12 slides)
• Collection Curve Builder (Excel): paste your paid invoices, flag exclusions, and get the curve, the cumulative curve and average days to pay for up to three segments plus all customers, with a chart
• Receipts Forecast Model (Excel): 13 weeks of receipts by segment from past and forecast invoicing, overlay lines for known exceptions, a reconciliation of implied versus ledger receivables, and an accuracy sheet with error, bias and a target check
• Receipts Forecasting Procedure (Word): weekly cycle, roles, data sources, recalibration rules, overlay log and curve change log
• Licence and terms of use
WHO IT IS FOR
Treasurers and cash managers running a weekly cash forecast, credit and collections managers, FP&A teams, controllers of companies with many customers, and advisers who need a reliable short-term liquidity view for a client or lender
WHAT YOU RECEIVE
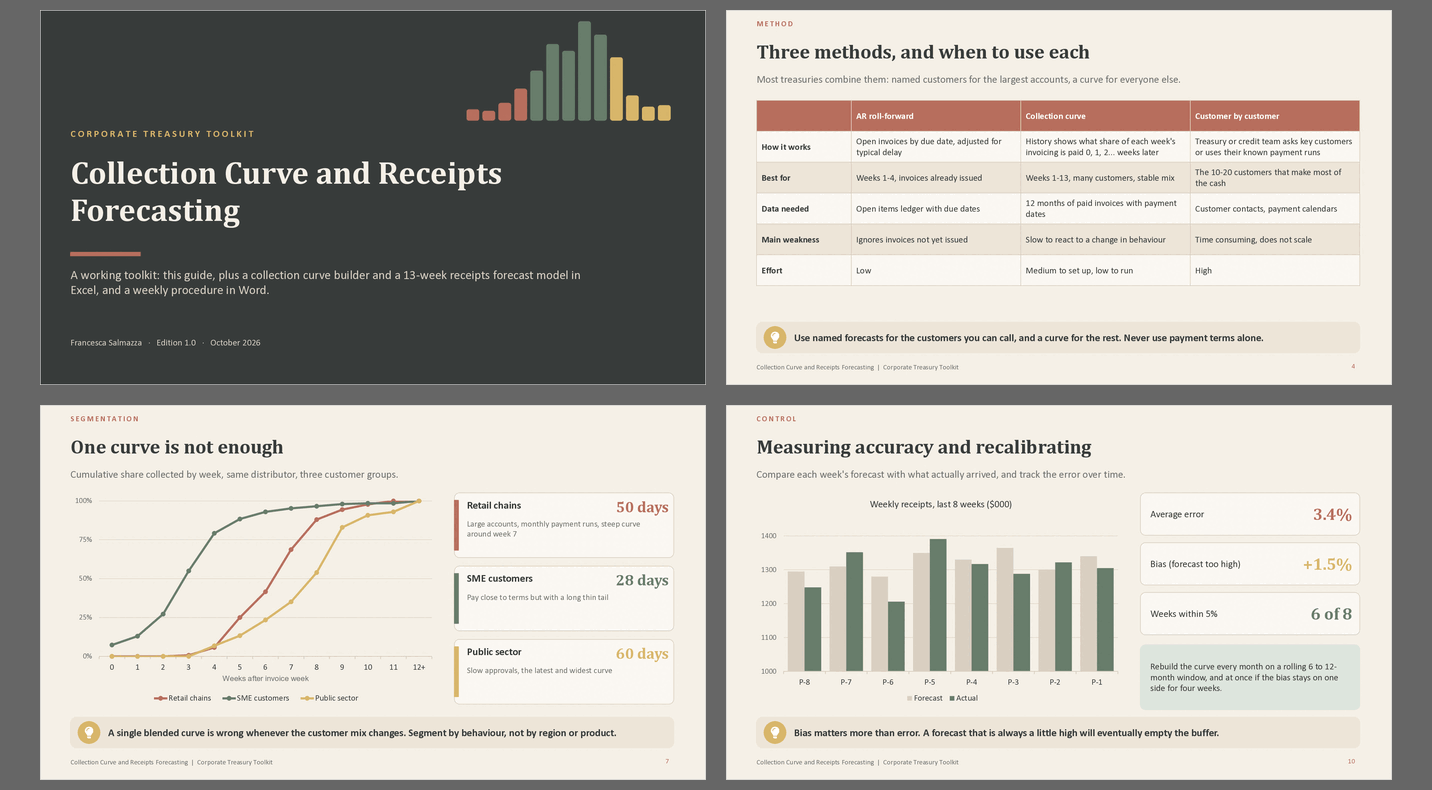
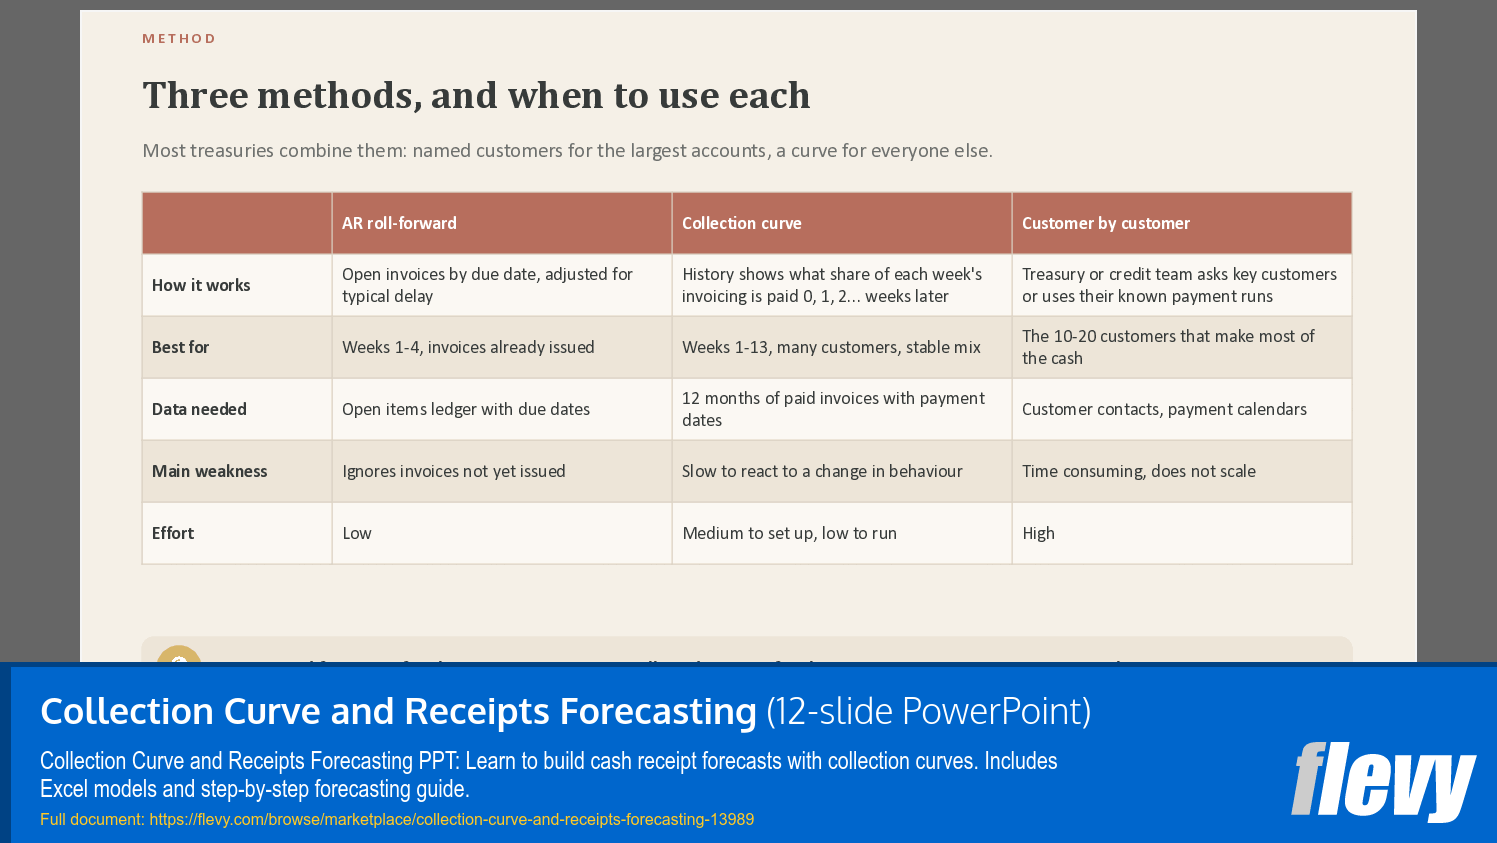
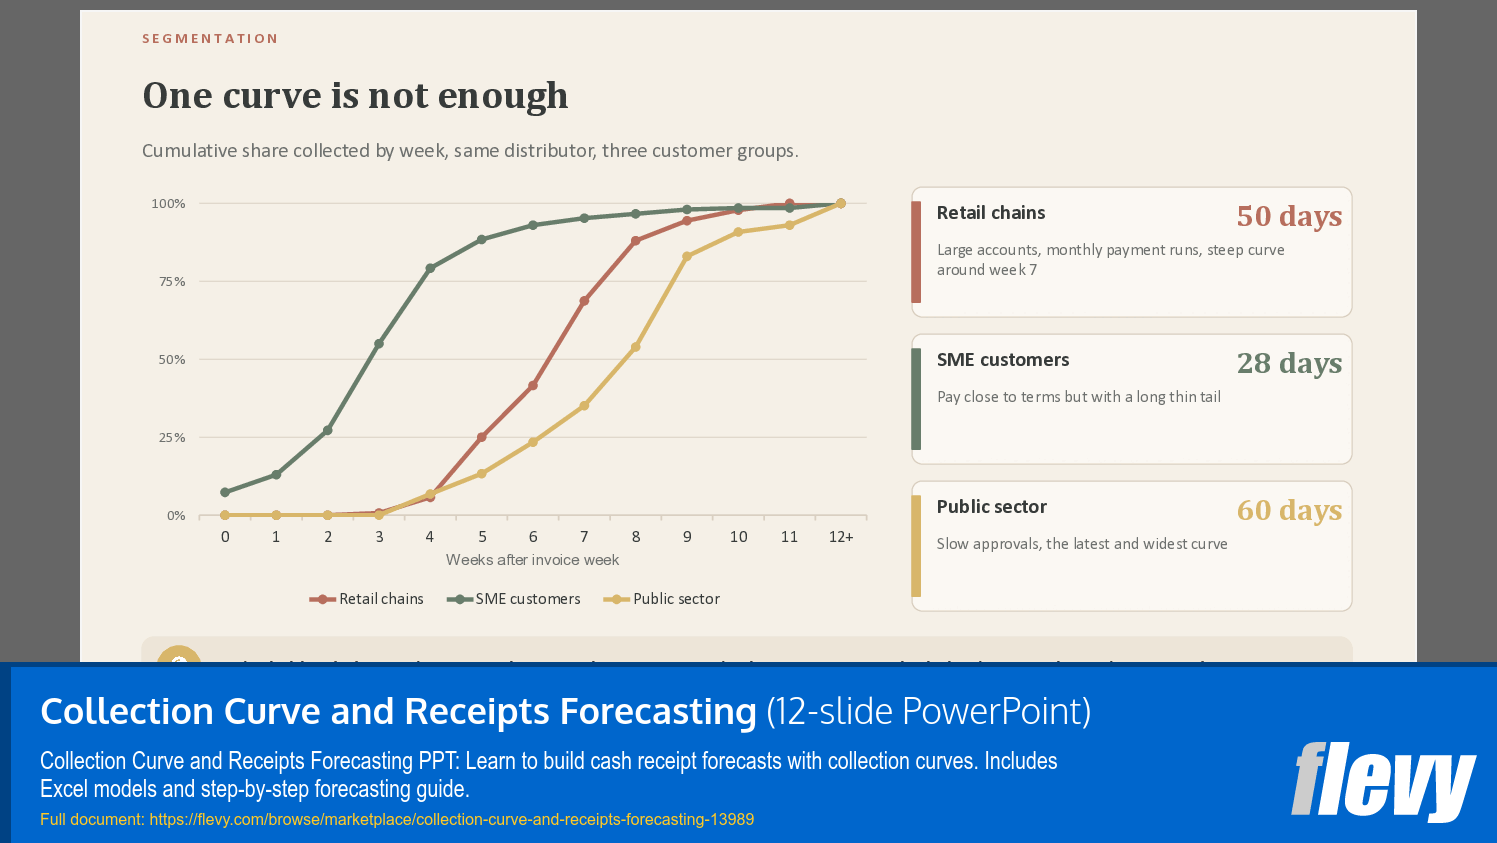
A 12-slide guide in which every slide has a headline that states the point, a body that shows it and a closing takeaway. It covers why receipts are hard to forecast, three methods compared, how a curve works, how to build it, why segments matter, a fully worked week-1 example, the overlays a curve cannot see, and how to measure error and bias
The archive contains 3 working files and a licence. Nothing is password-protected or locked
HOW THE SPREADSHEETS ARE BUILT
Input cells use blue text on a sand background. Formulas are in black and links to other sheets in green. Each file opens with a How to use sheet and an assumptions block. Example data for an invented distributor is shown in italics so you can see the model working before you replace it. A single formula is copied across all weeks, and print areas are set
WHAT THIS IS NOT
This is educational material, not financial or investment advice. All company names and figures are invented. Each file includes a licence page: you may use and adapt the material inside your own organisation, but you may not resell or redistribute it
Got a question about the product? Email us at support@flevy.com or ask the author directly by using the "Ask the Author a Question" form. If you cannot view the preview above this document description, go here to view the large preview instead.
Source: Best Practices in Cash Flow Management, Budgeting & Forecasting PowerPoint Slides: Collection Curve and Receipts Forecasting PowerPoint (PPTX) Presentation Slide Deck, g64266623o55