

Coffee and Snack Financial Model – Excel XLSX
Excel (XLSX)
BENEFITS OF THIS DOWNLOADABLE EXCEL DOCUMENT
- Plan your in-store sales, take away sales as well as online sales.
- Setting up products, pricing, sales mix, and costs by product.
- Create the three financial statements (Profit and Loss, Balance Sheet, and Cash Flow) on a monthly basis for 36 months.
FOOD & BEVERAGE INDUSTRY EXCEL DESCRIPTION
This is a financial model for starting a coffee shop with snacks. The model supports both sitting clients as well as take away, additionally, the model takes into account revenues from instore facilities as well as from online presence (website and related platform).
In addition to the revenues, the model also takes into account the respective seasonality of the sales, and their related costs both as cost of goods sold, variable costs, commissions, as well as fixed costs, financing, depreciation, working capital, loan amortization, valuation, and a series of ratios and KPIs, as well as a series of graphs.
This financial model template will enable you to:
– Plan your in-store sales, take away sales as well as online sales.
– Seasonality mechanism per month to account for fluctuations in your business
– Analyze profitability by product type and delivery type
– Setting up products, pricing, sales mix, and costs by product.
– Forecasting platform commissions, labor costs, and fixed costs
– Set the initial investment amount and the refurbishments/equipment needed
– Set the relevant currency and timing
– Create the three financial statements (Profit and Loss, Balance Sheet, and Cash Flow) on a monthly basis for 36 months.
– Financial Ratios to check the viability of your business
– Printable model as PDF for your investors
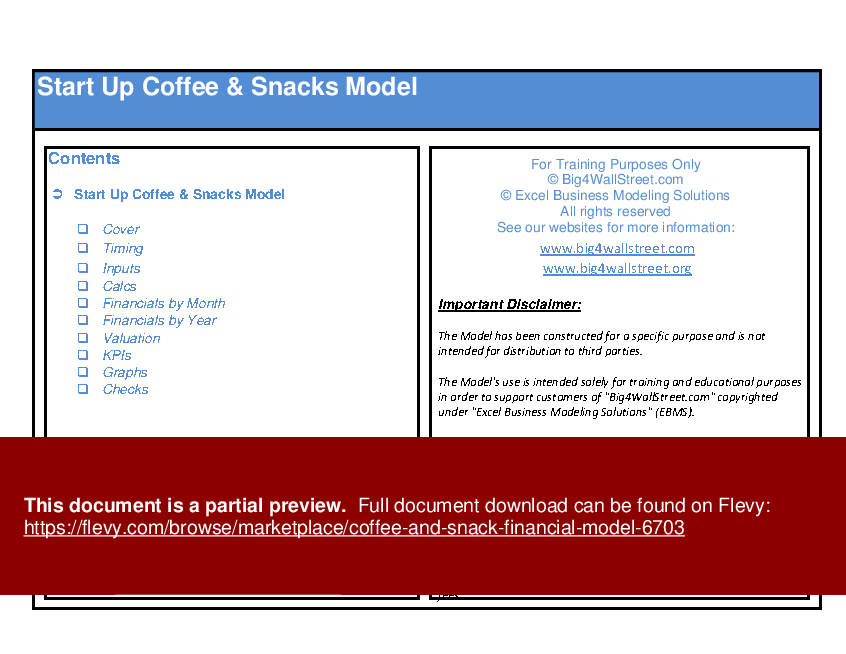
So a quick overview of the model, in the contents tab you can see the structure of the model, and by clicking on any of the headlines be redirected to the relevant worksheet.
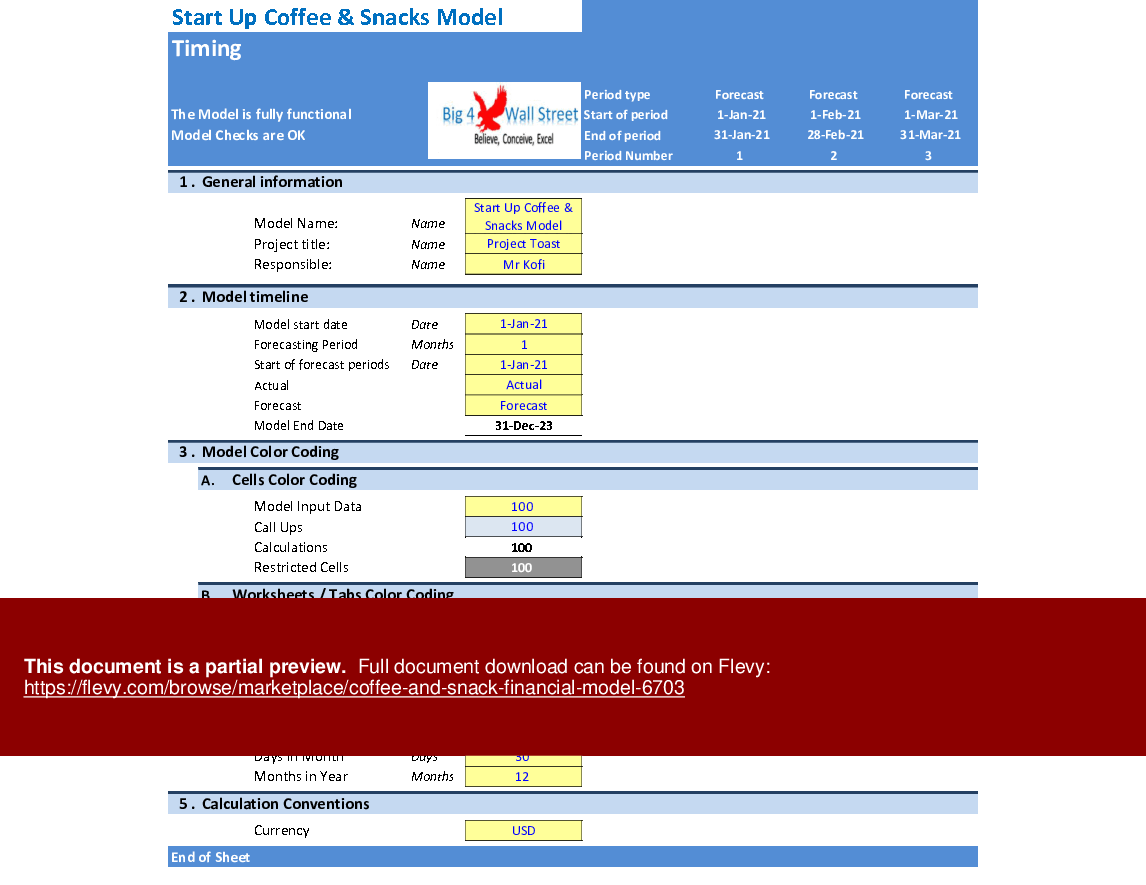
On the timing tab, you are able to feed the general information for the model such as: model name, responsible, the timeline of the model, and the date and currency conventions.
Additionally, there is a description of the color-coding of the model in the same tab. Inputs are always depicted with a yellow fill and blue letters, call ups (that is direct links from other cells) are filled in light blue with blue letters while calculations are depicted with white fill and black characters.
There is also color coding for the various tabs of the model. Yellow tabs are mostly assumptions tabs, grey tabs are calculations tabs, blue tabs are outputs tabs (that is effectively results or graphs) and finally, light blue tabs are admin tabs (for example: the cover page, contents, and checks).
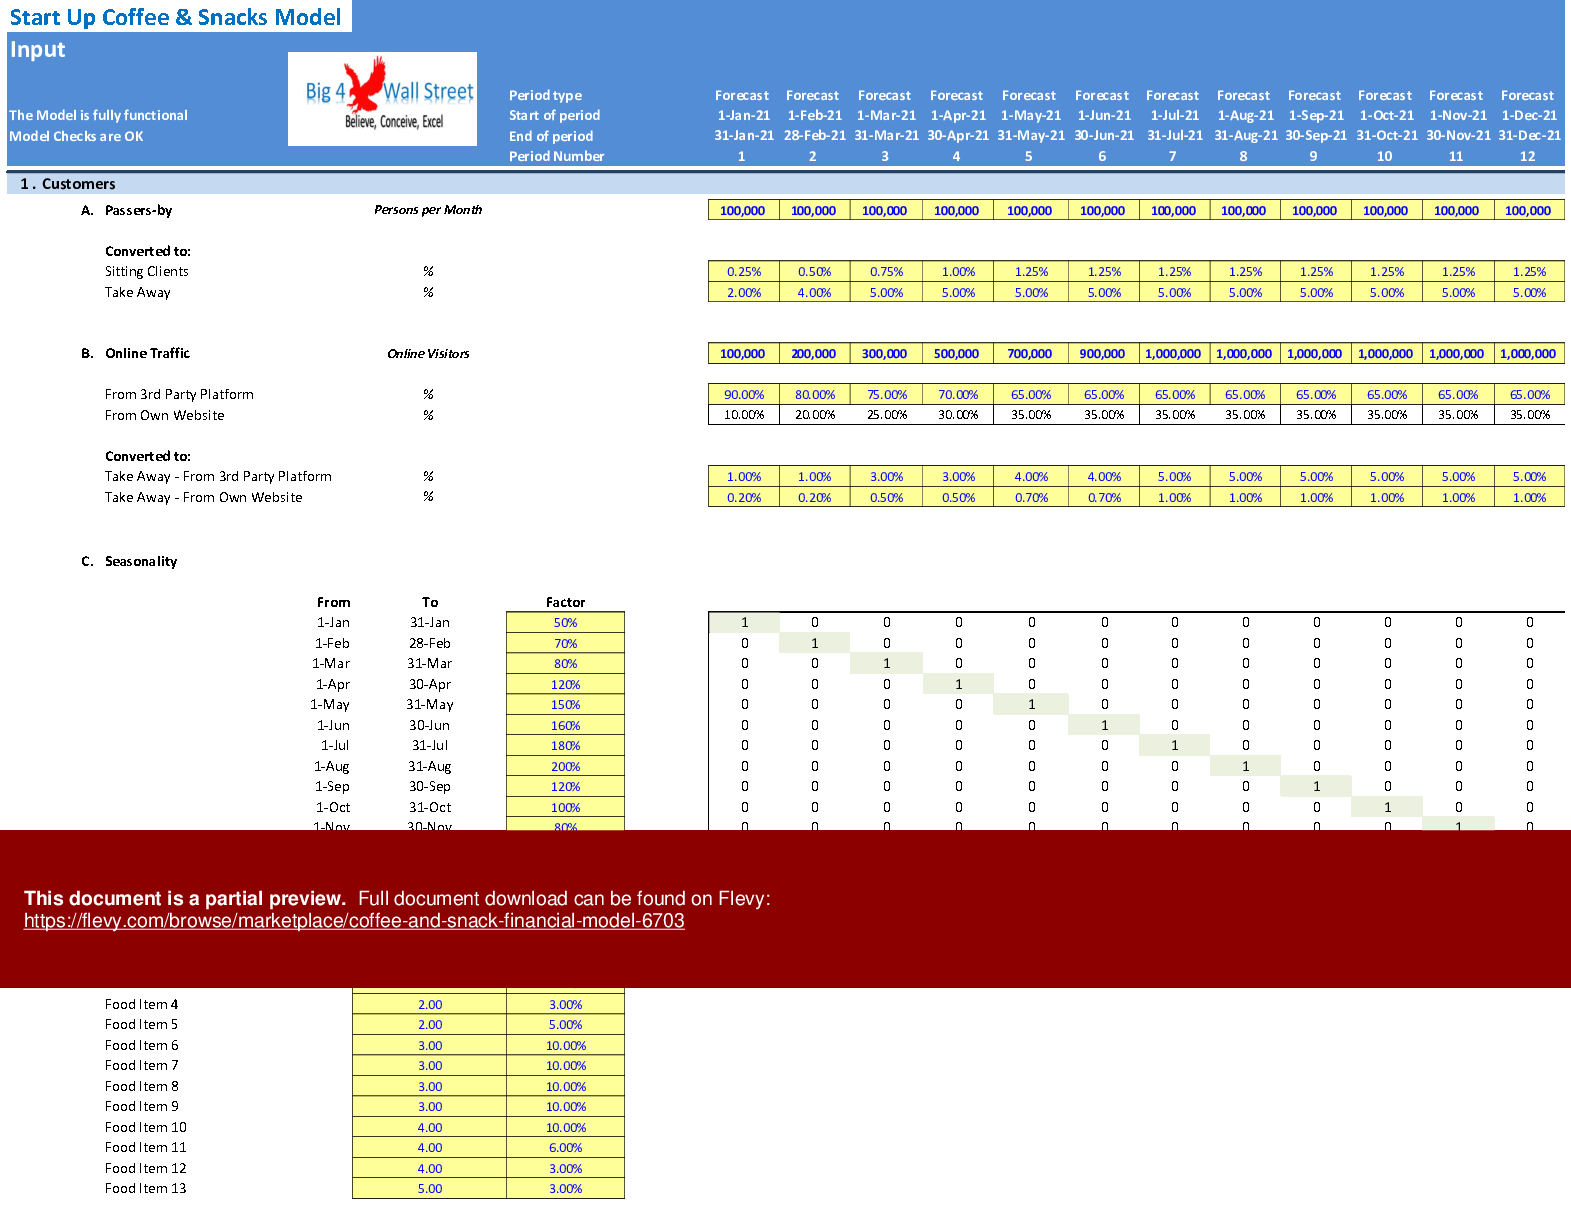
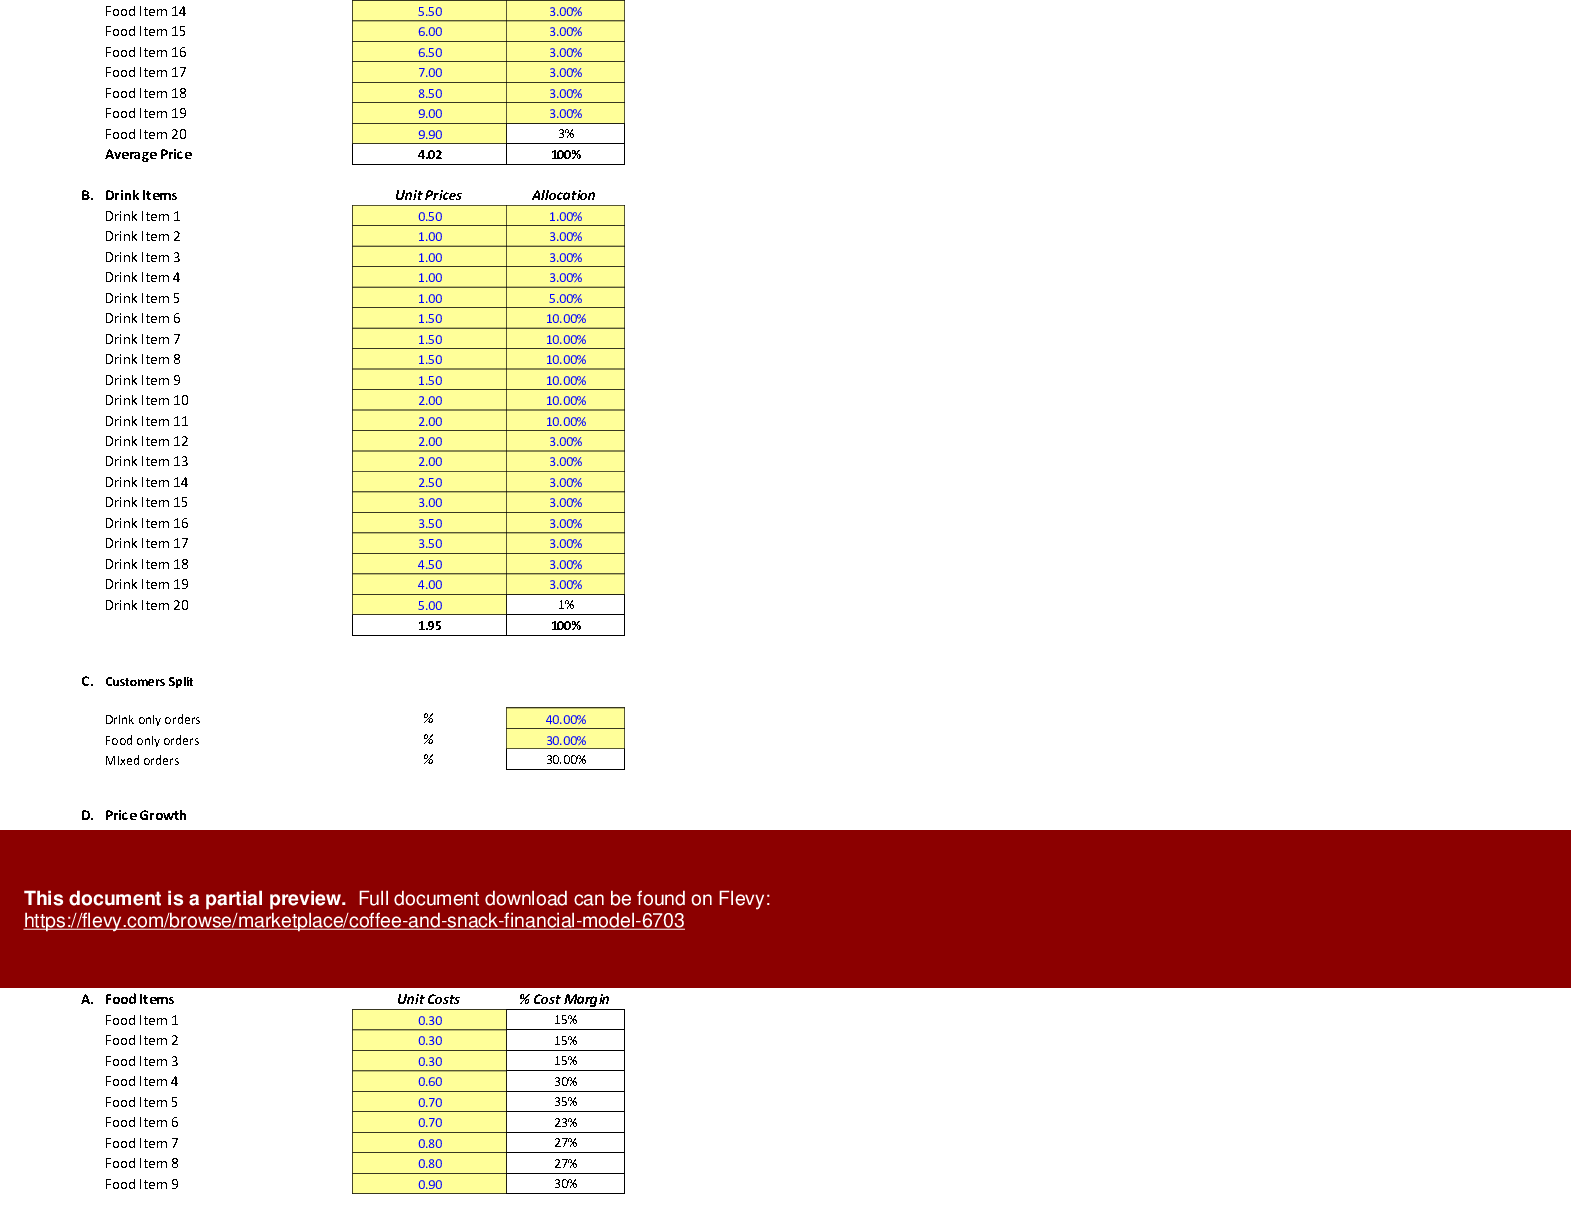
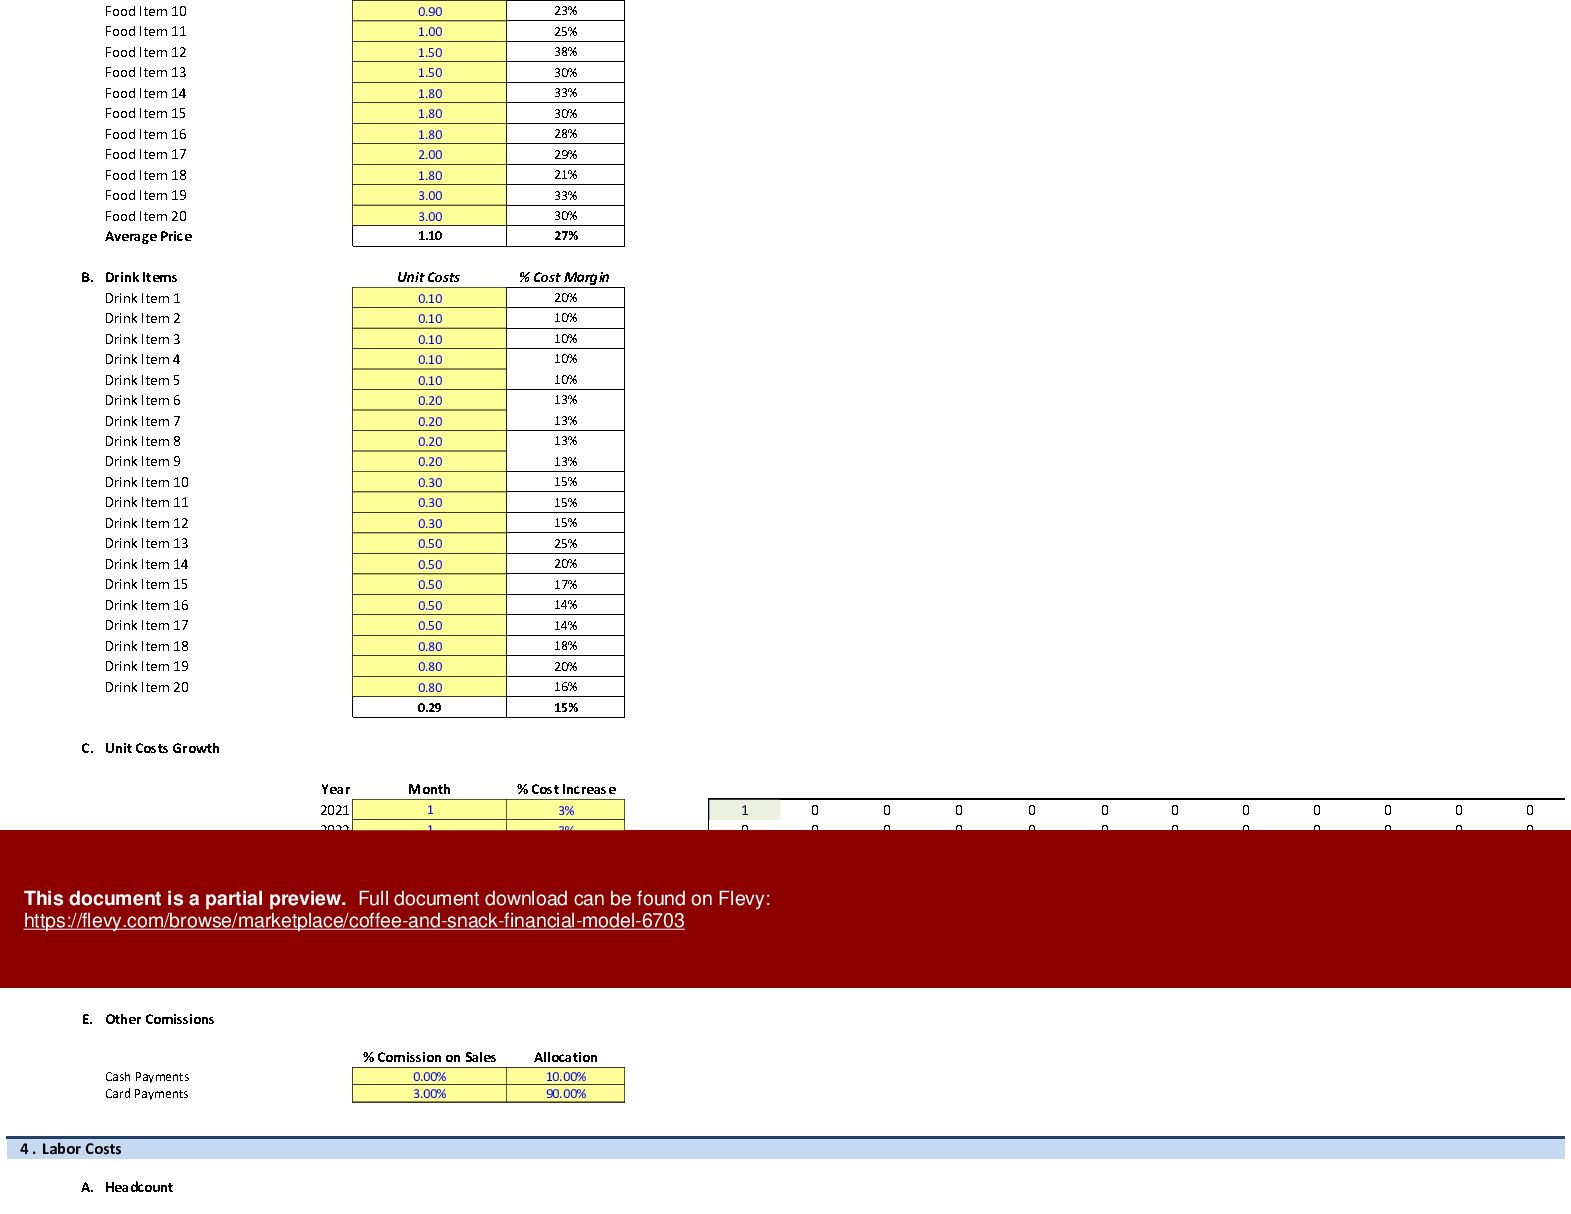
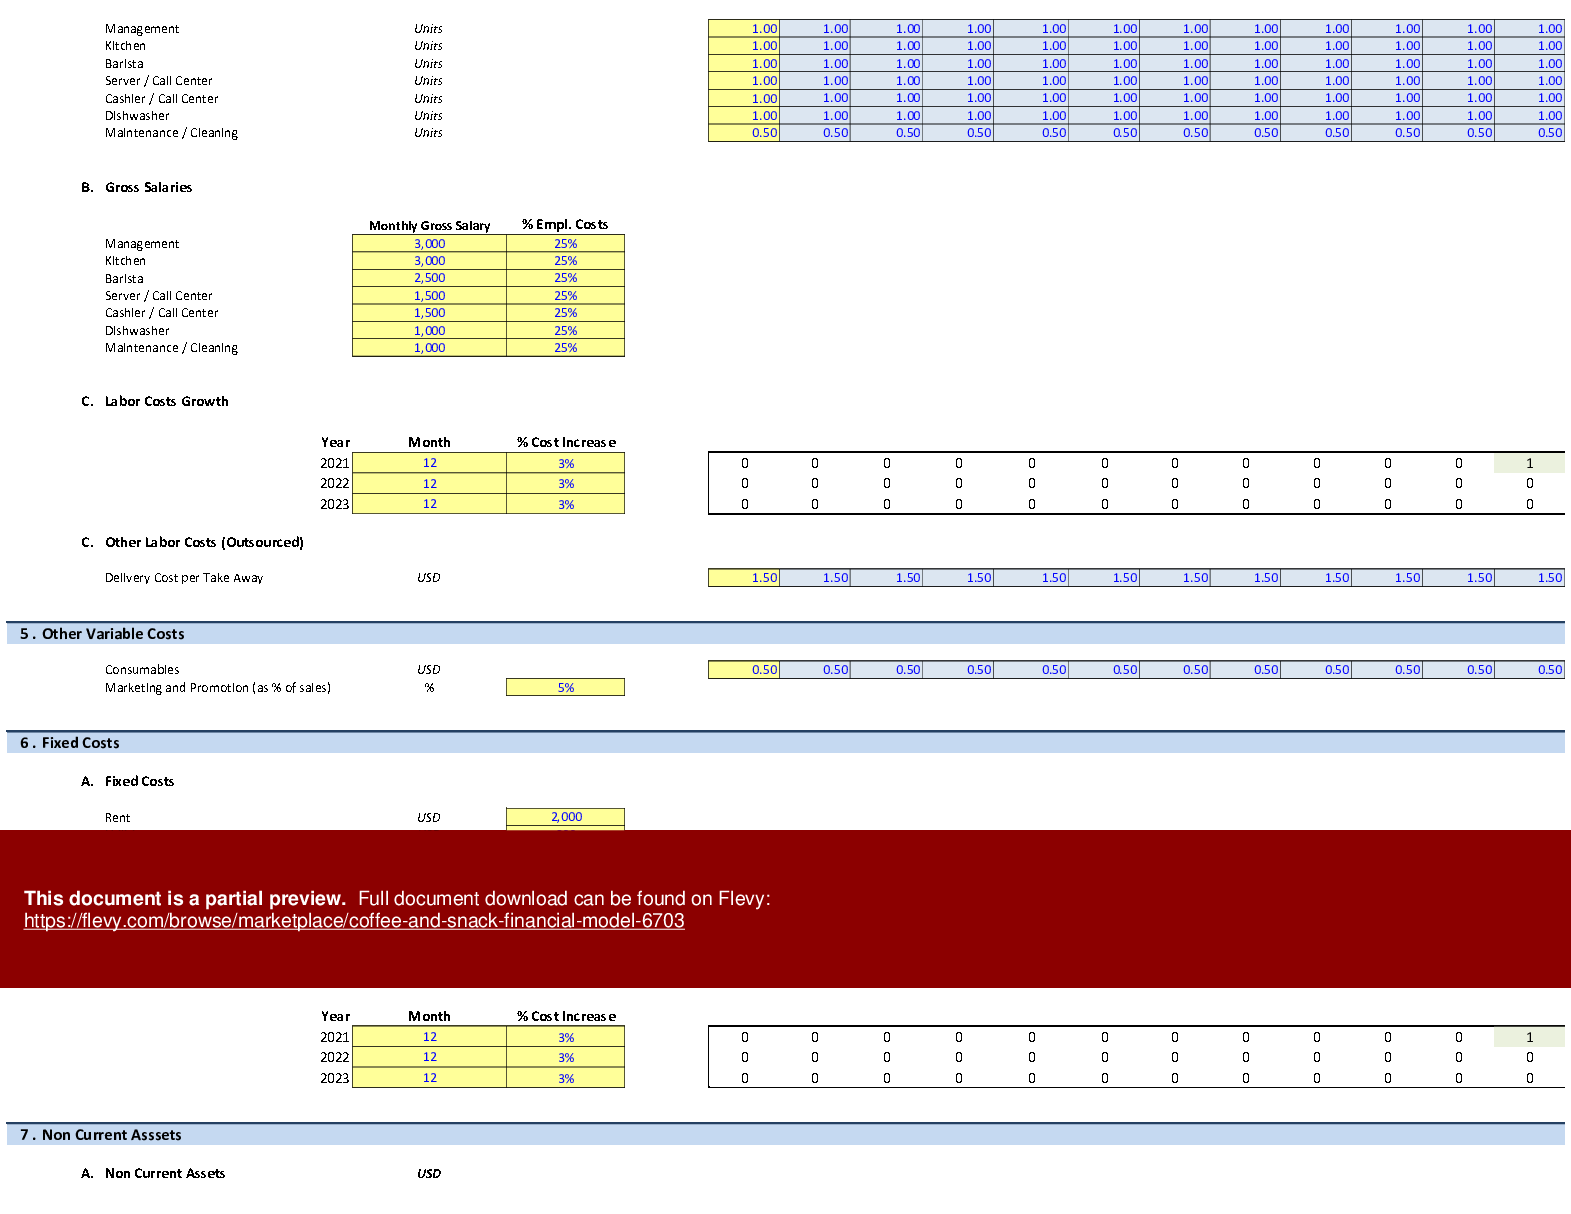
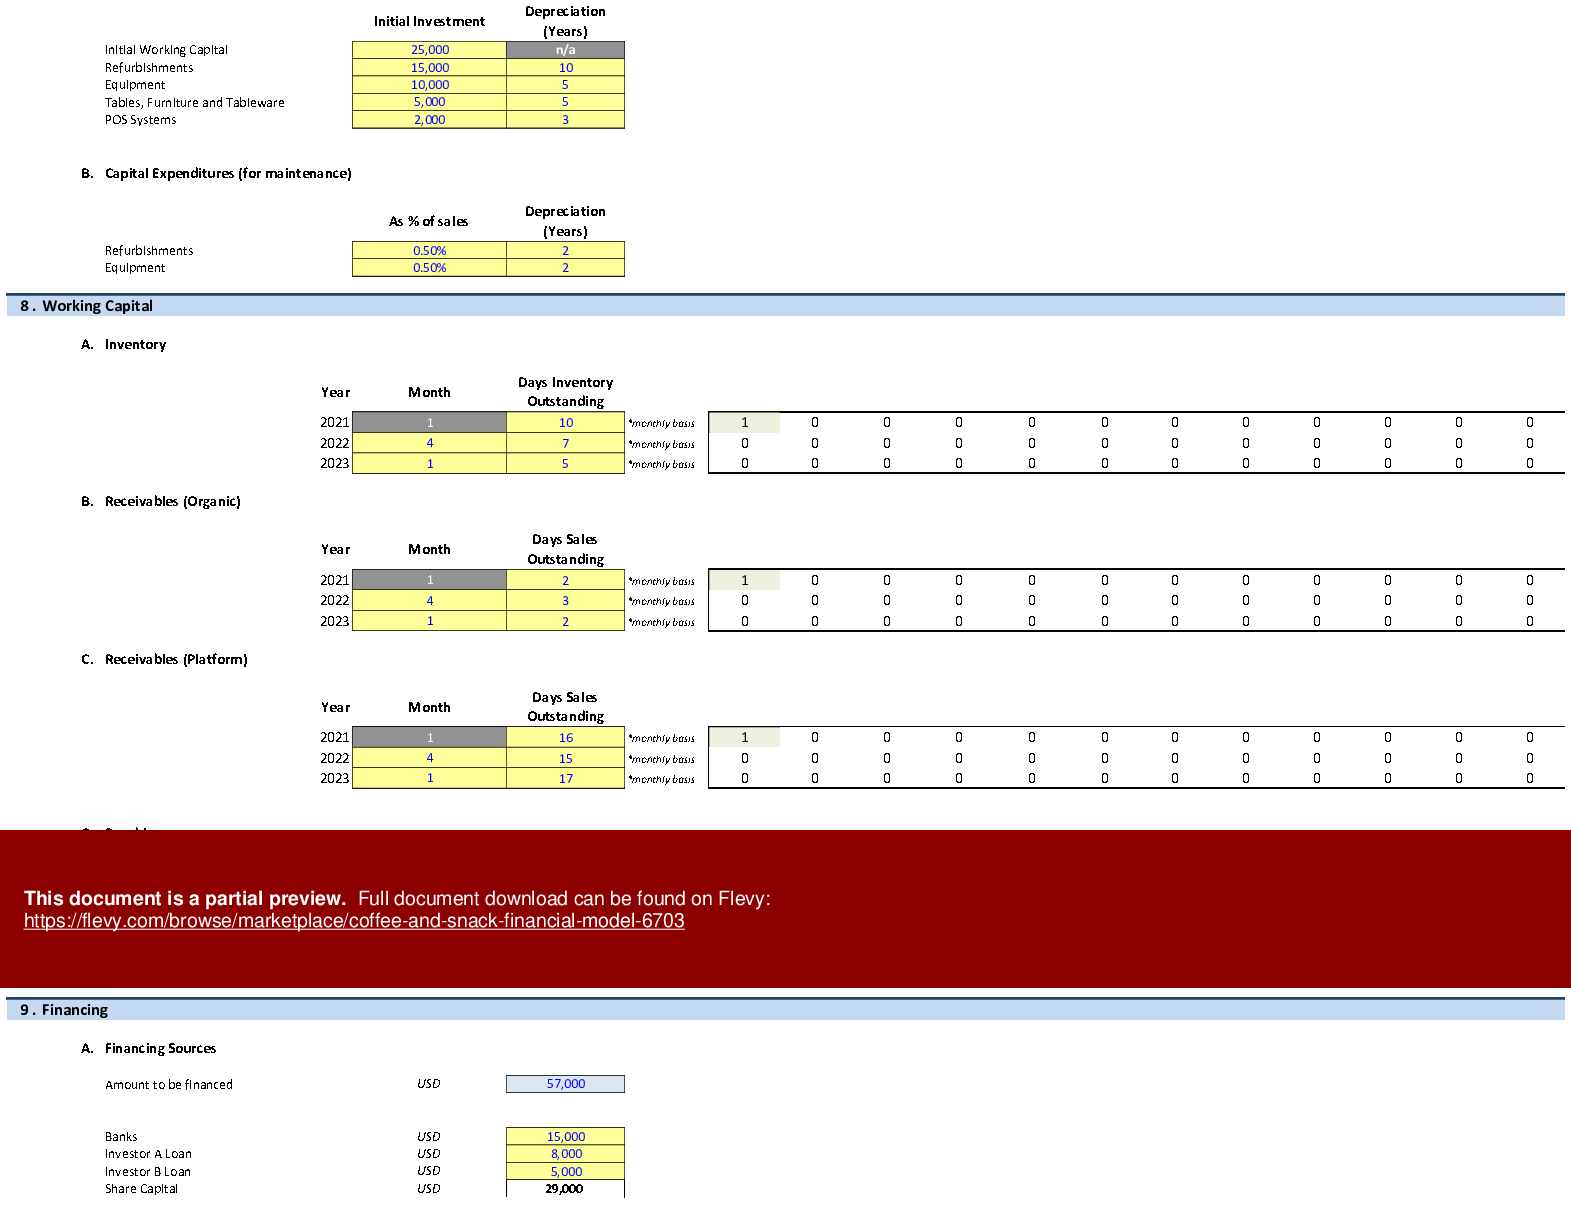
Moving on to the inputs tab, you can adjust the various assumptions of the model based on the specifications and requirements of your business. So effectively you can adjust the detailed revenue assumptions and the user can amend the most important drivers such as: customers, passers-by conversion, and online conversion, as well as seasonality. Moving on the cost is comprised of three main categories: cost of food and beverages, labor cost (both full-time employees and outsourced personnel), and operating costs (rent, utilities, consumables, insurance, advertising, maintenance, etc). Going forward you can adjust non-current assets, CAPEX, as well as their depreciation schedule, the working capital assumptions (inventory, receivables, and payables), which can also be adjusted accordingly, and finally, the financing assumptions of the business whether these are debt or equity-financed can also be amended.
On the calculation tab, all calculations are performed instantly without the need for an excel macro. The calculations follow the same logical flow as in the inputs tab. As already mentioned no inputs from the use are needed here, as all the inputs are fed in the yellow cells on the inputs tab only.
On the Financial Statements tabs, you can see the resulting income statement, balance sheet as well as the cash flow of the company and or project.
In the Valuation tab, the valuation of the company is performed. In the same tab, you can also find some feasibility metrics such as Return on Equity, Return on Assets, Net Present Value, Internal Rate of Return, and Cash on Cash Multiple.
The most important business and financial KPIs are presented in the KPIs tab along with various valuation metrics. These KPIs are also presented by using some graphical representations in the Graphs tab. For example: Revenues & Operating Profit, Cost of Goods Sold, Cash Flows as well as a number of other financial metrics from valuation to profitability, working capital, and debt.
Finally, the checks tab where the most critical checks are aggregated on this page. Whenever you see an error message on any page, you should consult this page to see where the error is coming from.
Got a question about the product? Email us at support@flevy.com or ask the author directly by using the "Ask the Author a Question" form. If you cannot view the preview above this document description, go here to view the large preview instead.
Source: Best Practices in Food & Beverage Industry, Restaurant Industry, Integrated Financial Model Excel: Coffee and Snack Financial Model Excel (XLSX) Spreadsheet, Big4WallStreet
ABOUT THE AUTHOR
We help small and midsize businesses' leaders with their strategic problems by creating or improving financial models, implementing tools to drive efficiency, performance, and better decision making.
With over 15 years of experience in Financial & Business Modeling / Planning, Performance & Analysis (Ernst & Young, Toyota, Viohalco and Upstream), we have developed strong business
... [read more]
Ask the Author a Question
You must be logged in to contact the author.
