
Buy, Rehab, Rent, Refinance, Repeat (BRRRR) Real Estate Investment 3 Statement Model – Excel XLSX
Excel (XLSX) + Excel (XLSX)
VIDEO DEMO
BENEFITS OF THIS DOWNLOADABLE EXCEL DOCUMENT
- Preparation of a 5 year 3 statement (Income Statement, Balance Sheet, Cash Flow Statement) Financial Projection Model for a Buy, Rehab, Rent, Refinance, Repeat (BRRRR) real estate investment business.
REAL ESTATE EXCEL DESCRIPTION
Real Estate Investment Financial Projection is essential for investors and developers. It estimates future cash flows, helping with informed property acquisitions, financing decisions, and risk assessment. These projections enable optimized property management, rent pricing, and long-term financial planning. They also assist in attracting investors and securing loans by showcasing potential returns and mitigating risks. Moreover, they serve as a performance benchmark, facilitating adjustments to investment strategies based on market trends. In summary, Real Estate Investment Financial Projections are instrumental in achieving investment goals, ensuring financial sustainability, and maximizing returns in the dynamic real estate market.
PURPOSE OF MODEL
Highly versatile and user-friendly Excel model for the preparation a of a 5-year rolling 3 statement (Income Statement, Balance Sheet and Cash flow Statement) financial projection with a monthly timeline for a startup or existing Buy, Rehab, Rent, Refinance, Repeat (BRRRR) real estate investment business generating rental income and property sales revenue. The excel model allows the user to model up to 10 properties developments with multiple units (if applicable) each at different lifecycle stages. It allows the user to model the full end to end lifecycle stages including buying, rehabilitating, renting, refinancing, selling the properties and repeating with another property development. The model allows the user to model rental income, property sales, borrowings per property and refinanced borrowing, development costs, transaction fees, variable costs on rental income, fixed costs, taxes, dividends and changes in model follows good practice financial modelling principles and includes instructions, line-item explanations, checks and input validations and incorporates a discounted cash flow valuation calculation using the forecasted cash flows.
KEY OUTPUTS
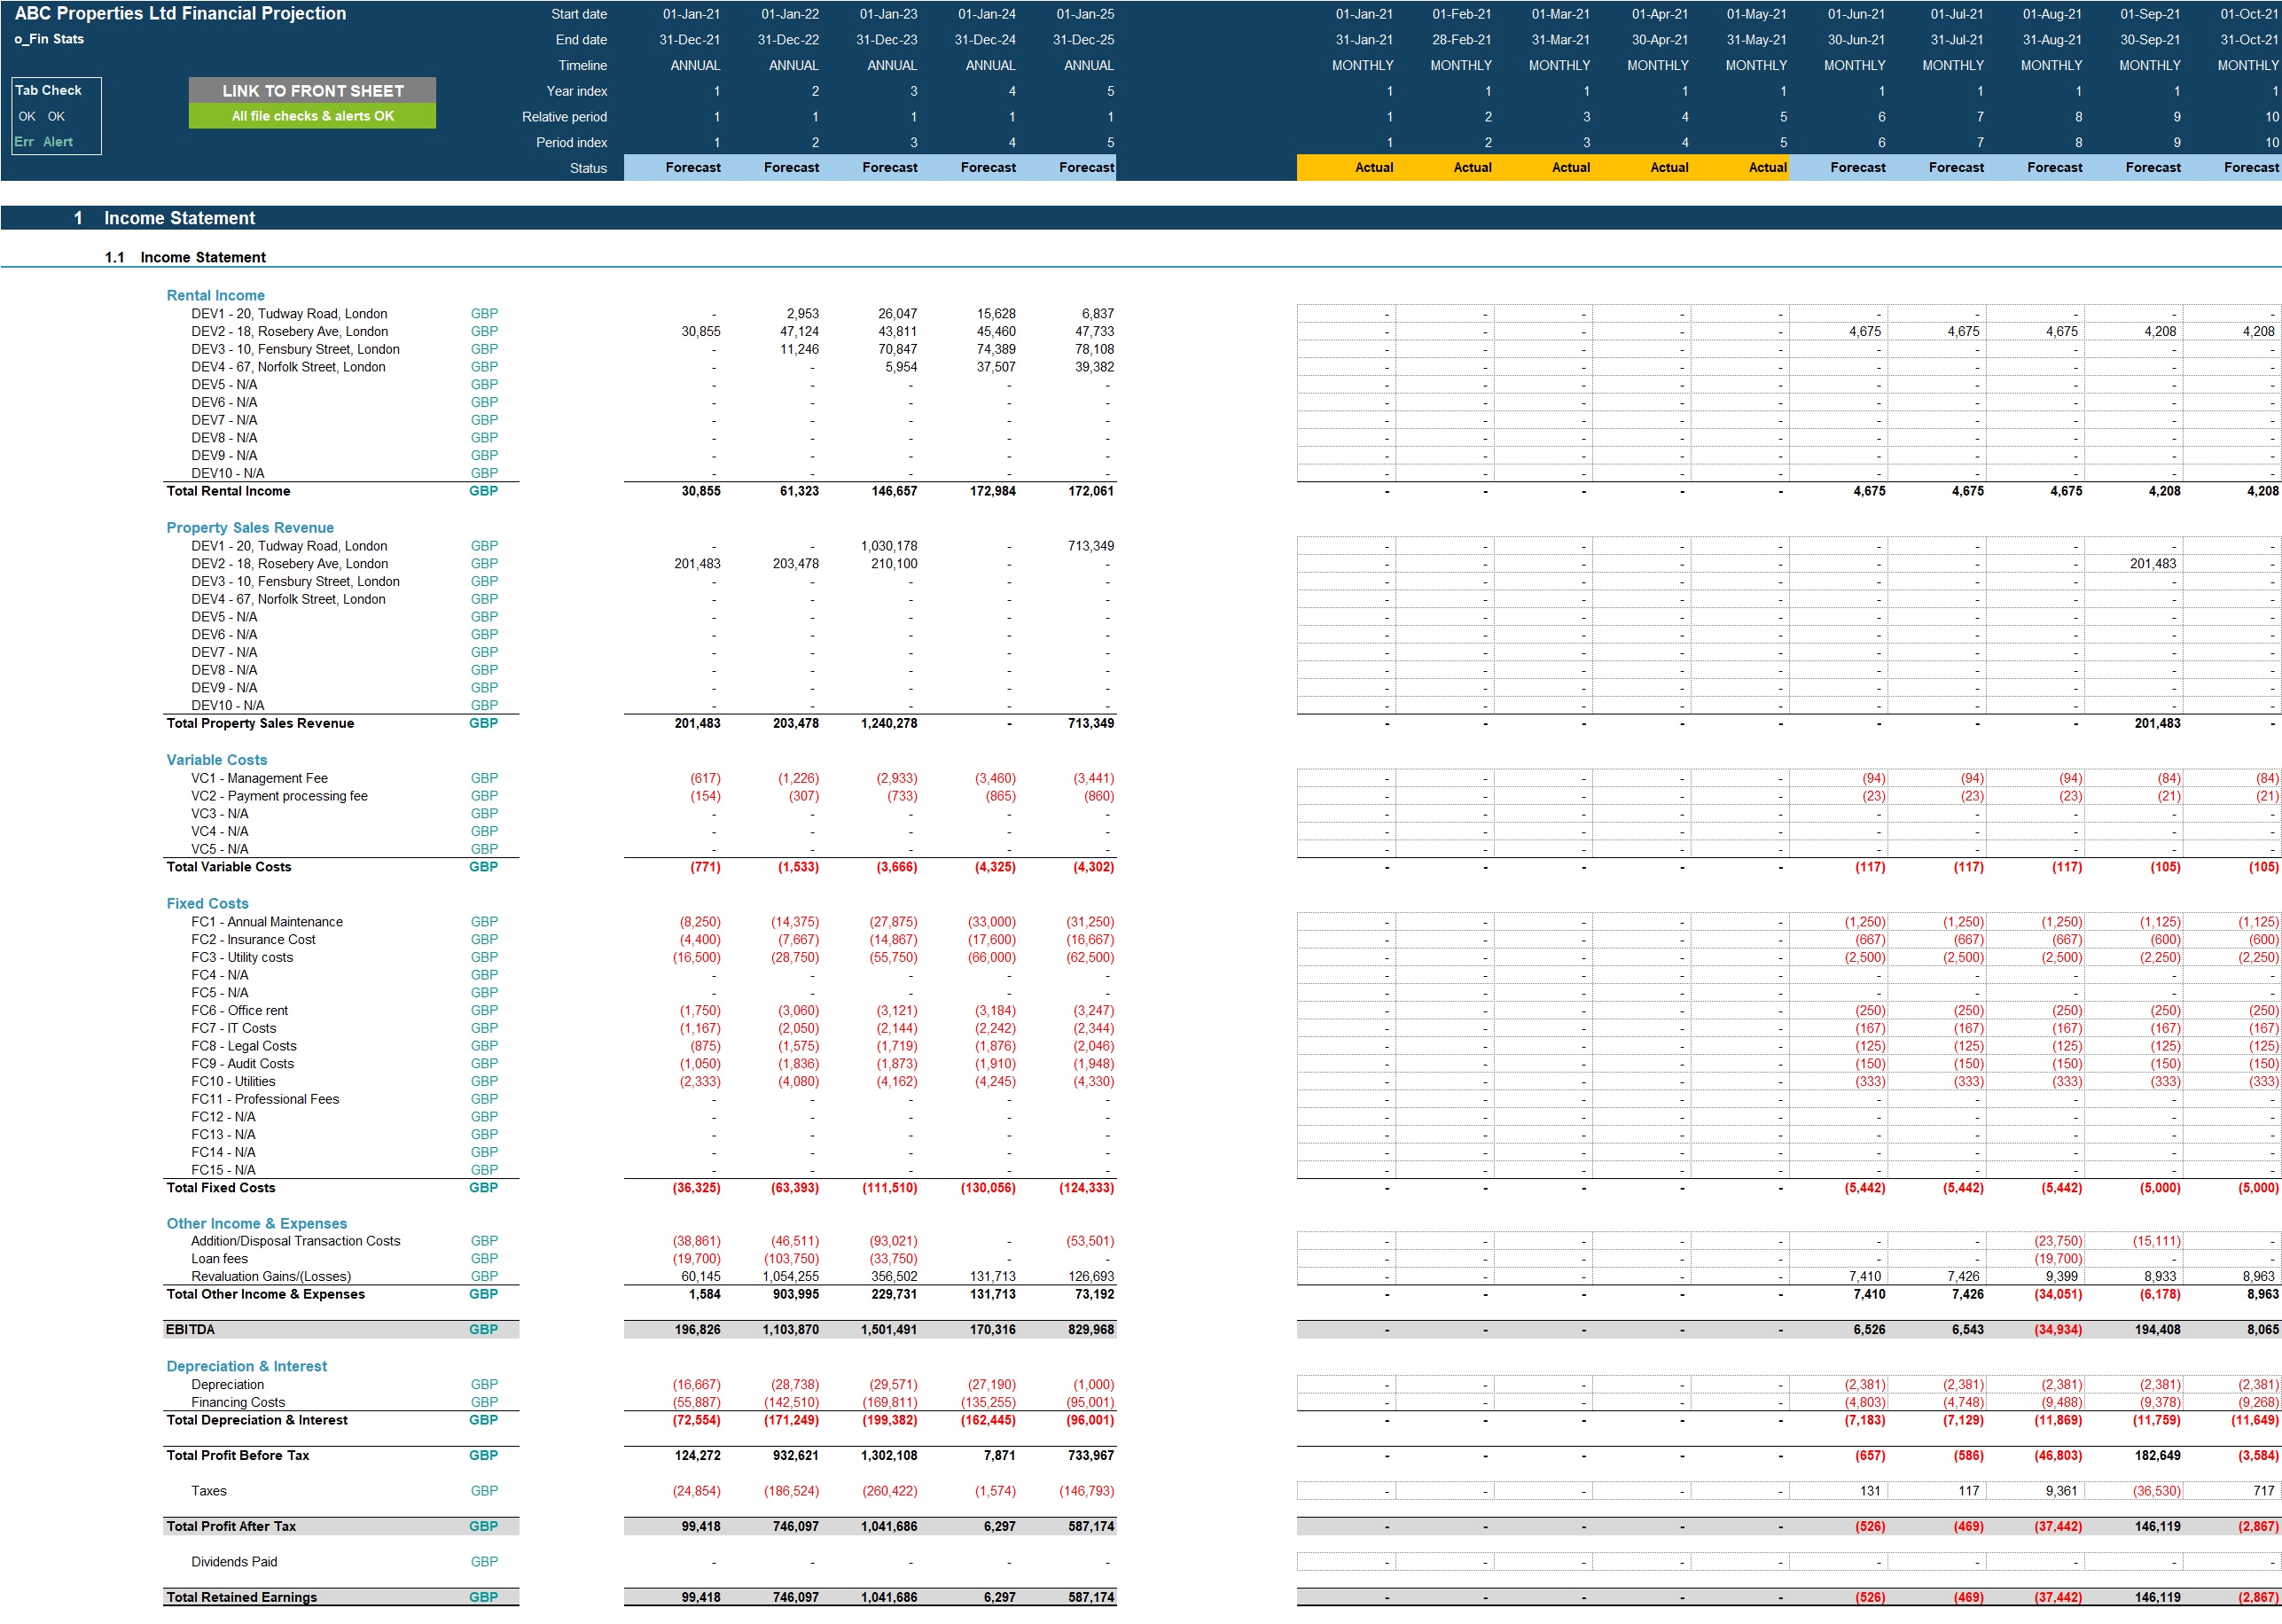
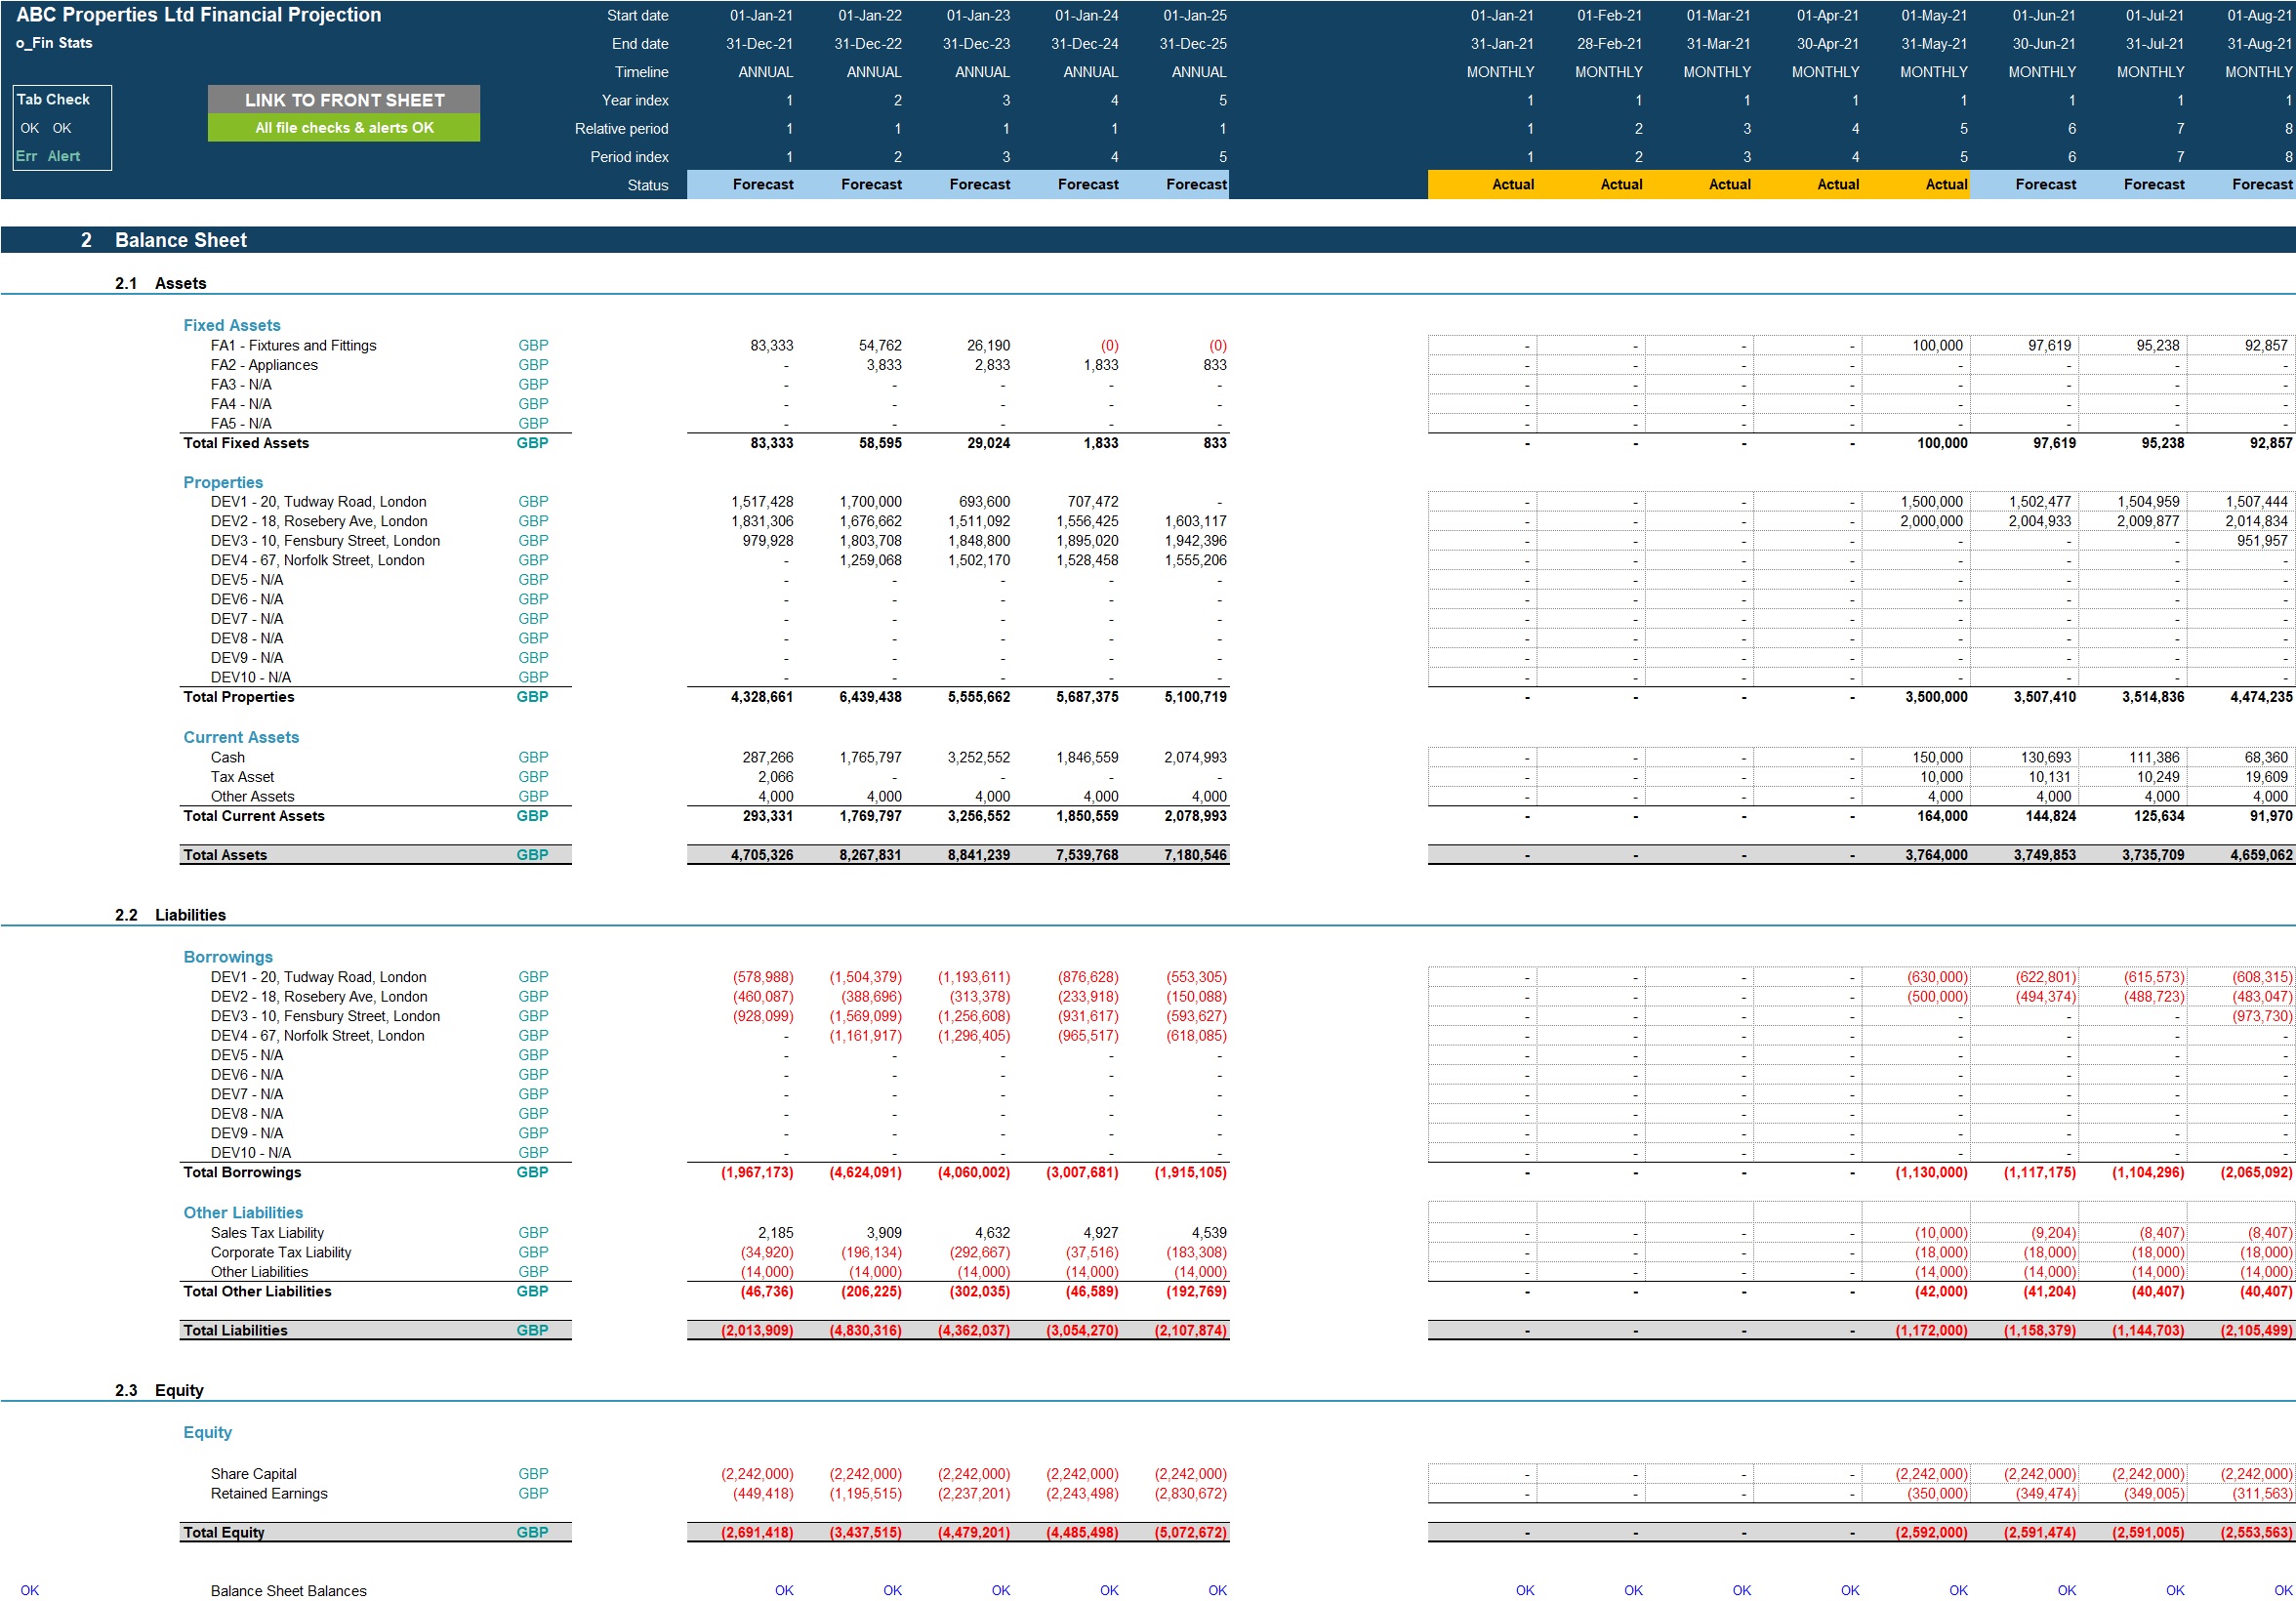
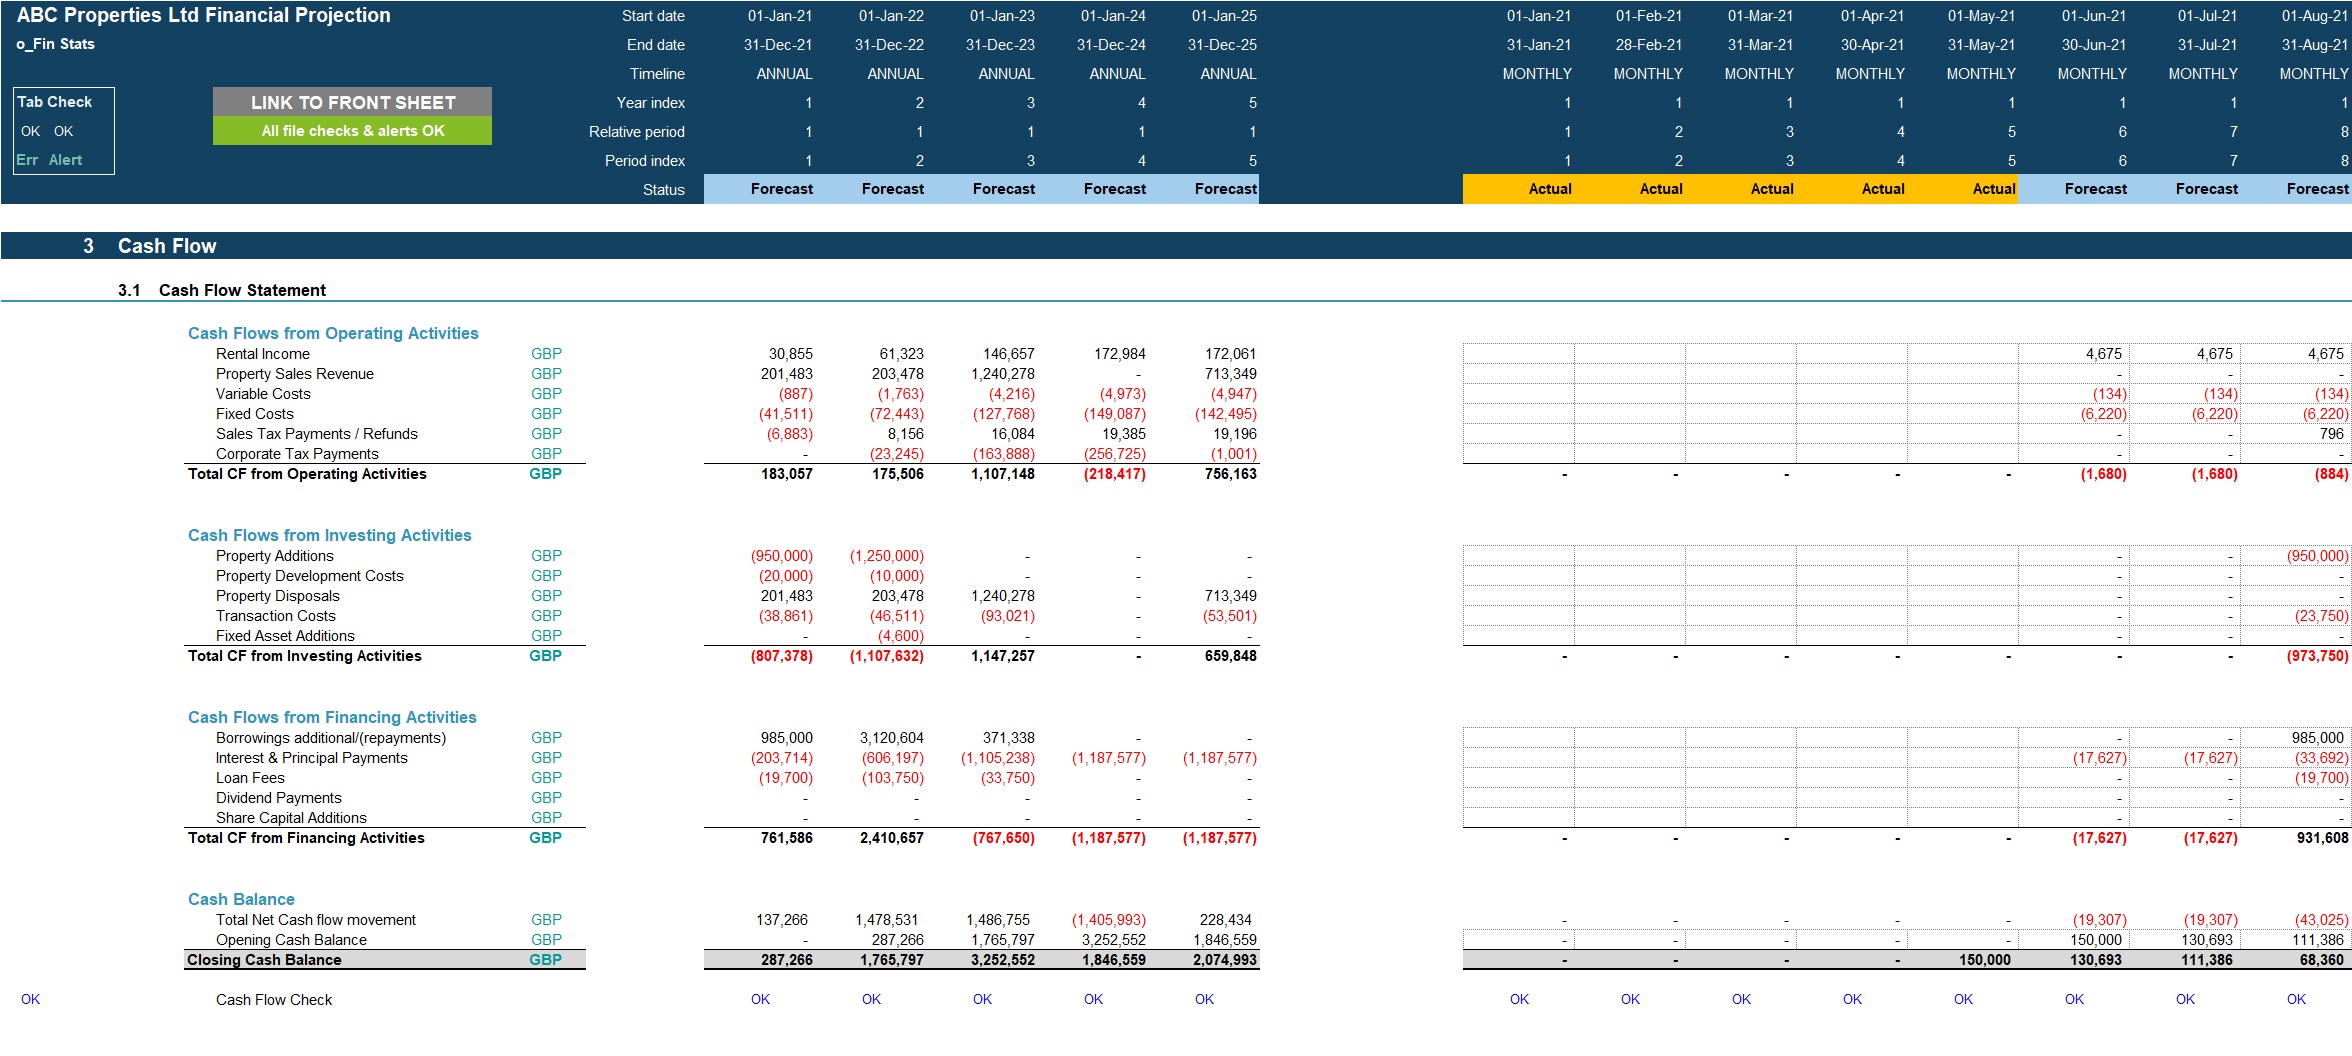
The key outputs include:- Projected full financial statements (Income Statement, Balance Sheet and Cash flow Statement) presented on a monthly basis across up to 5 years and summarised on an annual basis.
• Dashboard with:o Summarised projected Income Statement and Balance Sheeto Compounded Annual Growth rate (CAGR) for each summarised income statement and Balance Sheet line itemo List of key ratios including average revenue growth, average profit margins, average return on assets and equity and Average Debt to Equity ratio.o Bar charts summarising income statement and Balance Sheet projectionso Revenue and direct expenses by development in table and bar-chart format- Discounted cash flow valuation using the forecasted cash flow outputs.
KEY INPUTS
Inputs are split into Income Statement and Balance Sheet Inputs. Most inputs include input validations and conditional formatting to help users understand what the input is for and populate correctly.
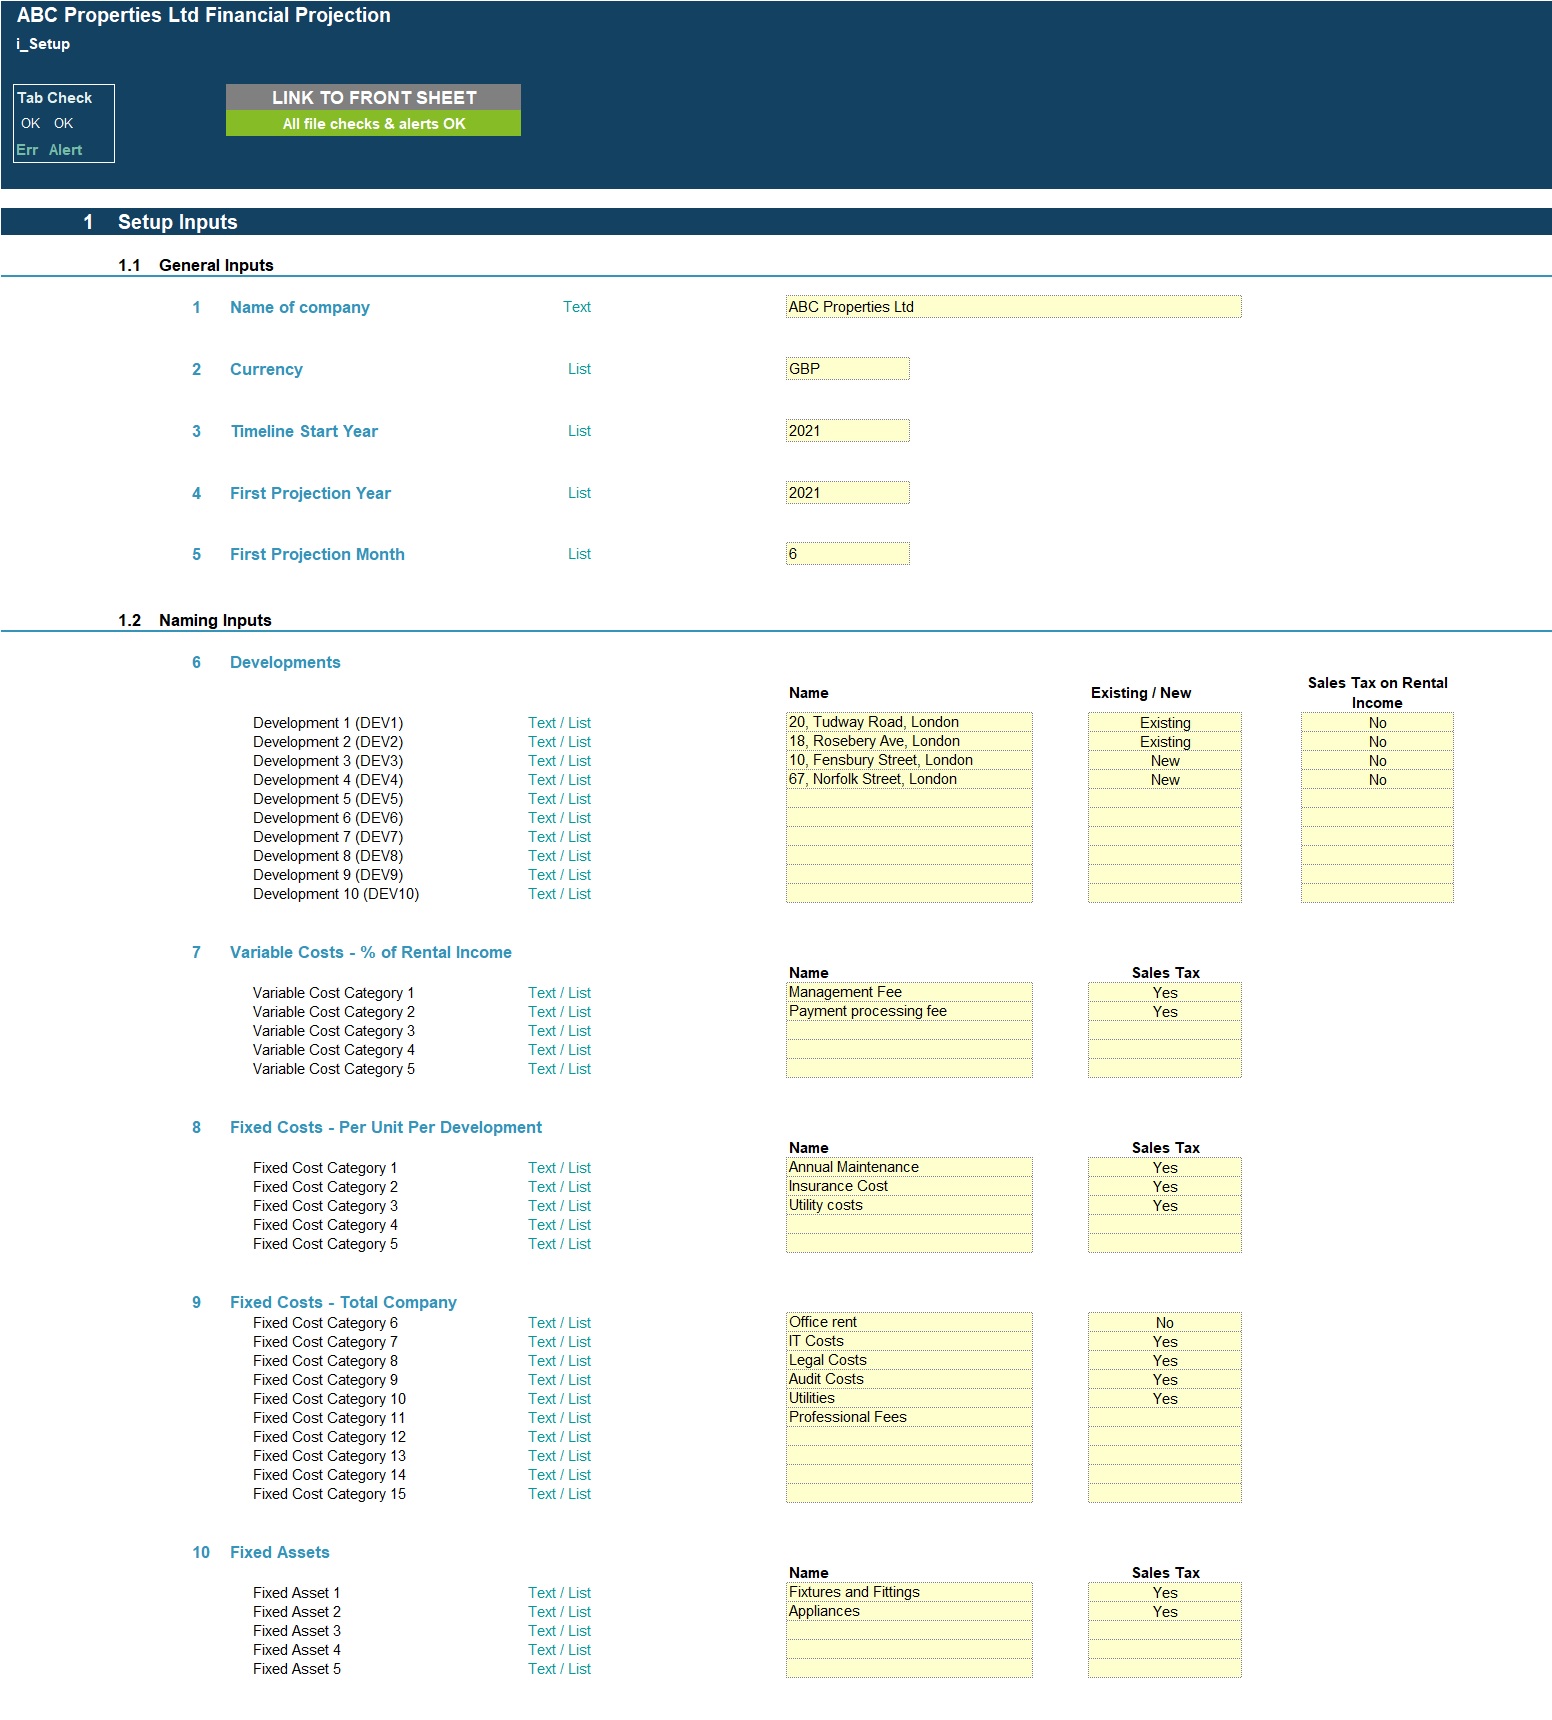
Setup Inputs:
• Name of business;
• Currency;
• First projection year and month;
• Naming for property developments, variable and fixed costs, company-wide fixed assets and borrowings;
• Sales tax applicability for revenue, expense and fixed asset items.
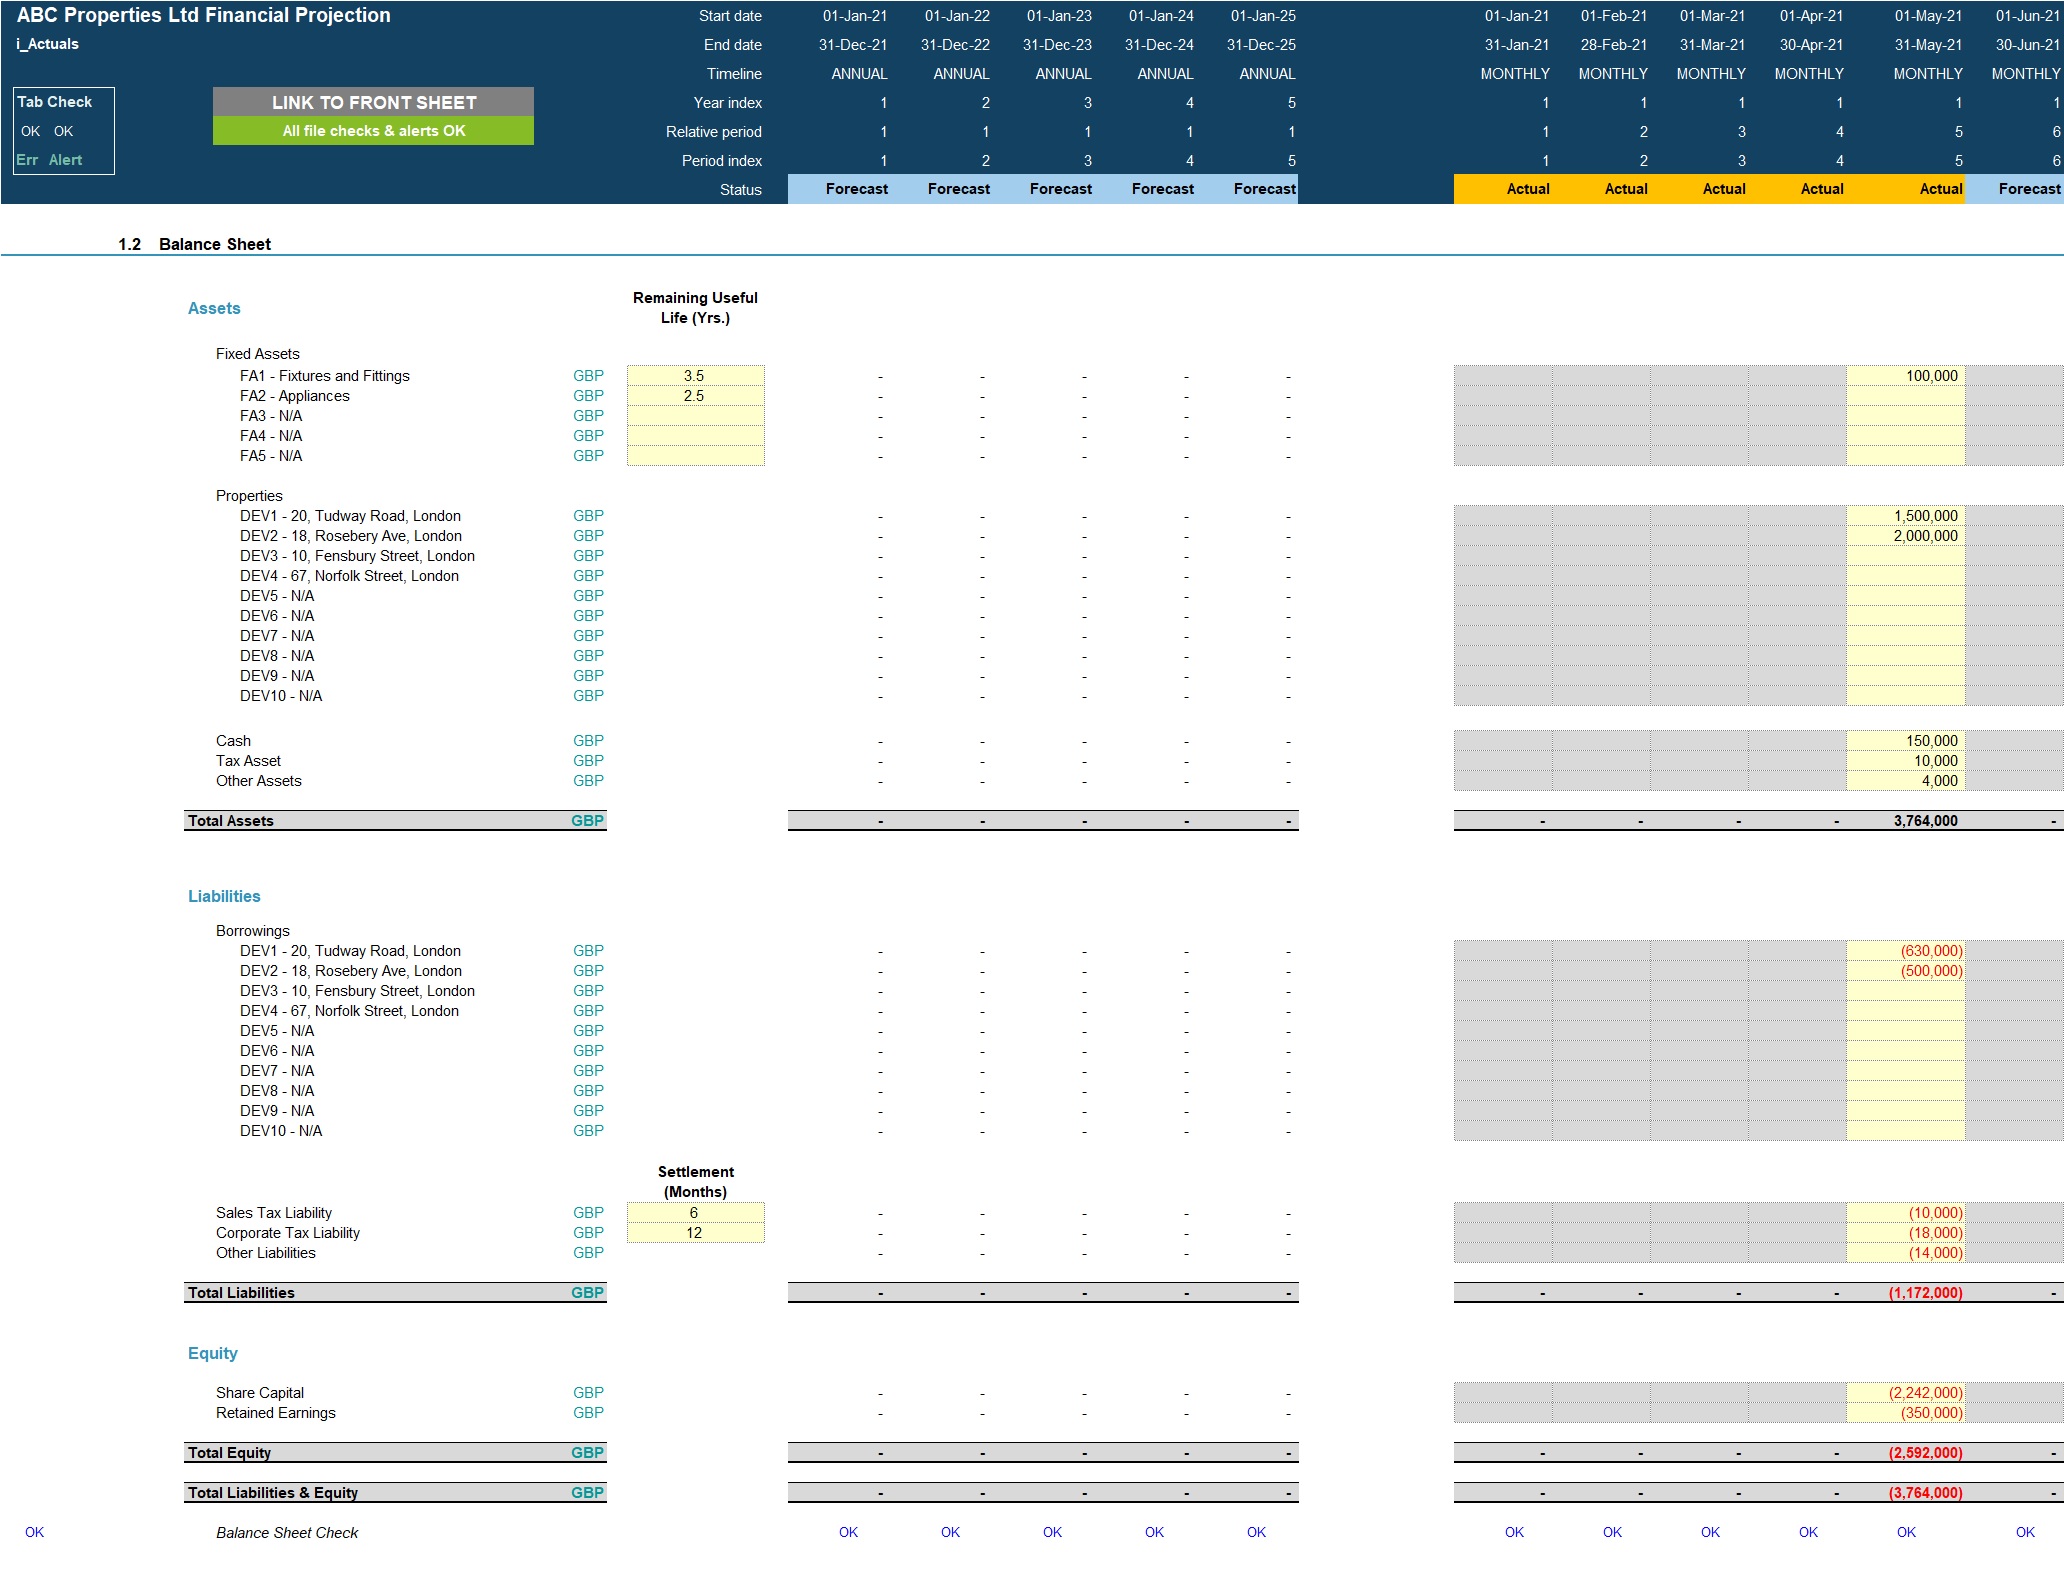
Actuals Inputs:
• Opening balance sheet (for existing businesses);
• Income Statement actuals (for trend analysis);
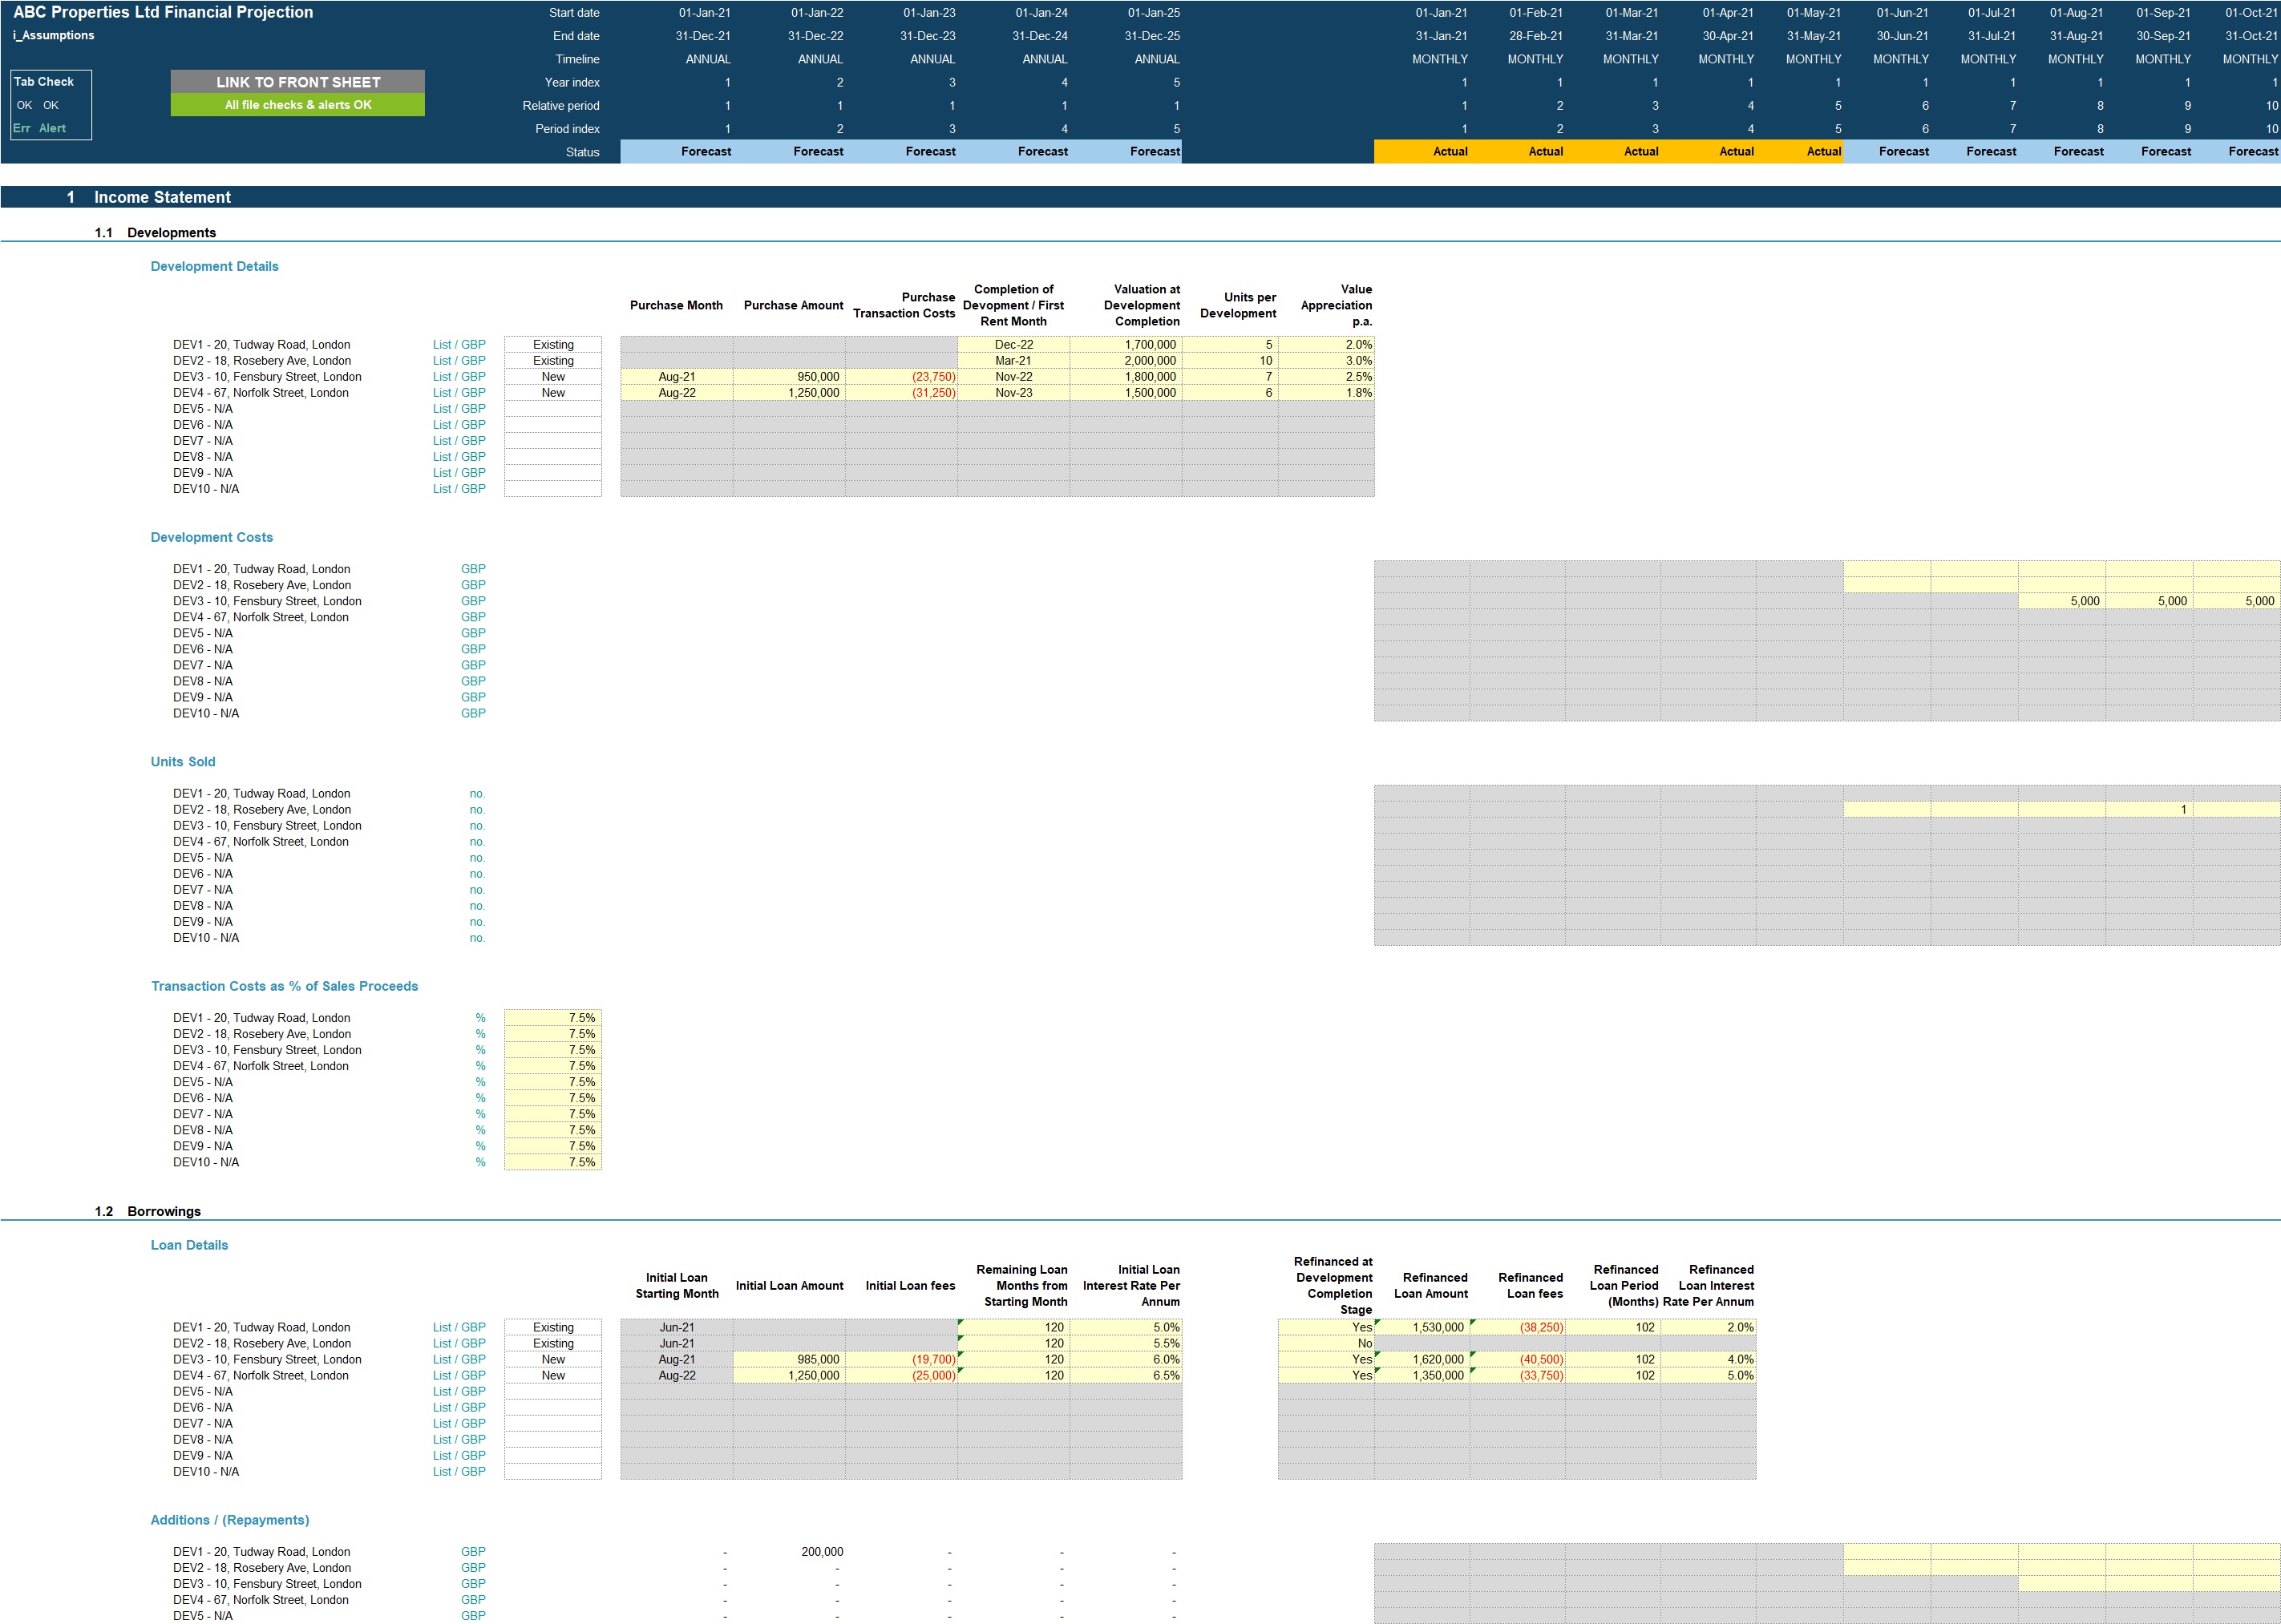
Projection Inputs:
• Property development, development costs, rental income and revenue from sales of units including purchase month, purchase amount, transactions costs, development/rehabilitation months, units per development, value appreciation per annum, occupancy, rent per month, units sold, and transaction costs per sale;
• Borrowings including addition amounts, fees, interest rates and respective refinancing inputs;
• Variable and fixed operating expenses across the lifecycle of each property development;
• Capitalisable costs including addition amounts and useful life;
• Other fixed cost inputs on total company basis;
• Sales and corporate tax inputs including rate and payment periods;
• Dividend inputs including amount or percentage of retained earnings and frequency;
• Share Capital additions;
• Discount rate inputs (for valuation calculation).
MODEL STRUCTURE
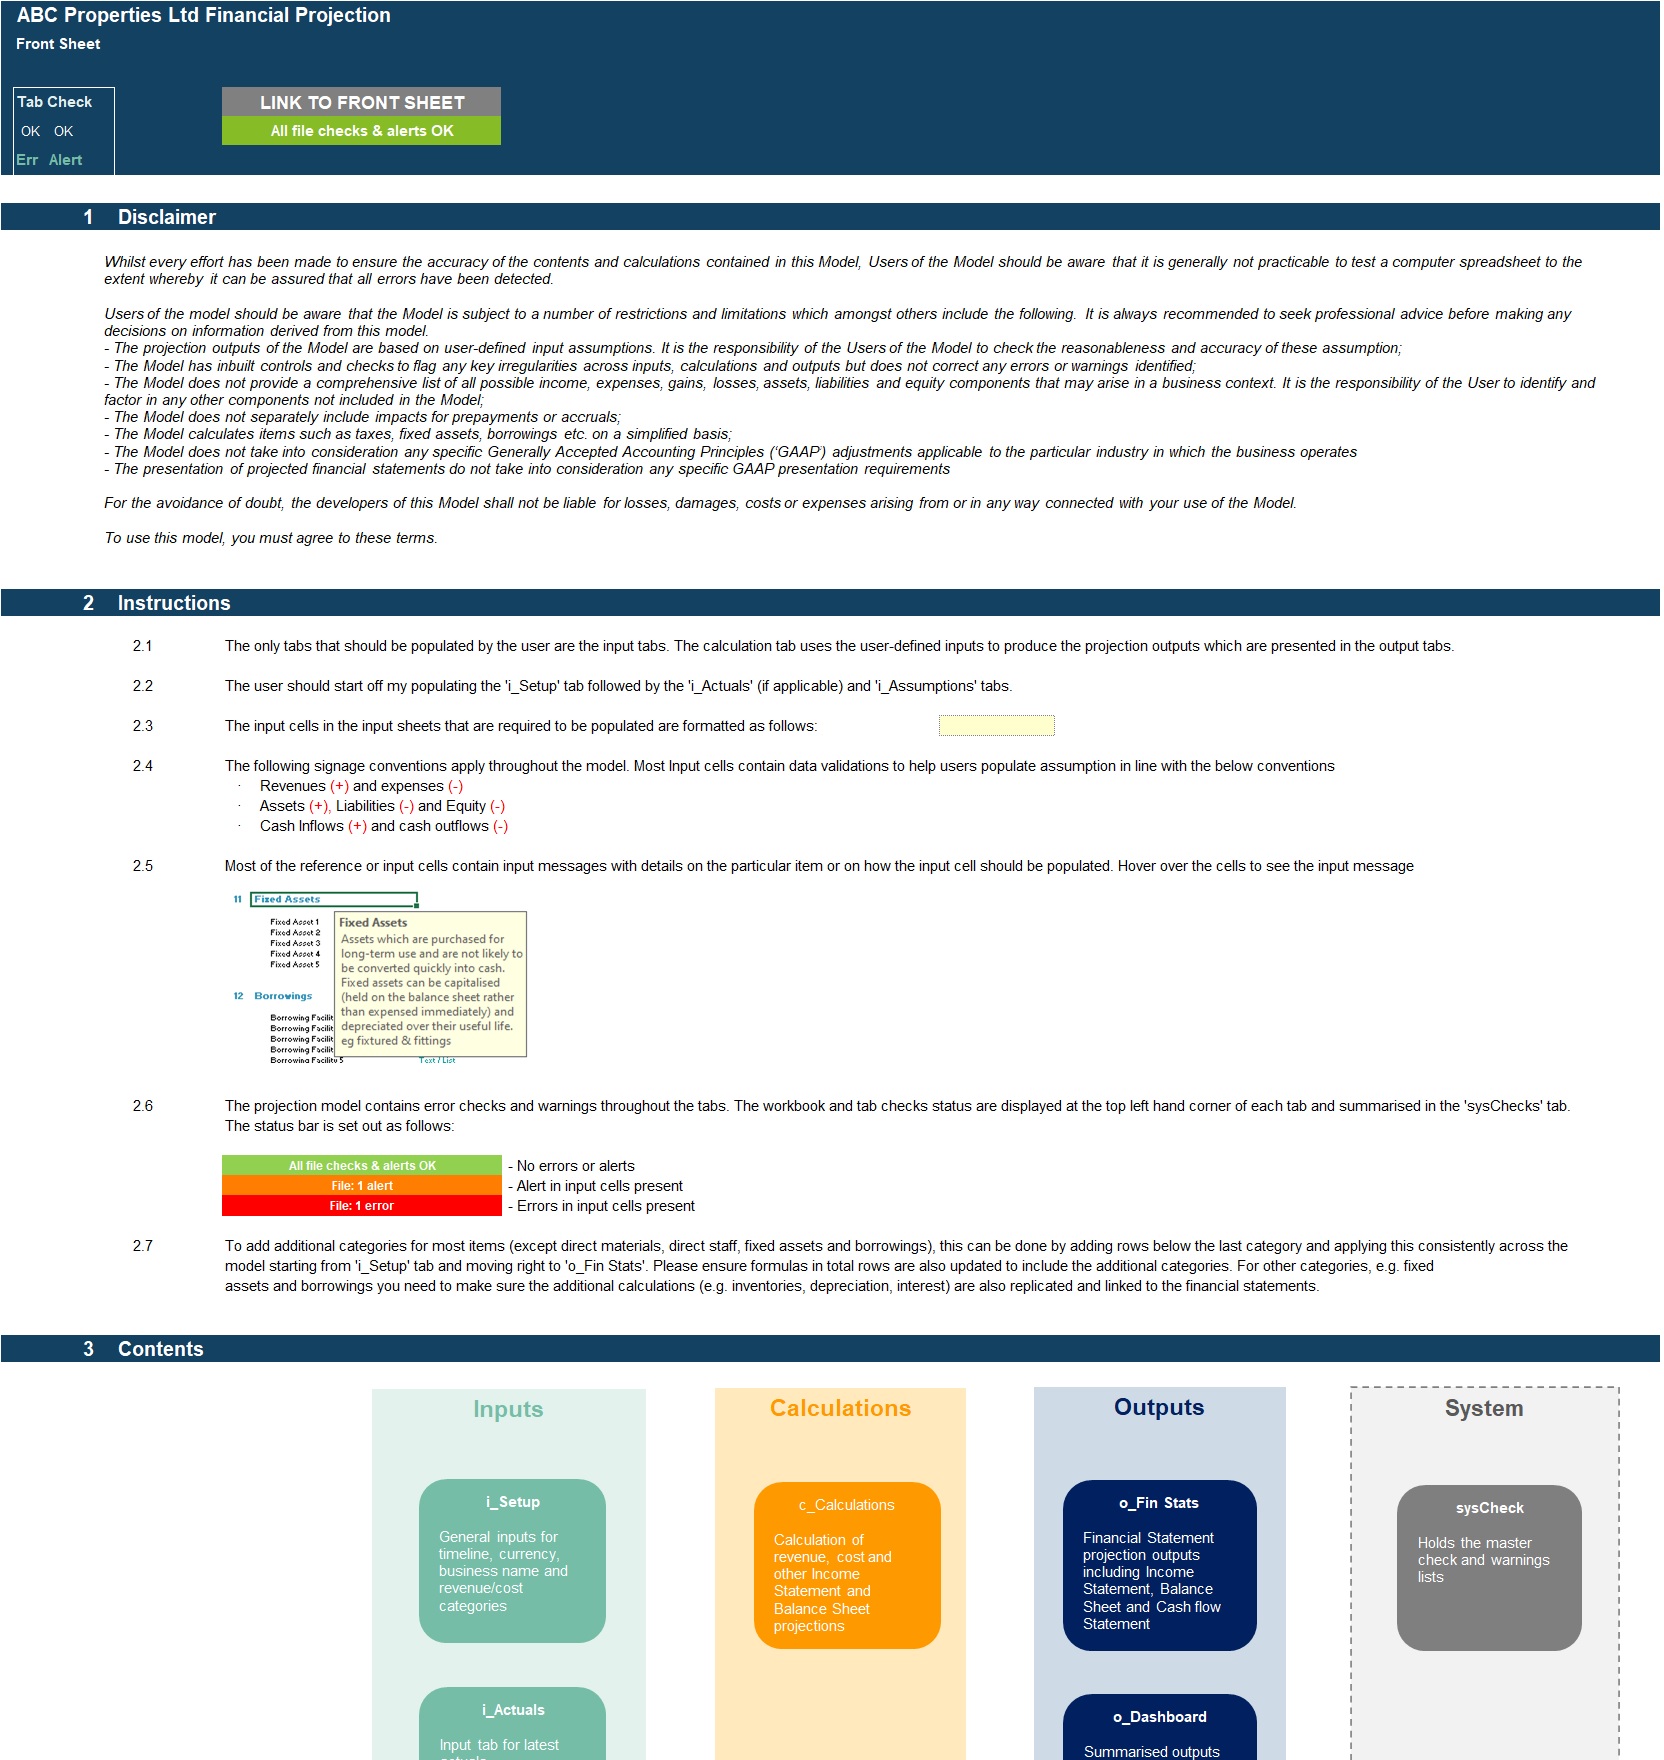
The model comprises of 9 tabs split into input ('i_'), calculation ('c_'), output ('o_') and system tabs. The tabs to be populated by the user are the input tabs ('i_Setup', ‘i_Actuals' and 'i_Assumptions'). The calculation tab uses the user-defined inputs to calculate and produce the projection outputs which are presented in 'o_Fin Stats', ‘o_Dashboard' and ‘o_DCF'.System tabs include:- A 'Front Sheet' containing a disclaimer, instructions and contents; – A checks dashboard containing a summary of checks by tab.
KEY FEATURES
Other key features of this model include the following:
• The model follows good practice financial modelling guidelines and includes instructions, line-item explanations, checks and input validations;
• The model contains a flexible timeline that allows for a mix of Actual and Forecast period across a 5-year period. This allows projections to be easily rolled forward;
• Timeline is split on a monthly basis and summarised on an annual basis;
• The model allows the user to model 10 existing or new property developments each with their own unique lifecycle, development costs, loans, rental income and revenue from sales of units;
• The model is not password protected;
• The model is reviewed using specialised model audit software to help ensure formula consistency and reduce risk of errors;
• The model allows for the following number of underlying categories for each line item (these can be easily expanded if required):
• Property developments – 10 developments with multiple units;
• Variable costs linked to rental income – 5 categories;
• Fixed costs per property unit – 5 categories;
• Fixed costs total company – 15 categories;
• Fixed Assets – 5 Categorieso Borrowings – 10 facilities (1 for each property development) each with refinancing option.
• Apart from projecting rental and unit sales income and expenses the model includes the possibility to model depreciation of capitalizable costs, borrowings, dividends and corporate and sales tax;
• Business Name, currency, starting projection period and volume units are fully customisable;
• Revenue, cost and fixed asset descriptions are fully customisable;
• The model included an integrated discounted cash flow valuation using the projected cash flow outputs;
• The model includes instructions, line-item explanations, checks and input validations to help ensure input fields are populated accurately;
• The model includes a checks dashboard which summarises all the checks included in the various tabs making it easier to identify any errors.
Got a question about the product? Email us at support@flevy.com or ask the author directly by using the "Ask the Author a Question" form. If you cannot view the preview above this document description, go here to view the large preview instead.
Source: Best Practices in Real Estate, Integrated Financial Model Excel: Buy, Rehab, Rent, Refinance, Repeat (BRRRR) Real Estate Investment 3 Statement Model Excel (XLSX) Spreadsheet, Projectify
ABOUT THE AUTHOR
We are financial modelling professionals, accountants and CFA charterholders with experience working within Deloitte supporting clients with their financial planning and decision support needs. Our aim is to provide robust and easy-to-use financial models that follow good practice financial modelling guidelines and assist individuals and businesses with key financial planning and analysis ... [read more]
Ask the Author a Question
You must be logged in to contact the author.
