
Buy Now Pay Later DCF Model & Valuation (10 Year DCF Model) – Excel XLSX
Excel (XLSX)
BENEFITS OF THIS DOWNLOADABLE EXCEL DOCUMENT
- Informed Decision Making: The BNPL Company financial model empowers executives to make data-driven decisions regarding pricing strategies and resource allocation.
- Budgeting and Cost Control: By providing a comprehensive overview of expenses and potential revenues, the model assists in budgeting and cost control measures, optimizing profitability.
- Growth Planning: Financial projections generated by the model support growth planning, allowing BNPL companies to assess the potential outcomes of expanding user base.
FINTECH EXCEL DESCRIPTION
The Buy Now Pay Later (BNPL) Company financial model is a comprehensive tool designed to analyze the financial aspects of a BNPL business. It encompasses key components such as revenue streams, transaction volumes, fees, and financial projections. This model provides insights into the financial performance of the BNPL company, enabling informed decision-making, risk management, budgeting, and growth planning.
Key Components:
• Revenue Streams: The model assesses revenue sources from merchant fees, late payment charges, and transactions' fees.
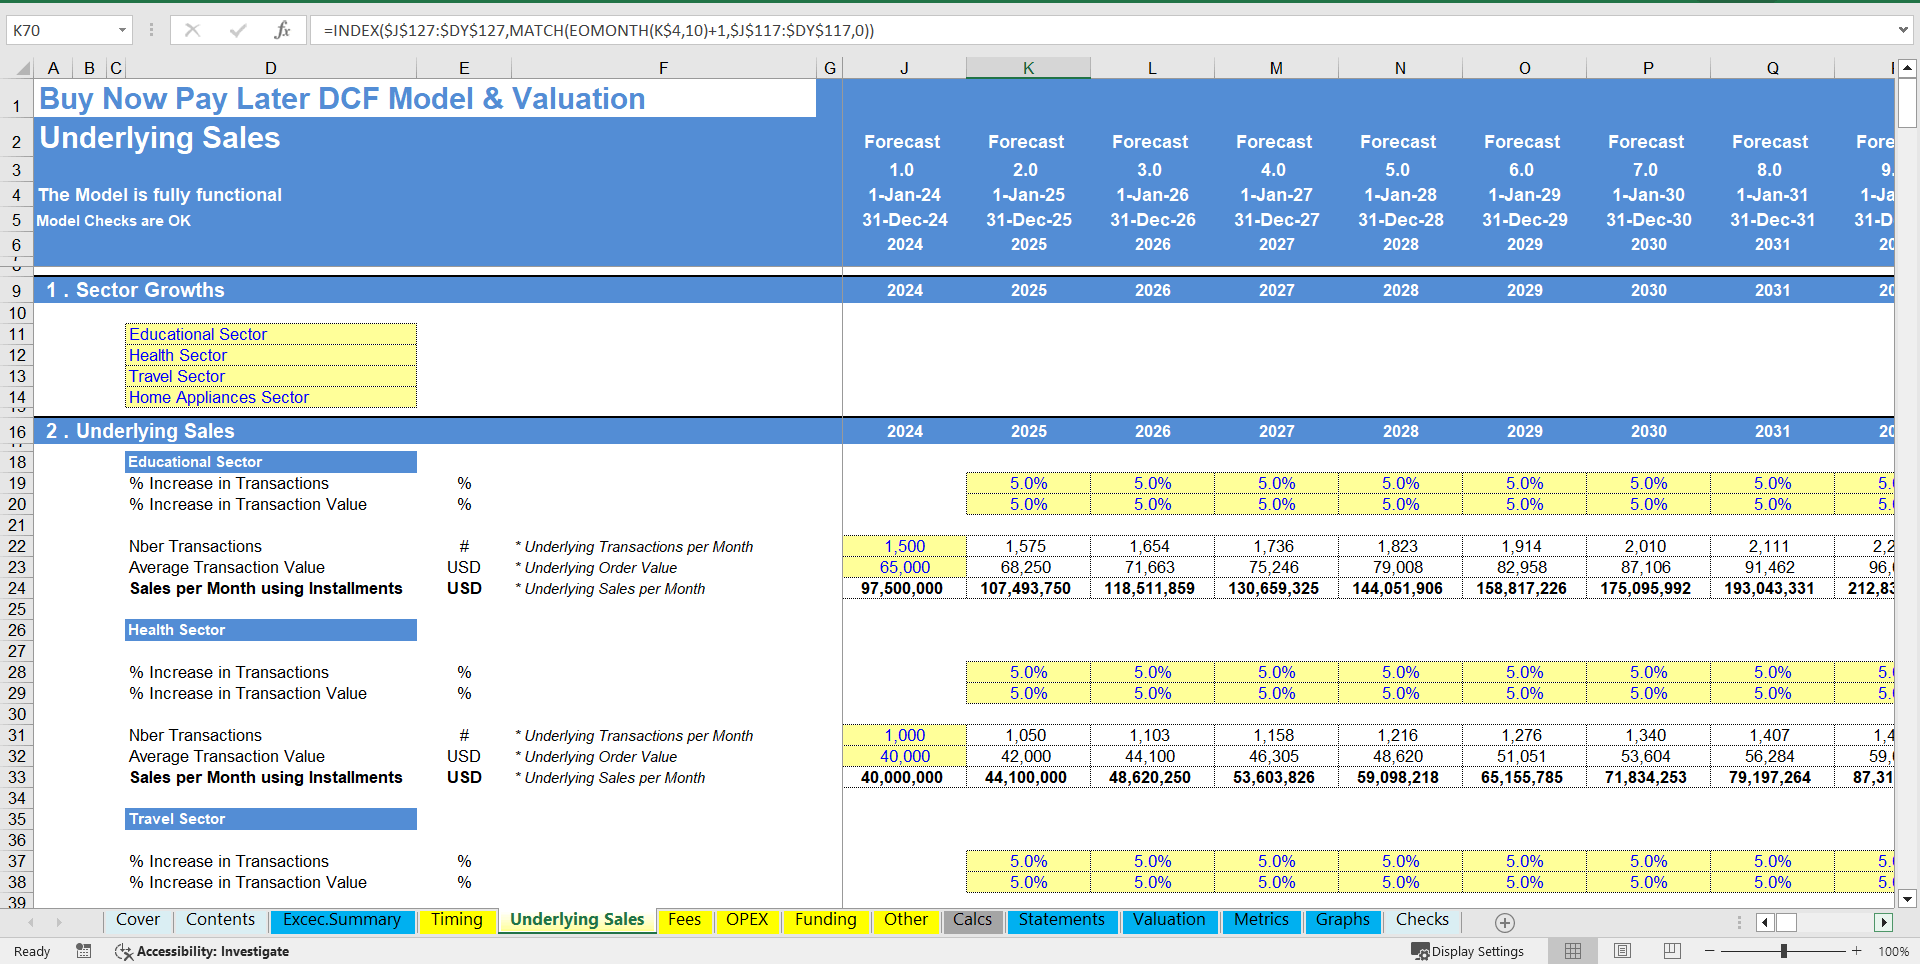
• Transaction Volumes: It considers the volume of transactions processed through the BNPL platform over four different sectors. Each sector has its own assumptions.
• Financial Projections: It generates forecasts for revenue, expenses, profit margins, and cash flow, allowing stakeholders to assess the financial health and growth potential of the BNPL company.
Key Benefits:
• Informed Decision Making: The BNPL Company financial model empowers executives to make data-driven decisions regarding pricing strategies and resource allocation.
• Risk Management: By evaluating provisions for credit losses, the model supports risk management measures, ensuring financial stability and compliance with regulatory requirements.
• Budgeting and Cost Control: By providing a comprehensive overview of expenses and potential revenues, the model assists in budgeting and cost control measures, optimizing profitability.
• Growth Planning: Financial projections generated by the model support growth planning, allowing BNPL companies to assess the potential outcomes of expanding user base.
In summary, the BNPL Company financial model offers valuable insights into the financial performance and growth potential of a Buy Now Pay Later business. It supports informed decision-making, risk management, budgeting, and growth planning, all of which contribute to the success and profitability of the BNPL company.
——————————————————————————————————————————————————————————
MODEL GUIDELINES
So, a quick overview of the model, in the contents tab you can see the structure of the model and by clicking on any of the headlines to be redirected to the relevant worksheet.
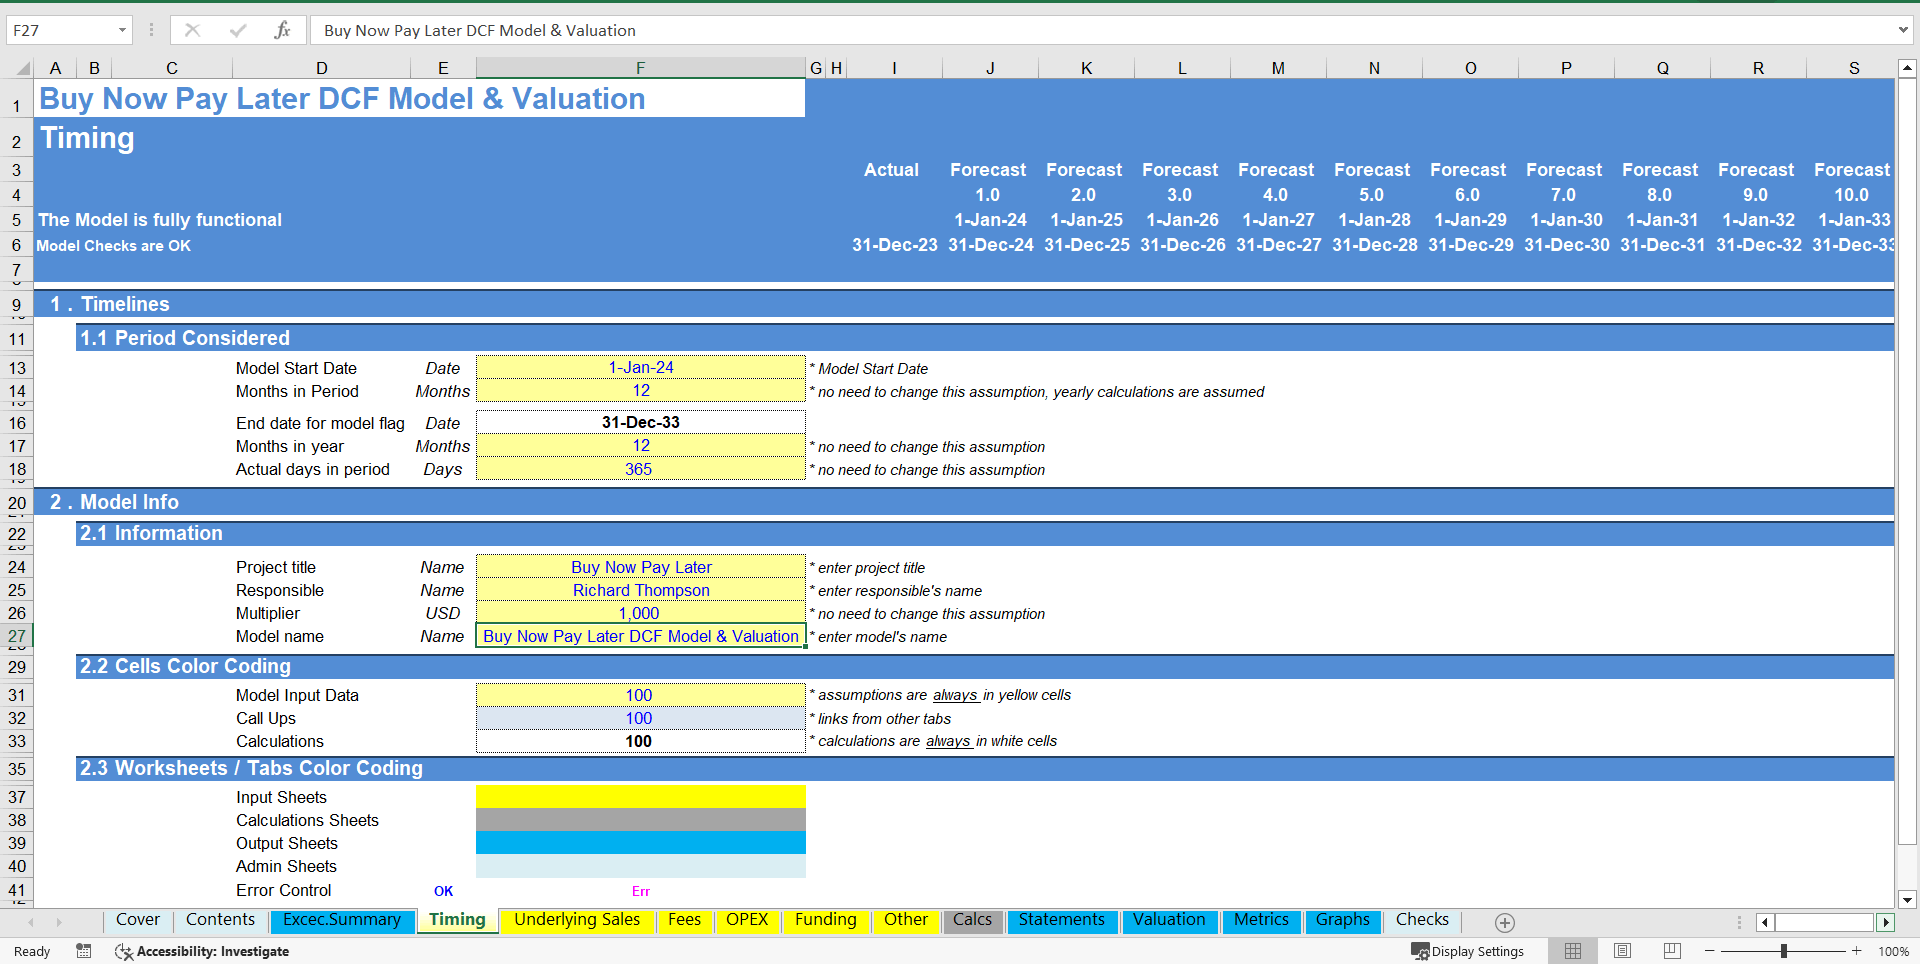
On the manual tab you can feed the general information for the model such as: project name & title, responsible, timeline of the model and date and currency conventions.
Additionally, there is a description of the color coding of the model in the same tab. Inputs are always depicted with a yellow fill and blue letters, call up (that is direct links from other cells) are filled in light blue with blue letters while calculations are depicted with white fill and black characters.
There is also color coding for the various tabs of the model. Yellow tabs are mostly assumptions tabs, grey tabs are calculations tabs, blue tabs are outputs tabs (that is effectively results or graphs) and finally light blue tabs are admin tabs (for example: the cover page, contents, and checks).
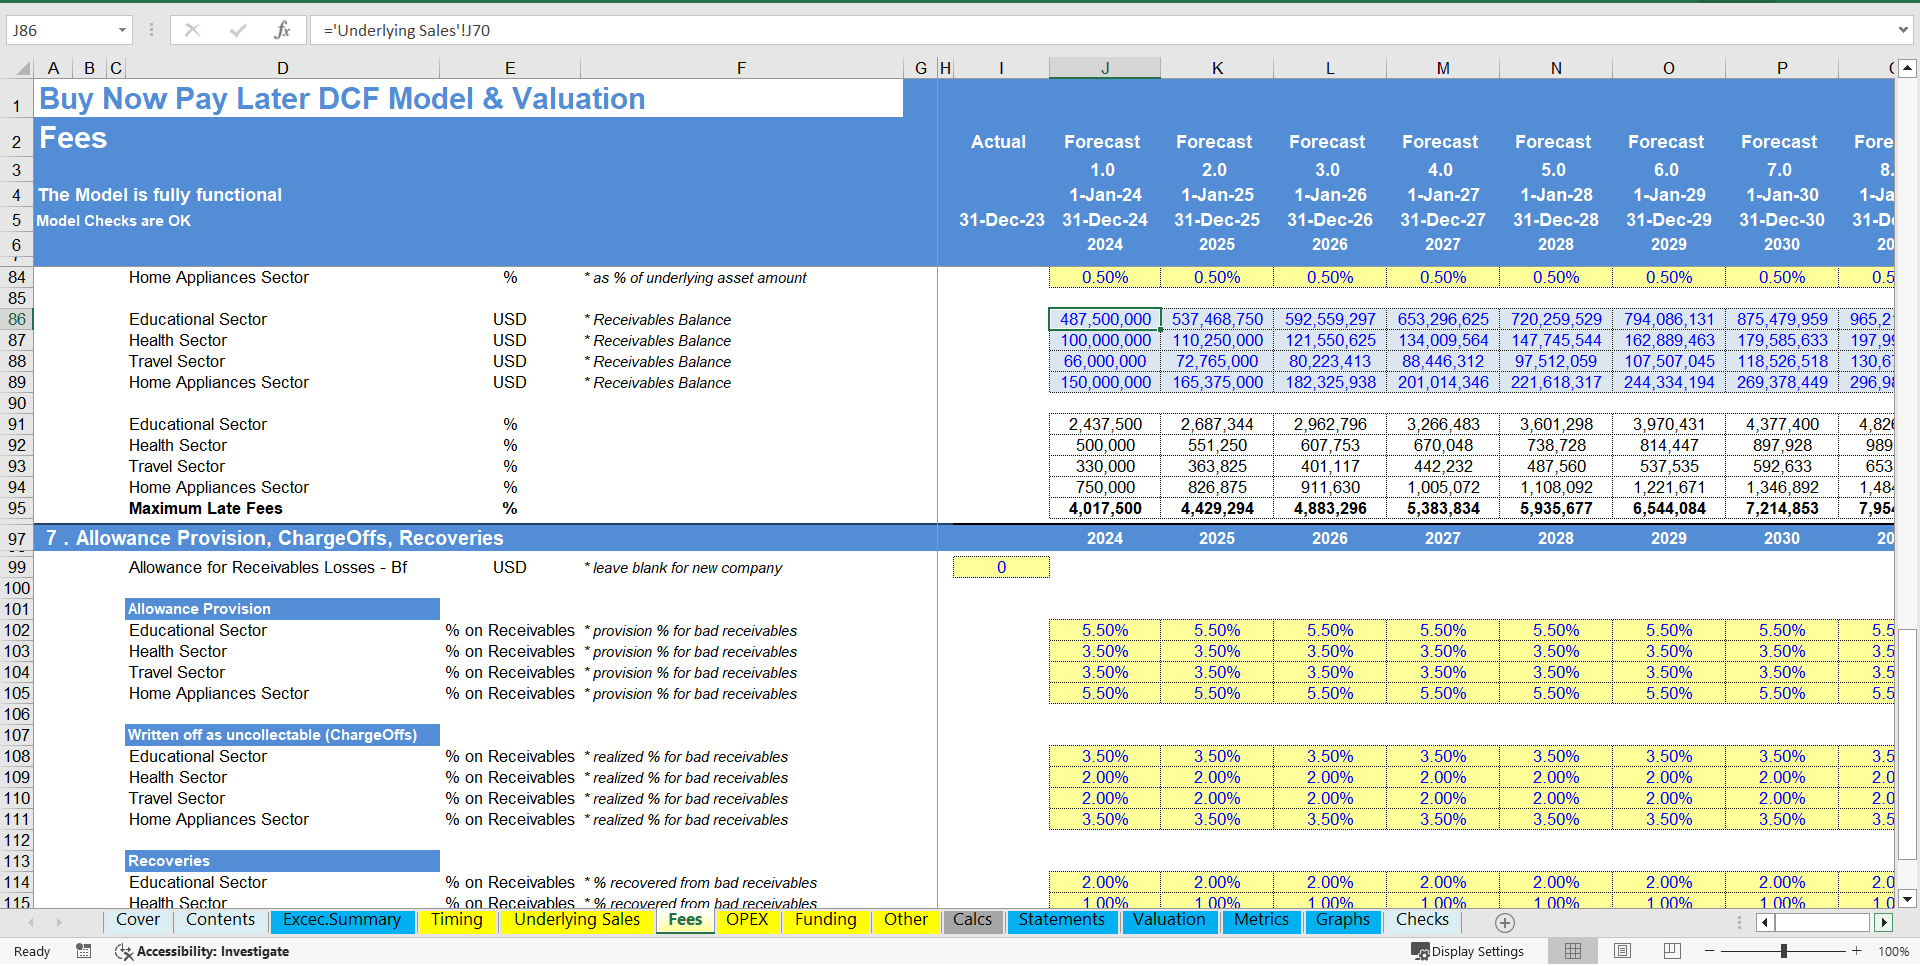
Moving on to the inputs (inputs have been separated into several tabs based on the inputs needed such as sales, costs, SG&A, etc.). Detailed inputs for revenues are located in the underlying sales tab where the user can set the number of transactions and average transaction value, and in the fees tab, where the user can set the fees to merchants, as well as transactions fees, late fees and allowance provisions.
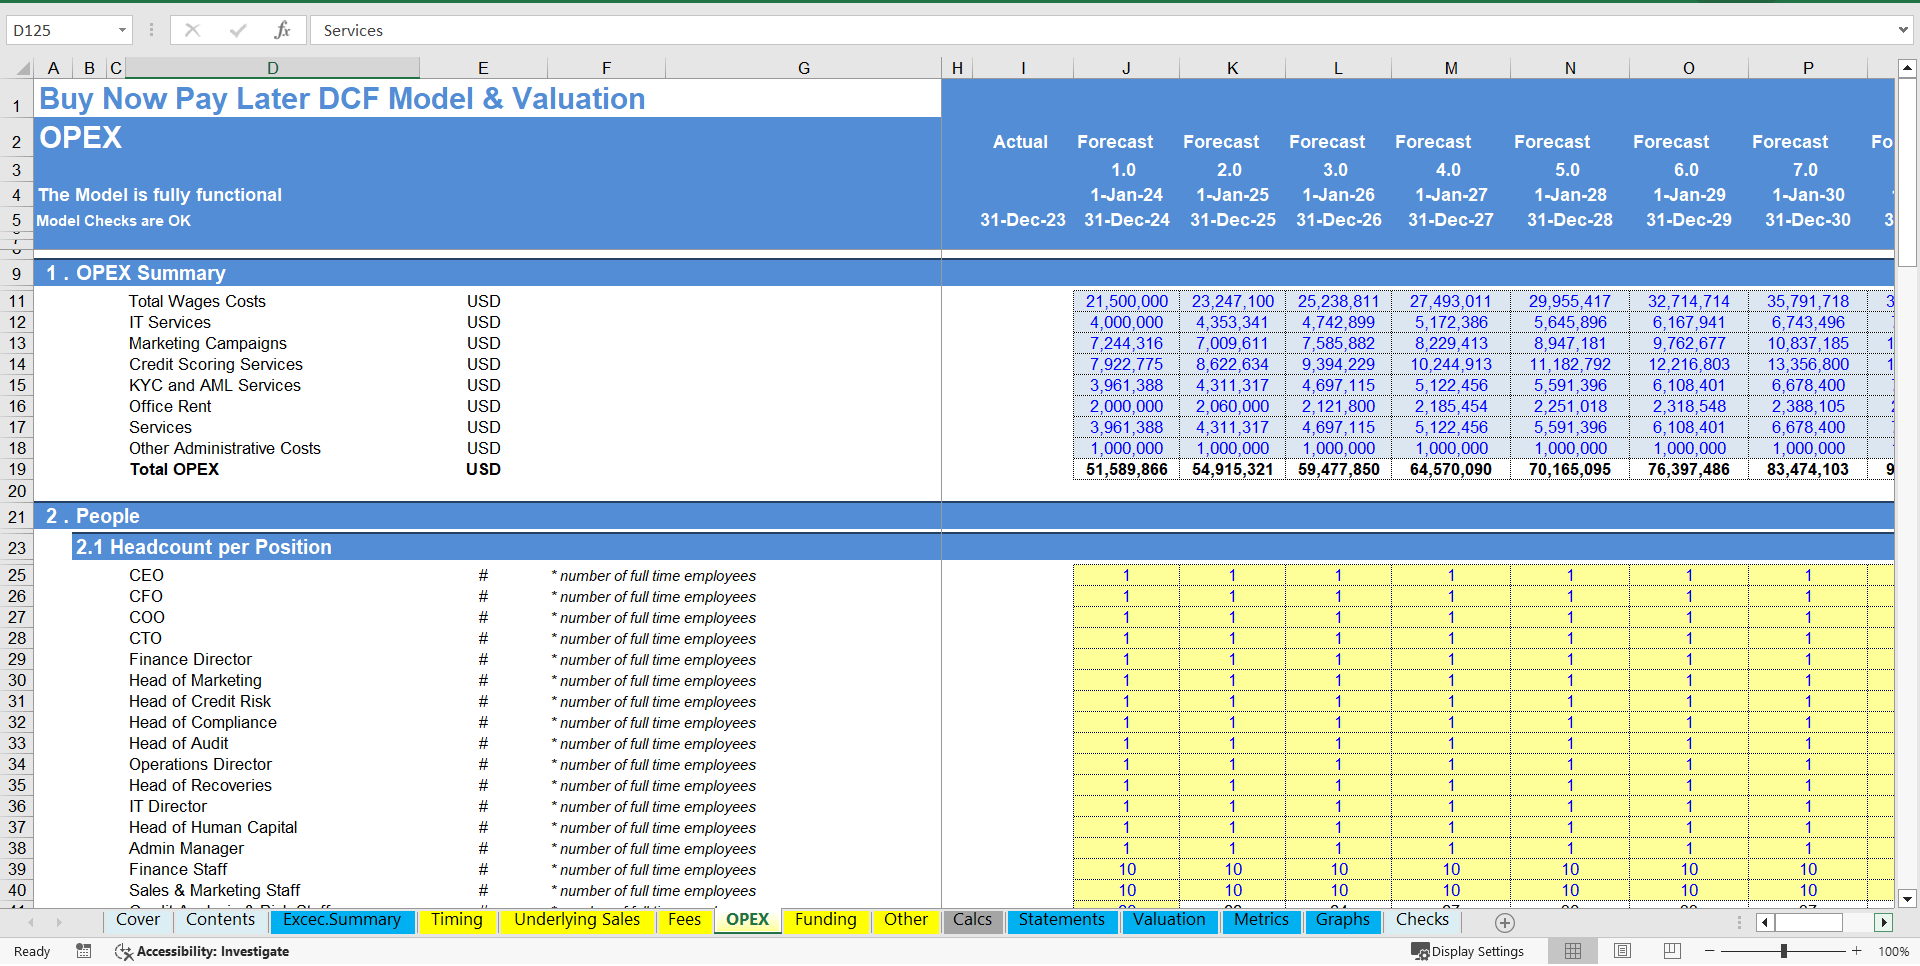
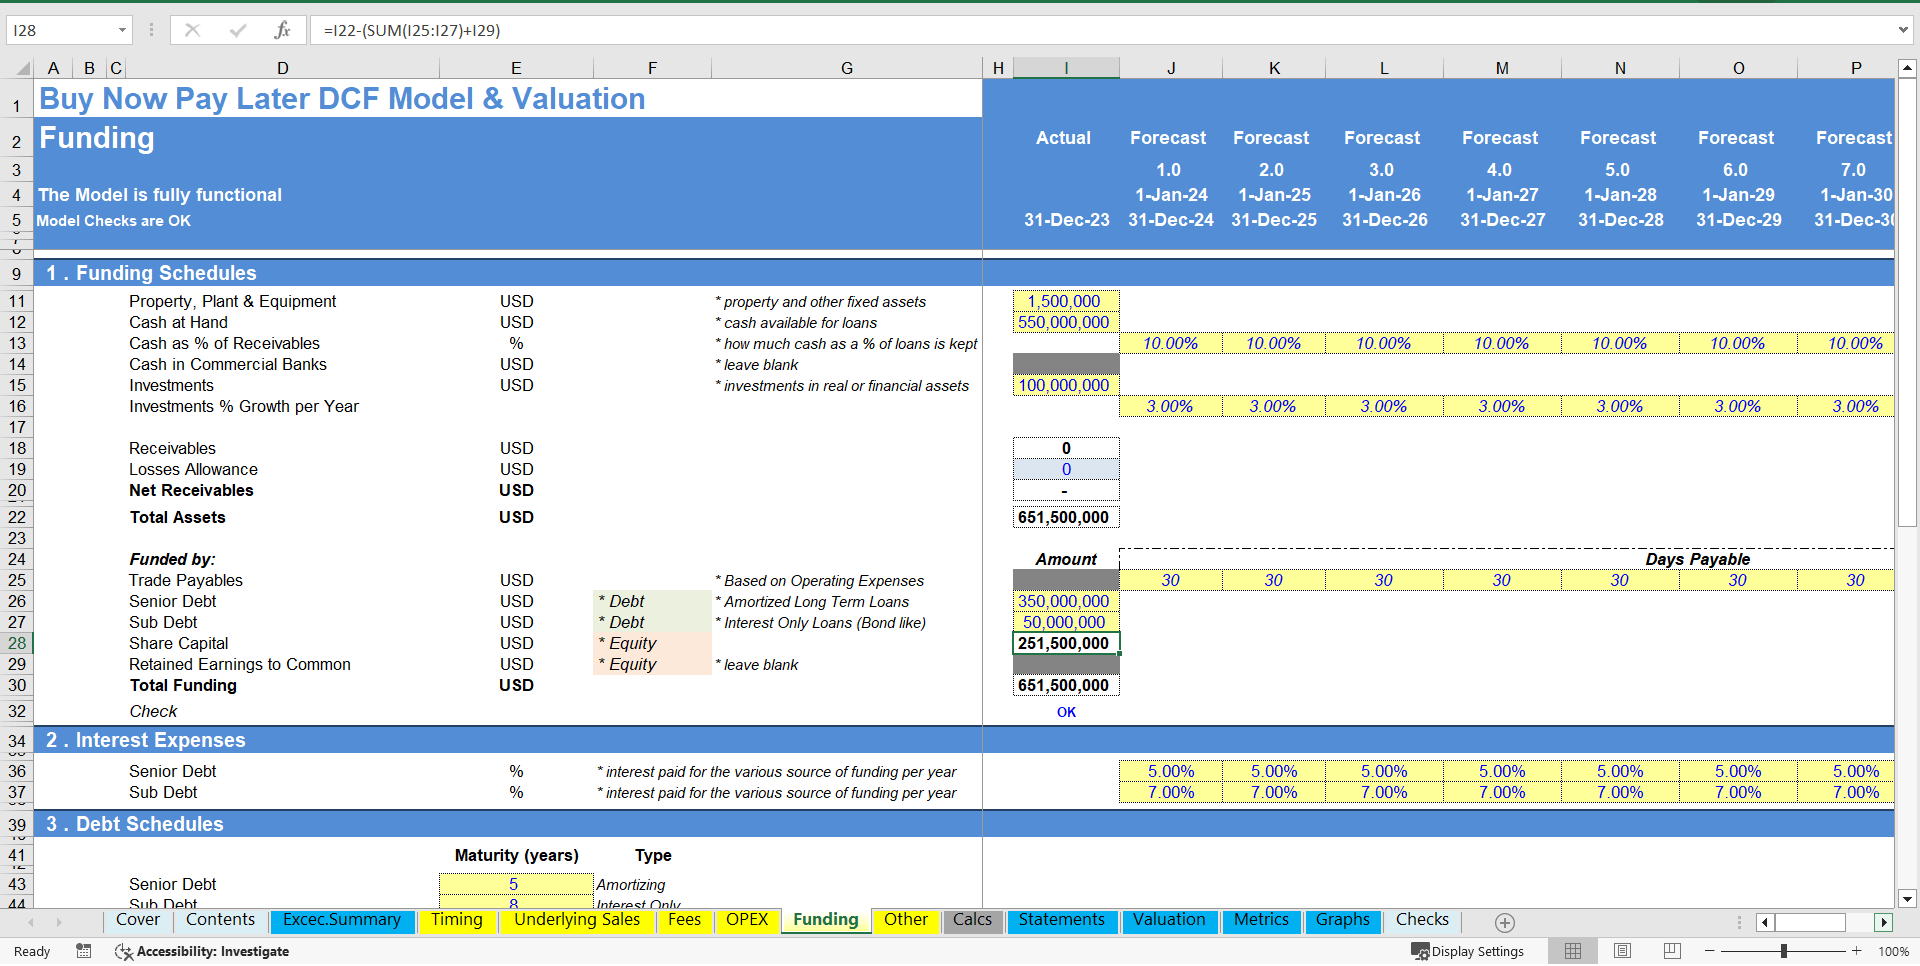
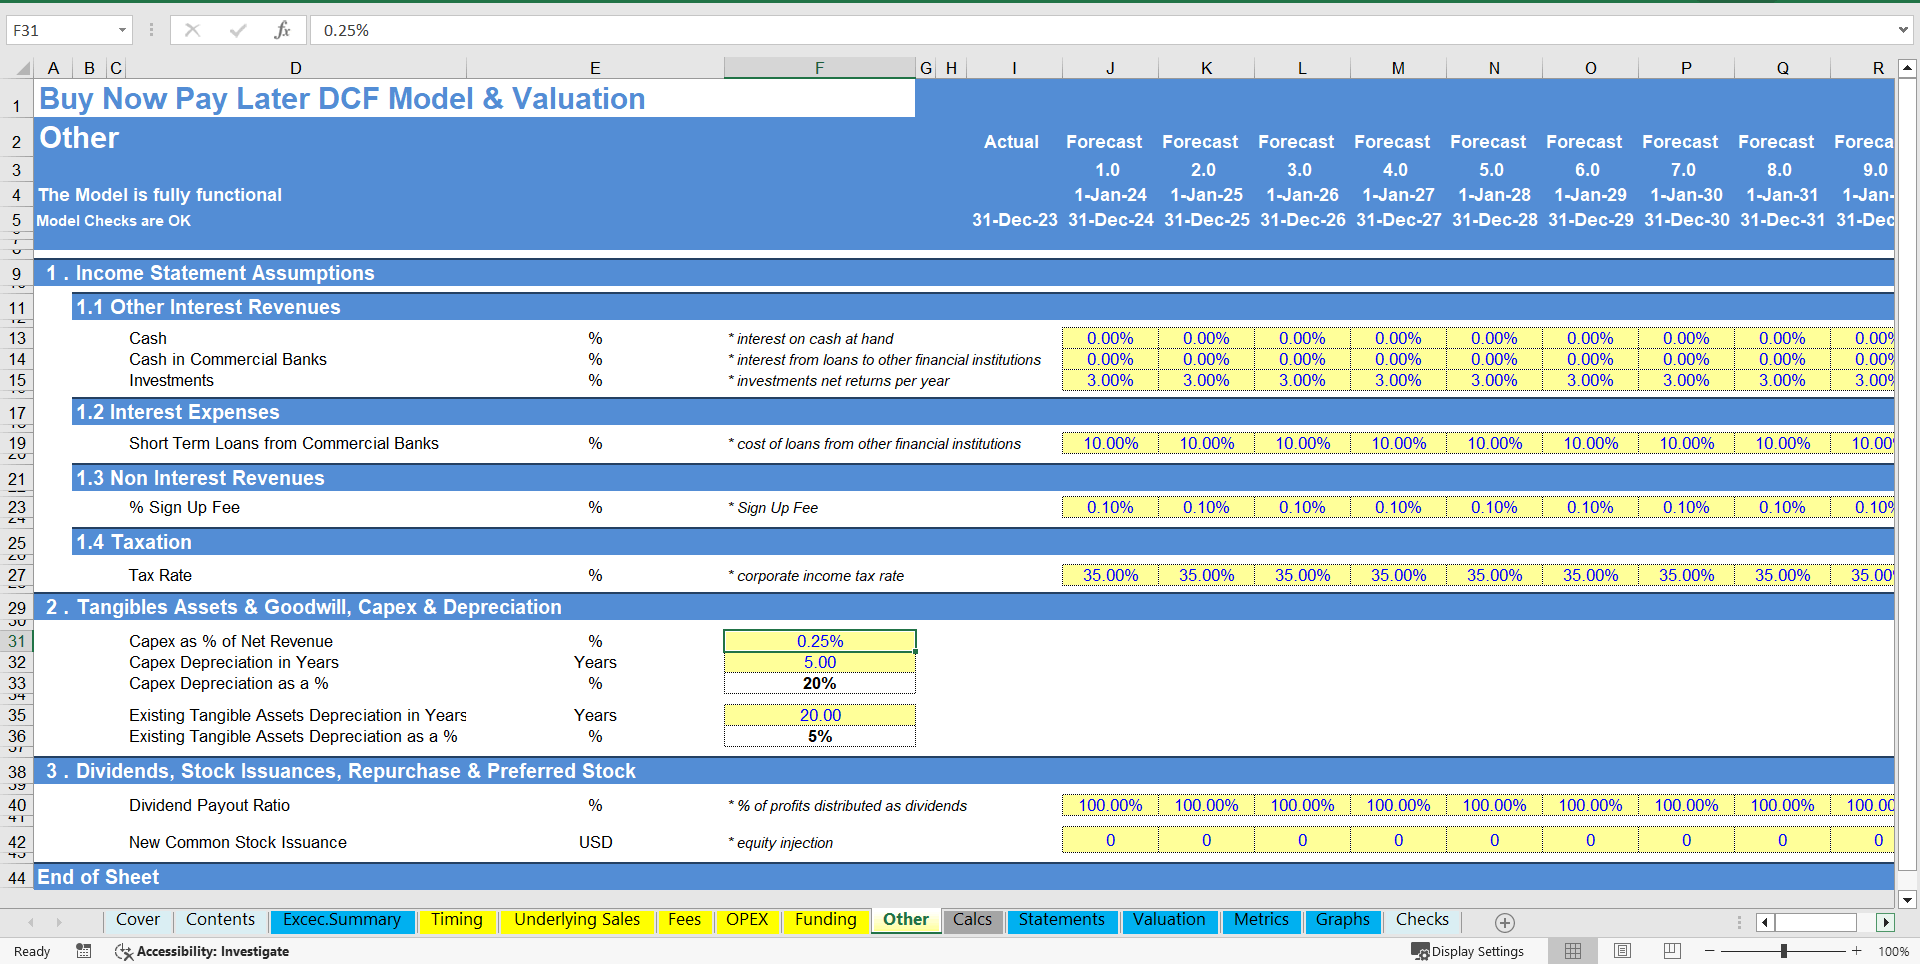
The costs are in the OPEX tab and are split between payroll costs and other admin and operating expenses costs (IT Services, Marketing Campaigns, Credit Scoring Services, KYC and AML Services, Office Rent, Services, Other Administrative Costs). Funding assumptions in the "Funding" tab (debt & equity financing), and other assumptions in the "Other" tab (capex and depreciation, taxation, dividends, and other income statement assumptions).
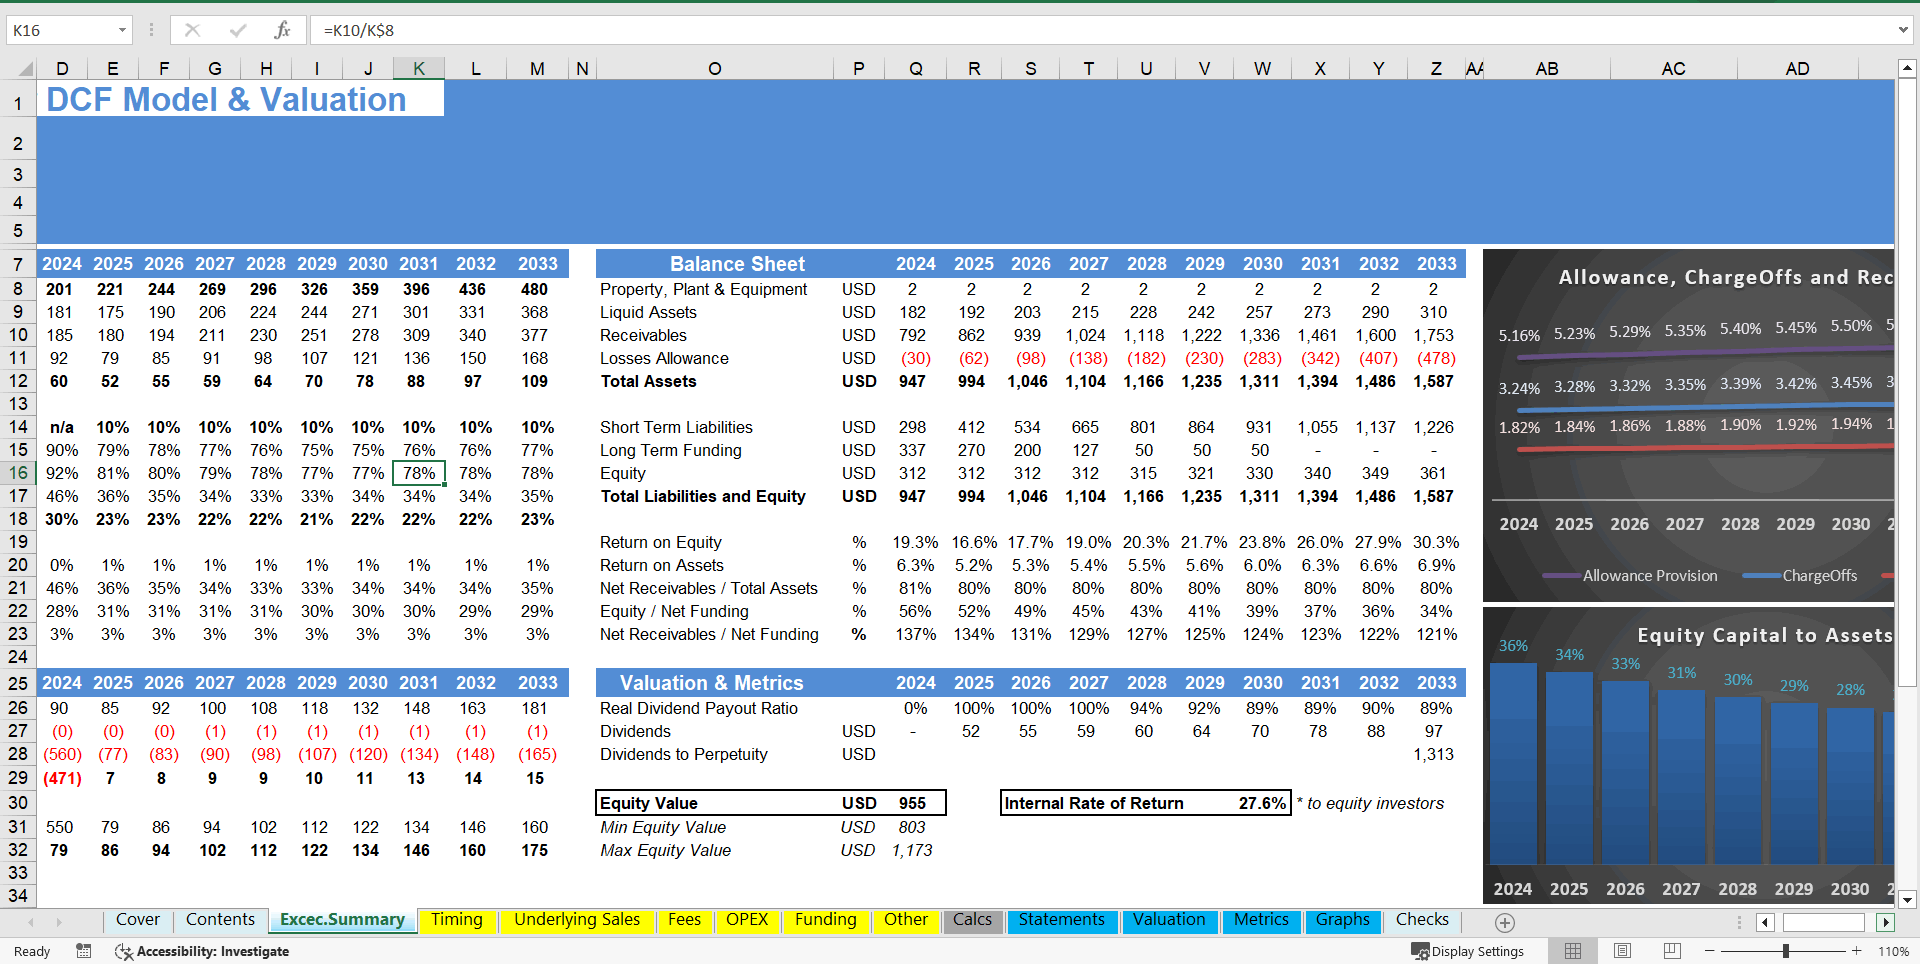
In the Exec. Summary tab, you can see a high-level report with the main metrics and value drivers of the model. It can be readily printed on one page for your convenience.
Calculations: this is where all calculations are performed. The revenues are calculated and deducting the operating costs adjusted for inflation the operating profit is resulting. Based on the assets financed and the gearing of the financing the interest and depreciation are occurring. By using the working capital assumptions, the impact of the business cycle is presented. Finally, depending on the level of the investment considered the relevant debt financing is calculated (Long term debt and overdraft).
In the Financials tab: everything is aggregated here into the relevant statements: profit and loss, balance sheet and cash flow.
Moving to the Valuation tab, a valuation is performed by using the discounted dividends method and then a series of investment metrics are presented (Equity Value, Internal Rate of Return, Cash on Cash).
In the Graphs tab: Various graphs present the business metrics, revenues, operating costs, and profitability. Then multiple charts present the cash flows which results in a valuation.
Checks: A dedicated worksheet that makes sure that everything is working as it should!
Important Notice: Yellow indicates inputs and assumptions that the user can change, blue cells are used for called up cells, and white cells with black characters indicates calculation cells.
Got a question about the product? Email us at support@flevy.com or ask the author directly by using the "Ask the Author a Question" form. If you cannot view the preview above this document description, go here to view the large preview instead.
Source: Best Practices in Fintech, Integrated Financial Model Excel: Buy Now Pay Later DCF Model & Valuation (10 Year DCF Model) Excel (XLSX) Spreadsheet, Big4WallStreet
ABOUT THE AUTHOR
We help small and midsize businesses' leaders with their strategic problems by creating or improving financial models, implementing tools to drive efficiency, performance, and better decision making.
With over 15 years of experience in Financial & Business Modeling / Planning, Performance & Analysis (Ernst & Young, Toyota, Viohalco and Upstream), we have developed strong business
... [read more]
Ask the Author a Question
You must be logged in to contact the author.
