
Airline Operator Financial Model – Excel XLSX
Excel (XLSX)
BENEFITS OF THIS DOWNLOADABLE EXCEL DOCUMENT
- Presents the case of a company operating an airline business.
- Generates the three financial statements, a summary page, a valuation as well as graphs.
- The financing options for the project include a standard long term loan, as well as an overdraft facility and of course equity funding from investors.
AIRLINE INDUSTRY EXCEL DESCRIPTION
Airline Operator Financial Model presents the case of a company operating an airline business. The model generates the three financial statements, a summary page, a valuation as well as graphs. The financing options for the project include a standard long term loan, as well as an overdraft facility and of course equity funding from investors.
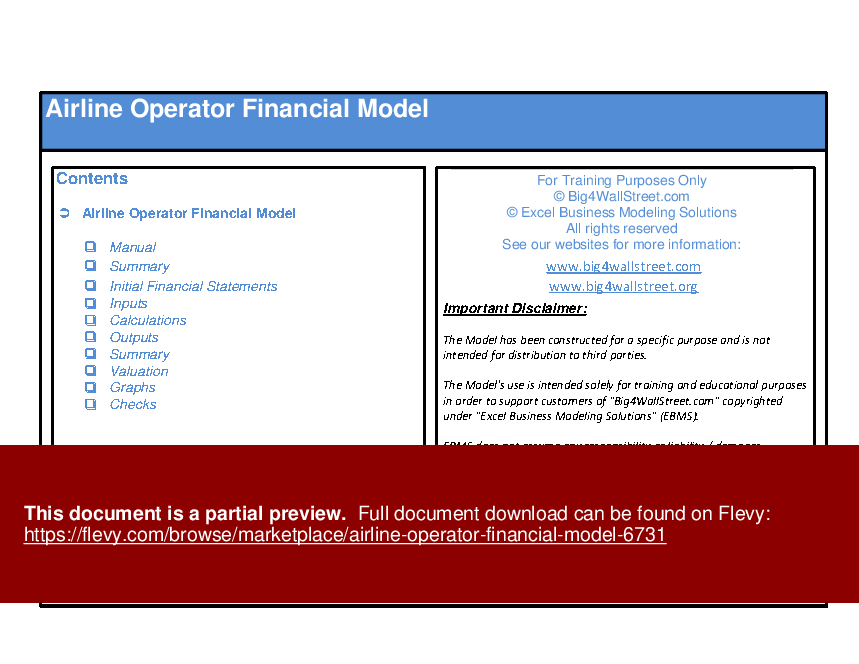
So a quick overview of the model, in the contents tab you can see the structure of the model and by clicking on any of the headlines to be redirected to the relevant worksheet.
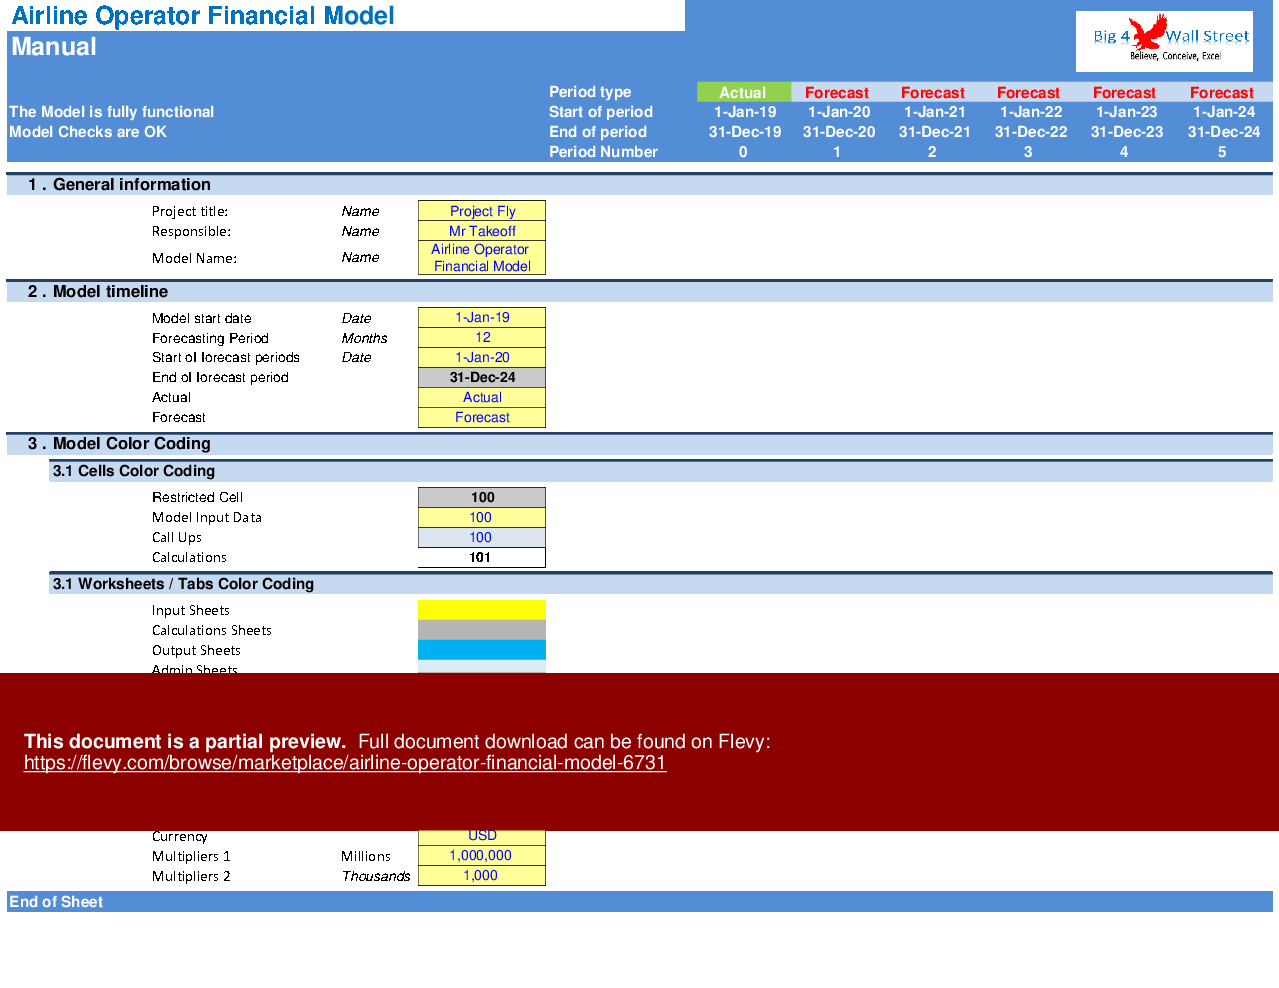
On the manual tab, you are able to feed the general information for the model such as: project name & title, responsible, timeline of the model and date and currency conventions.
Additionally, there is a description of the color-coding of the model in the same tab. Inputs are always depicted with a yellow fill and blue letters, call up (that is direct links from other cells) are filled in light blue with blue letters while calculations are depicted with white fill and black characters.
There is also a color coding for the various tabs of the model. Yellow tabs are mostly assumptions tabs, grey tabs are calculations tabs, blue tabs are outputs tabs (that is effectively results or graphs) and finally, light blue tabs are admin tabs (for example: the cover page, contents, and checks).
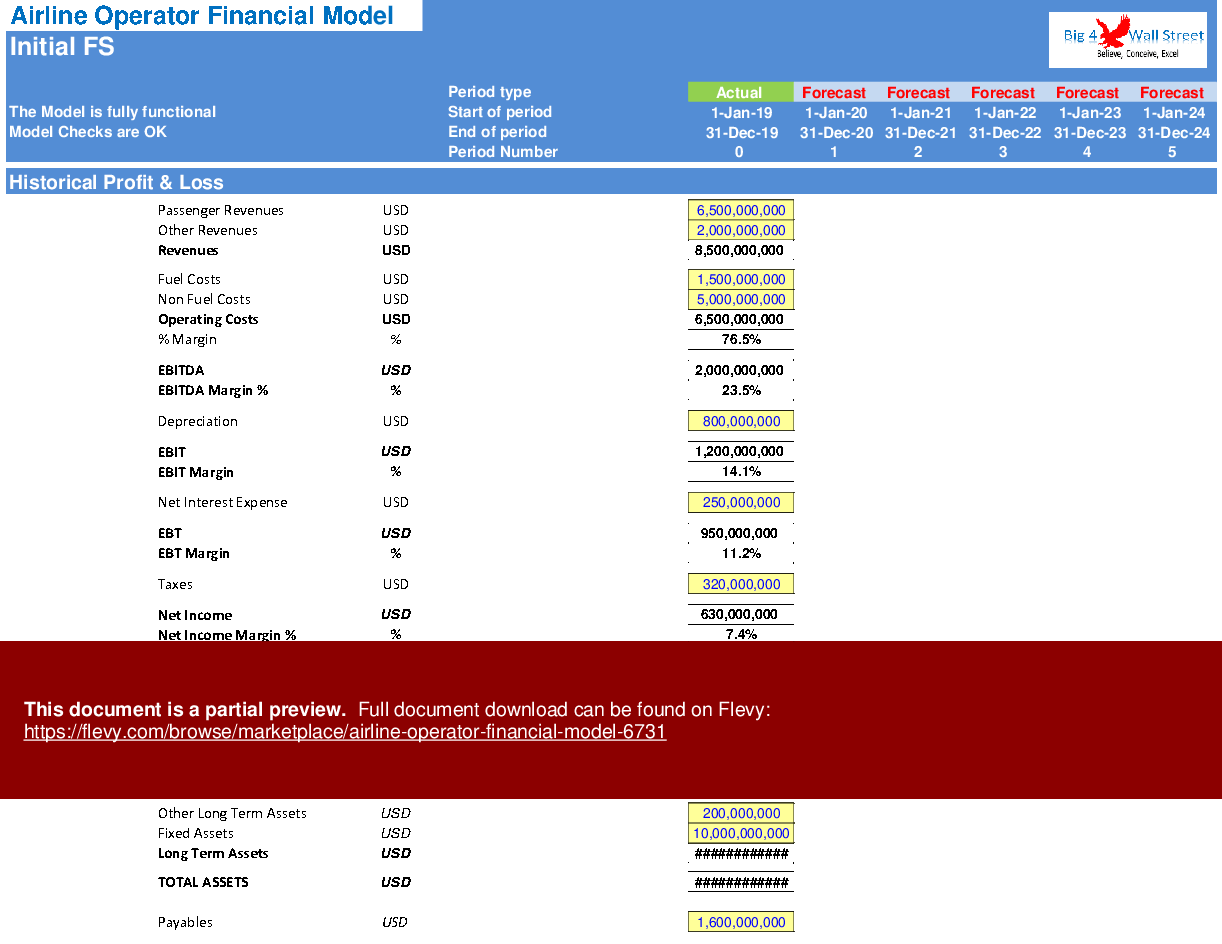
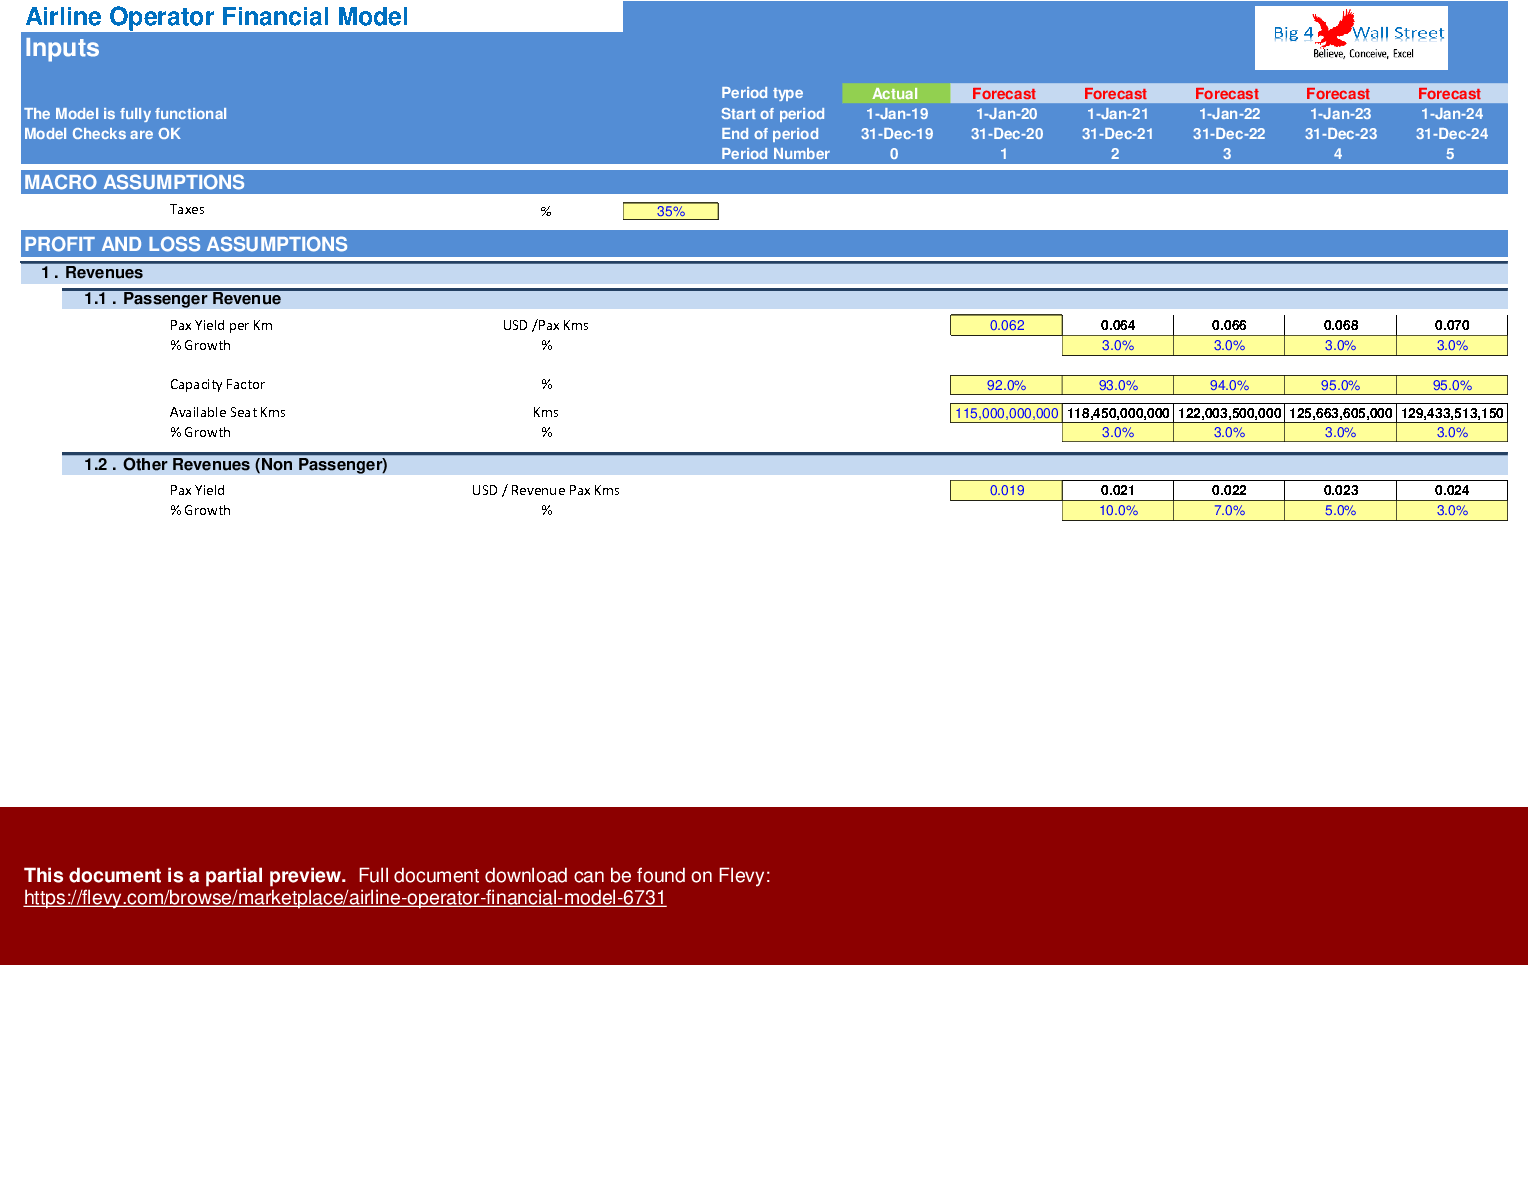
Moving on to the Inputs: the assumptions are split into two tabs: the historical financial statements, and the general forecast inputs of the business. In the historical profit & loss tab, the user needs to adjust the financial statements to match with the historical ones. Only the yellow cells need to be filled and the balance sheet is balanced through the retained earnings.
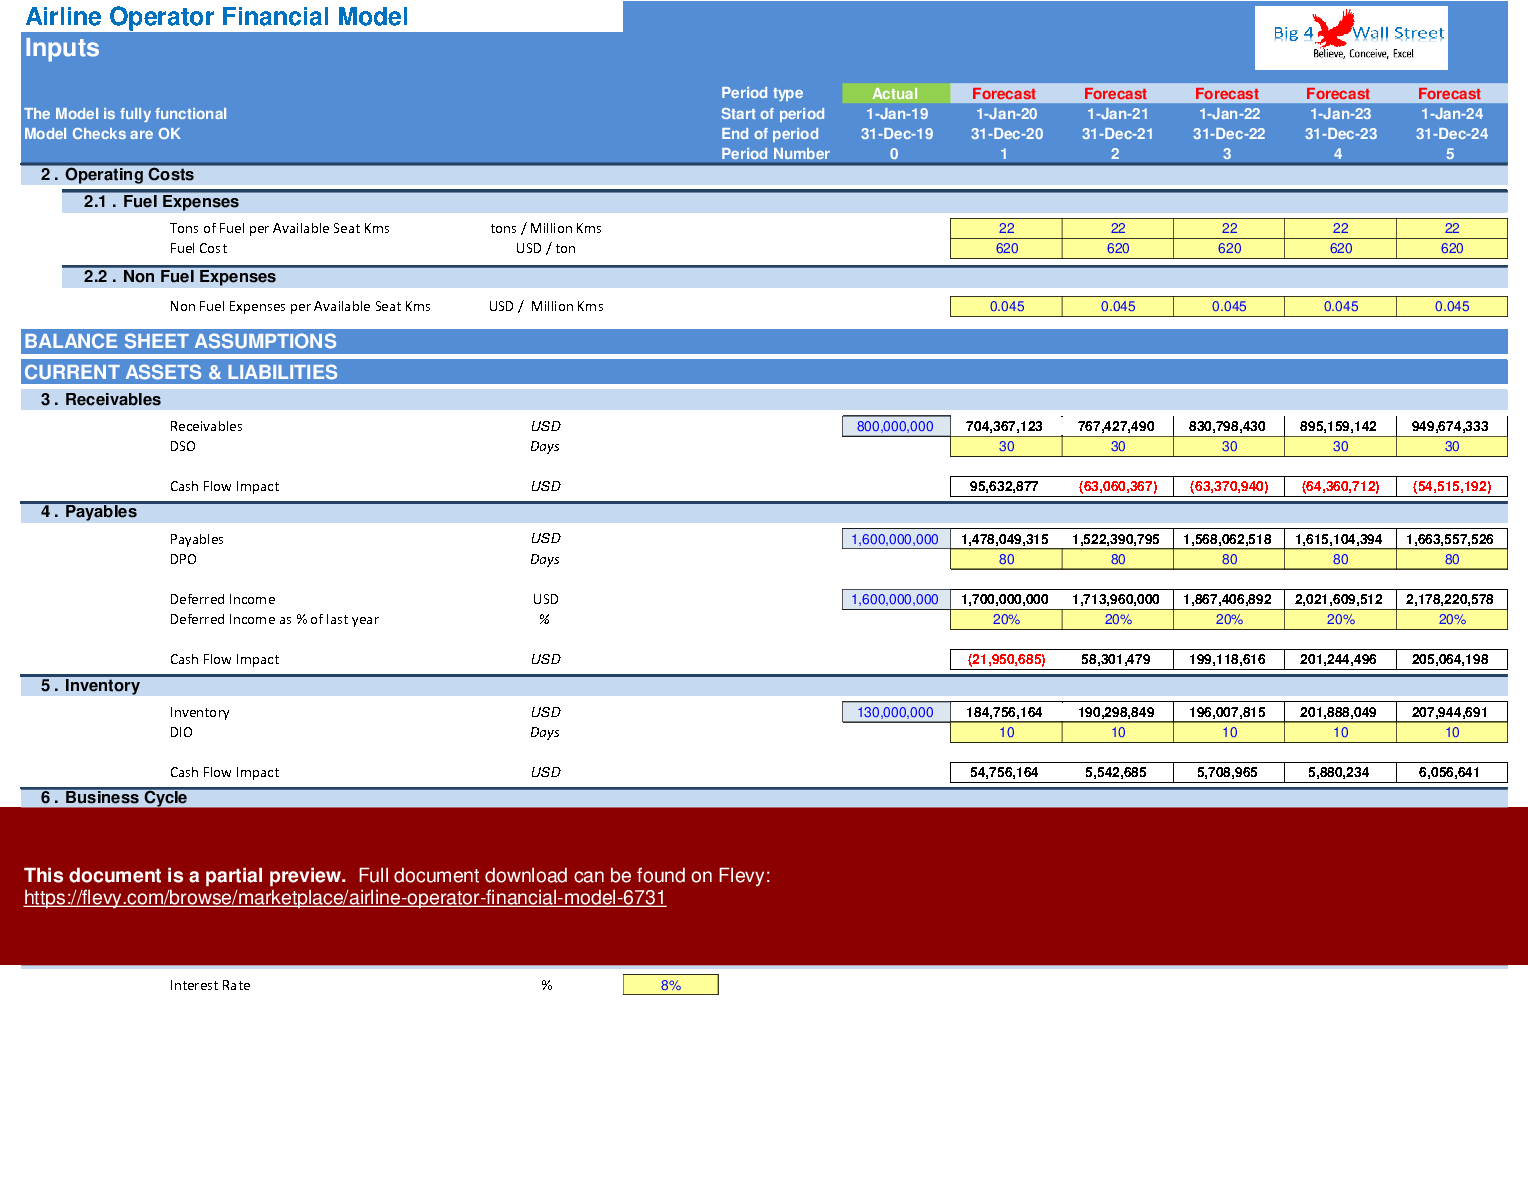
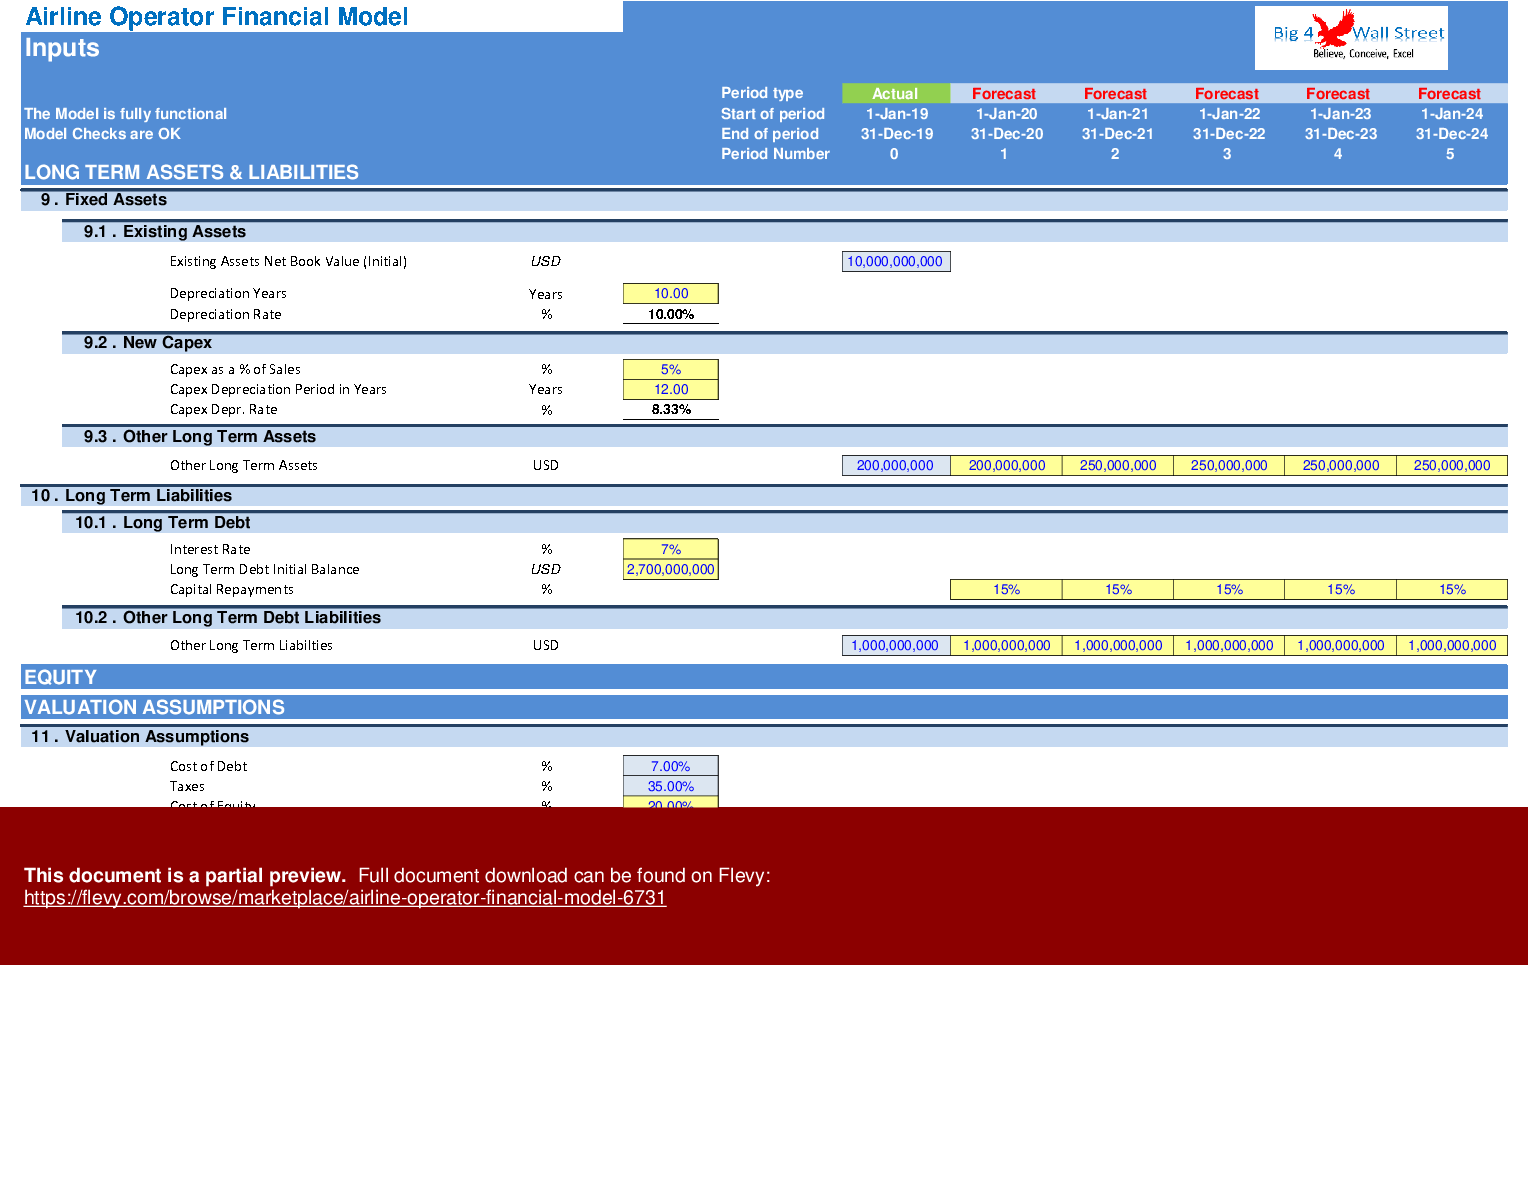
In the inputs tab, the user needs to adjust the drivers of the business in the yellow cells. The drivers consist of the passenger yield per kilometer, the capacity factor and the available seat kilometers which drive the airline revenues. Operating costs are split into fuel and non-fuel operating expenses. Other drivers include receivables days, payable days, inventory days and income tax. Additional assumptions include: depreciation period in years (for both existing and new assets). interest in cash and loans (term loan, overdraft), cost of equity, and debt gearing. The term loan is repaid based on a percentage capital repayment over the years as per the user input.
Calculations: This is where all calculations are performed. The revenues are calculated based on the previous inputs and the growth rates and deducting the operating costs the operating profit is resulting in. Based on the assets financed and the gearing of the financing the interest and depreciation are occurring. By using the working capital assumptions the impact of the business cycle is presented. Finally depending on the existing debt financing and forecast assumptions the loan balances are calculated (Term loan, overdraft).
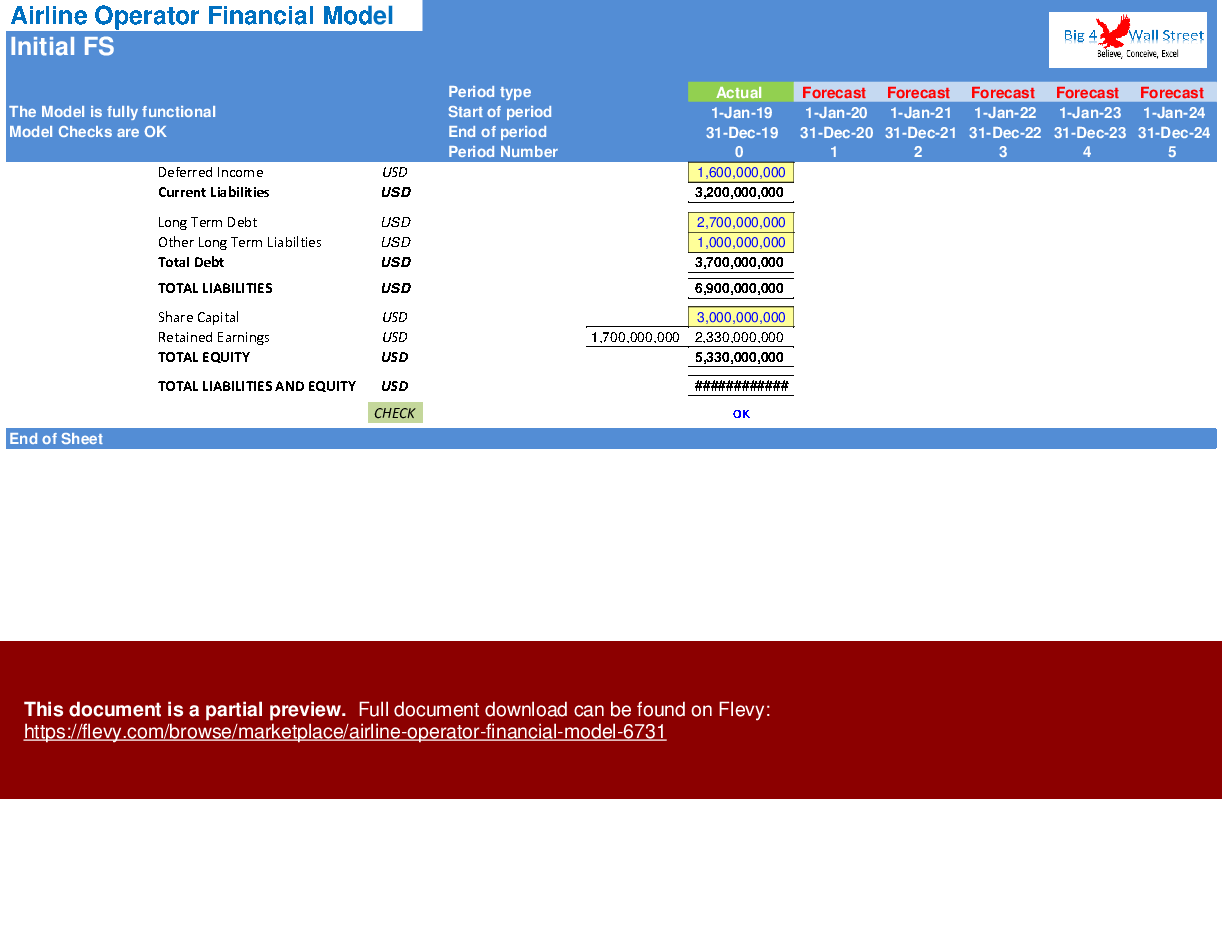
In the Outputs tab: everything is aggregated here into the relevant statements: profit and loss, balance sheet and cash flow on a yearly basis.
In the summary tab, you are able to see a high-level report with the main financial & business ratios. It can be readily printed on one page for your convenience.
Moving to the Valuation tab, free cash flow to the firm valuation is performed. Additionally, the debt service coverage ratio and loan life coverage ratio are calculated.
In the Charts tab: Various graphs present the revenues and operating expenses, profitability margins and bank ratios, various financials from the income statement, balance sheet and cash flow, valuation as well as discount rates.
Checks: A dedicated worksheet that makes sure that everything is working as it should!
Important Notice: Yellow indicates inputs and assumptions that the user is able to change, blue cells are used for called up cells, and white cells with black characters indicates calculation cells.
Got a question about the product? Email us at support@flevy.com or ask the author directly by using the "Ask the Author a Question" form. If you cannot view the preview above this document description, go here to view the large preview instead.
TOPIC FAQ
What core outputs should an airline financial model produce for investor review?
An airline financial model for investor review should produce annual profit & loss, balance sheet, and cash flow statements, a one-page summary with key financial and business ratios, a valuation via free cash flow to the firm, and supporting graphs and bank ratios such as DSCR and loan life coverage ratio, totaling 3 financial statements.How are airline revenues typically forecasted in financial models?
Airline revenues are typically forecasted from operational drivers: passenger yield per kilometer, capacity factor, and available seat kilometers, combined with growth rates applied in the forecast inputs. This model derives revenues from those drivers and growth assumptions, using available seat kilometers, capacity factor, and passenger yield per kilometer.Which working capital and operating cost drivers are important in airline models?
Key working capital and operating cost drivers include receivables days, payable days, inventory days, fuel operating expenses, non-fuel operating expenses, and income tax assumptions. Depreciation periods for existing and new assets and interest on cash and loans also affect cash flow, with these inputs captured in dedicated inputs tabs.What financing options should an airline model include to reflect realistic capital structure scenarios?
An airline model should include standard long-term loan structures with scheduled capital repayments, an overdraft facility for short-term liquidity, and equity funding from investors. This model explicitly supports a term loan repaid by percentage capital repayment, an overdraft facility, and equity funding as financing options.What features should I check before buying a pre-built airline financial model?
Verify editable historical and forecast input tabs, color-coded input cells (yellow for inputs, light blue for calls), calculation and output worksheets, a valuation module (FCFF), graphical outputs, and a checks worksheet to validate integrity; Flevy's Airline Operator Financial Model includes a contents tab, summary page, valuation, charts, and a checks worksheet.How does a model calculate loan balances and debt service metrics for an airline?
Loan balances are calculated using existing debt financing and forecast repayment assumptions; interest and repayment schedules are derived from term loan and overdraft inputs. Debt service metrics such as the debt service coverage ratio and loan life coverage ratio are calculated in the valuation and financing sections, with loan balances tracked by year.Are pre-built airline models useful for valuation work compared with building from scratch?
Pre-built models provide structured three-statement forecasting, financing modules, valuation mechanics, and integrity checks that avoid rebuilding common functionality. For example, Flevy's Airline Operator Financial Model delivers the 3 financial statements, an FCFF valuation, ratio calculations, and charts to support valuation workflows.Which model outputs are most relevant when evaluating loan terms or covenant compliance for an airline?
For loan-term evaluation and covenant testing, focus on annual cash flow available for debt service, debt balances by facility, interest expense, debt service coverage ratio, and loan life coverage ratio; this model generates those outputs and tracks term loan and overdraft balances across the forecast.Source: Best Practices in Airline Industry, Integrated Financial Model Excel: Airline Operator Financial Model Excel (XLSX) Spreadsheet, Big4WallStreet
ABOUT THE AUTHOR
We help small and midsize businesses' leaders with their strategic problems by creating or improving financial models, implementing tools to drive efficiency, performance, and better decision making.
With over 15 years of experience in Financial & Business Modeling / Planning, Performance & Analysis (Ernst & Young, Toyota, Viohalco and Upstream), we have developed strong business
... [read more]
Ask the Author a Question
You must be logged in to contact the author.
