
EXCEL DESCRIPTION
Are you looking to make data-driven business decisions with confidence? The Sensitivity Analysis Excel Template is your ultimate tool for financial forecasting and risk analysis. Designed for financial analysts, business owners, and investors, this spreadsheet model helps you understand how key assumptions impact profitability, cash flow, and share price—ensuring you stay ahead in an unpredictable market.
What This Model Helps You Analyze and Forecast
A Sensitivity Analysis Excel Template is a powerful tool designed for financial analysis to help businesses and investors evaluate how changes in key assumptions impact financial outcomes. This model allows users to conduct risk analysis, understand the impact on profit, and make informed decisions based on different financial scenarios. By using this spreadsheet model, businesses can:
1. Forecast future sales and sales revenue.
2. Analyze variable costs, profit margin, and annual sales.
3. Perform scenario analysis to assess business risks.
4. Evaluate internal rate and rate of return for business ventures.
5. Identify breakeven points using breakeven analysis.
6. Assess the effect of revenue growth assumptions on share price.
Key Features of This Template
1. Input Sheet
The plug-and-play template comes with an input sheet where users enter key assumptions. This sheet contains input variables such as sales volume, annual growth rate, charge of sales, and other relevant variables that drive financial projections.
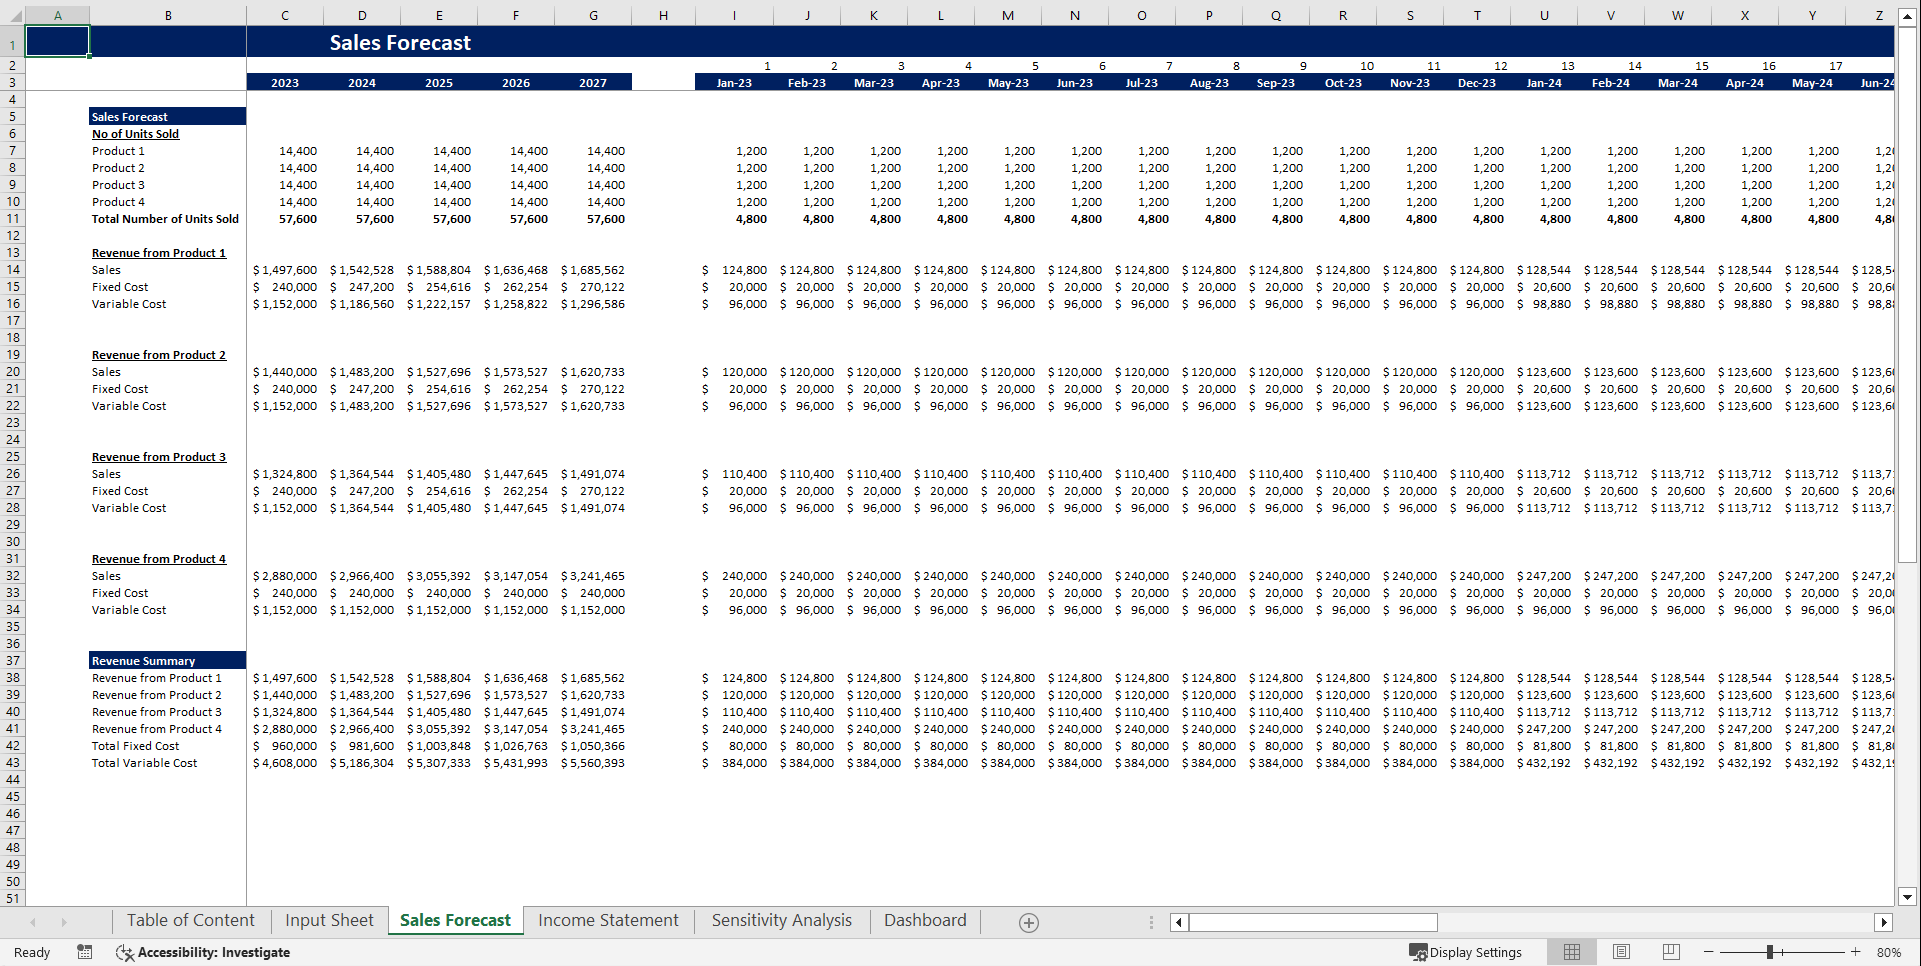
2. Sales Forecast
The Sales Forecast section projects revenue growth based on historical data and key assumptions about consumer behavior and market trends. Users can test different growth rates and evaluate how they influence overall financial performance.
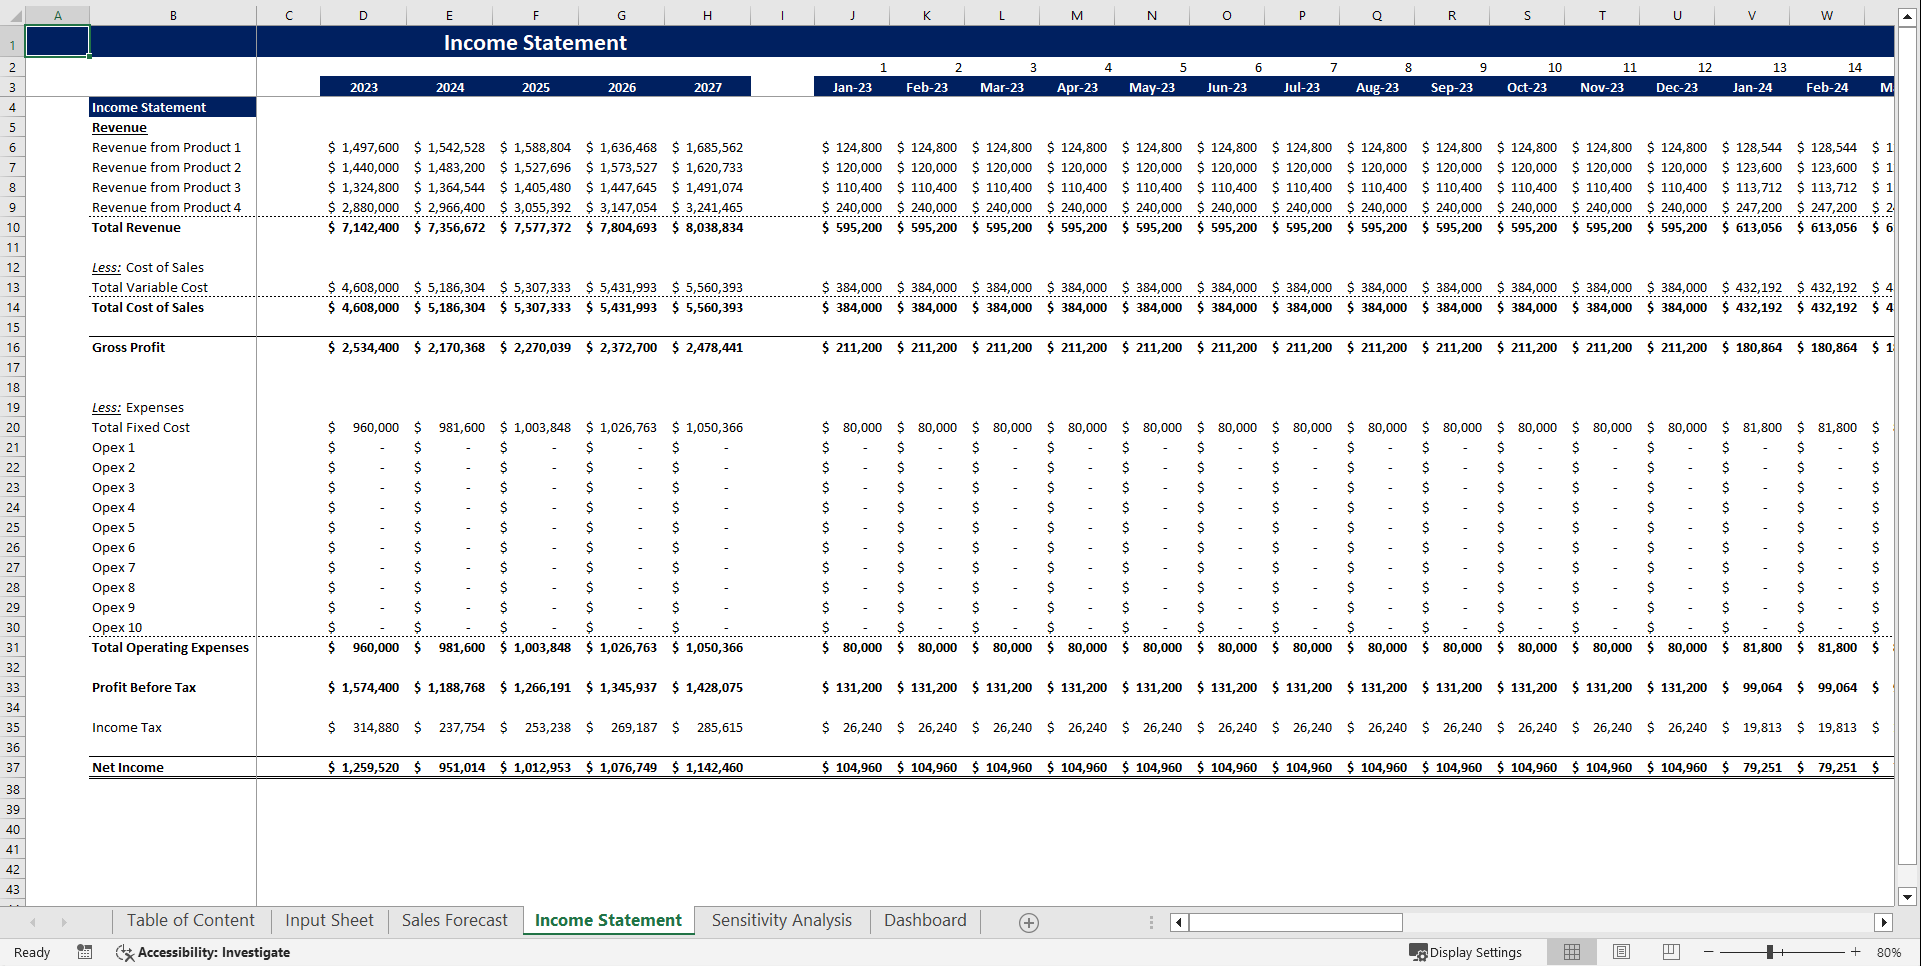
3. Income Statement
This section provides a detailed breakdown of financial performance, including sales revenue, profit margin, cash flow analysis, and operating costs. By adjusting independent variables, users can assess the financial health of their business projects.
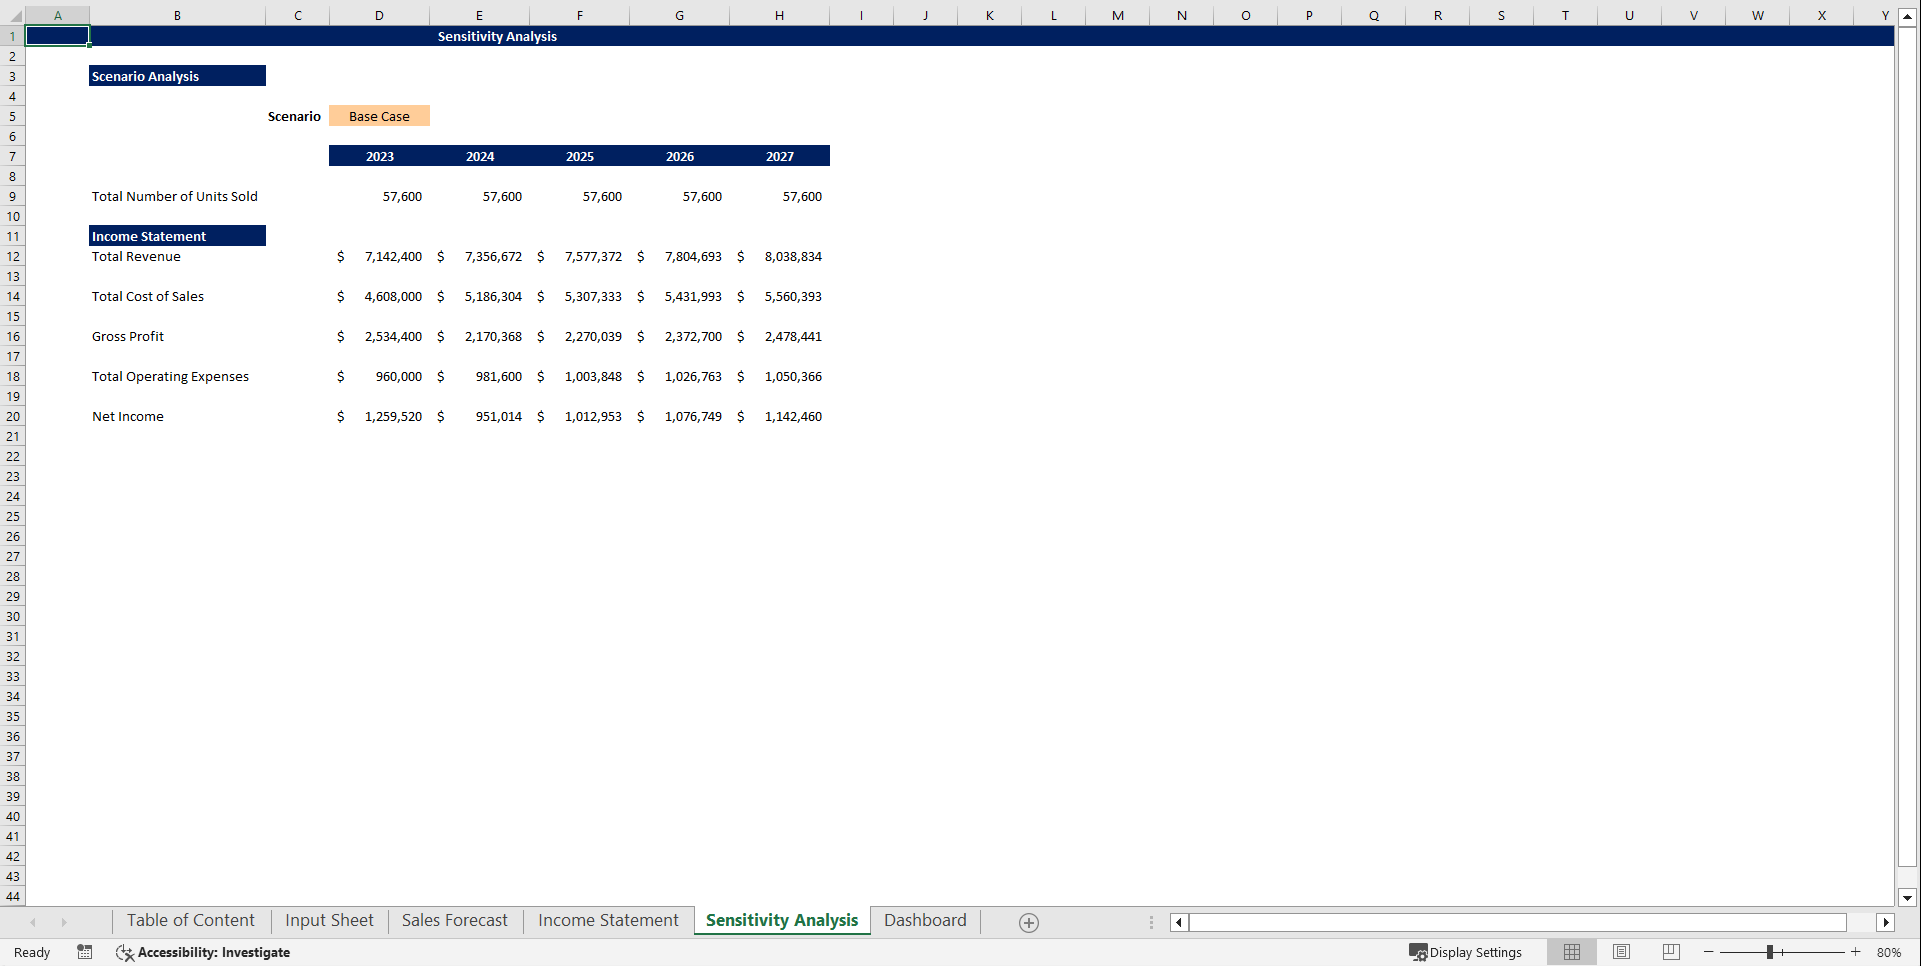
4. Sensitivity Analysis
This section is the core of the model, featuring One-Way Sensitivity Analysis and Two-Way Sensitivity Analysis to examine how changes in independent variables affect dependent variables like profit margin, cash flow, and share price. The sensitivity table allows users to input different assumptions and evaluate the financial implications.
5. Dashboard
The dashboard provides a visual appeal to the financial model, presenting key insights through charts and graphs. This section helps stakeholders quickly understand how changes in assumptions affect financial outcomes.
Who Can Benefit from This Financial Model?
This model is ideal for:
1. Financial analysts conducting risk analysis.
2. Entrepreneurs evaluating business ventures.
3. Investors assessing return potential.
4. Business owners optimizing business finances.
5. Consultants advising on financial planning.
Conclusion
The Sensitivity Analysis Excel Template is a real-world finance and research tool, offering a wide range of analysis capabilities. It helps users optimize financial decision-making through powerful tools and extensive financial models.
FAQs
1. What is One-Way Sensitivity Analysis?
One-Way Sensitivity Analysis evaluates how a single independent variable affects a dependent variable, such as how sales revenue changes with a shift in sales volume.
2. How does Two-Way Sensitivity Analysis work?
Two-Way Sensitivity Analysis examines how two input variables interact to impact an output variable, allowing for a more comprehensive risk assessment.
3. Can I customize the input variables?
Yes, the plug-and-play template allows full customization of key assumptions, including annual growth rate, pricing, and cost structure.
4. How does this model help with scenario analysis?
By adjusting the row input cell and column input cell, users can create different financial scenarios to understand potential risks and opportunities for their business.
This guide to sensitivity analysis provides a structured approach to financial forecasting, making it an indispensable resource for professionals in a range of fields.
Got a question about the product? Email us at support@flevy.com or ask the author directly by using the "Ask the Author a Question" form. If you cannot view the preview above this document description, go here to view the large preview instead.
Source: Sensitivity Analysis Financial Tool Excel (XLSX) Spreadsheet, Oak Business Consultant
