Sales Revenue & Expense Tracker w/ Inventory Discount   Excel template (XLSX)
$30.00

Sales Revenue & Expense Tracker w/ Inventory Discount (Excel template (XLSX)) Preview Image
Log in to unlock full preview.
Sales Revenue & Expense Tracker w/ Inventory Discount (Excel template (XLSX)) Preview Image
Arrow   Click main image to view in full screen.

Sales Revenue & Expense Tracker w/ Inventory Discount (Excel XLSX)

Excel (XLSX) + Zip archive file (ZIP)

$30.00
At Wilcox PMO we provide CFO Services planning & analysis to aid companies in interpreting financial statements. Our 5-Year 3 Statement models eliminate the need to create project finance trackers from scratch and include all common actions.
Add to Cart


Immediate download
Fully editable Excel
Free lifetime updates

DESCRIPTION

This product (Sales Revenue & Expense Tracker w/ Inventory Discount) is an Excel template (XLSX) with a supplemental Zip archive file document, which you can download immediately upon purchase.

Sales Revenue & Expense Tracker w/ Inventory Discount Analysis in Excel


### Multi-Platform Sales Revenue & Expense Tracker w/ Inventory Discount Analysis in Excel

These Excel trackers are designed for businesses selling items across single or multiple online platforms. It includes separate worksheets for each month and provides detailed insights into sales revenue, inventory management, and discount analysis. Here's a comprehensive breakdown of the tracker:

2 Different Versions

Version 1: Multi-Platform Sales Revenue & Expense Tracker w/ Inventory Discount Analysis in Excel.
Sell and track multiple item sales easily on multiple platforms.

Track Singular Sales on multiple platforms w/ Inventory Discount Analysis in Excel.
This can also be used for example selling mobile phones as they have an individual IMEI)

Version 2: Multiple sales of different items, or one single item on a single platform.

—-

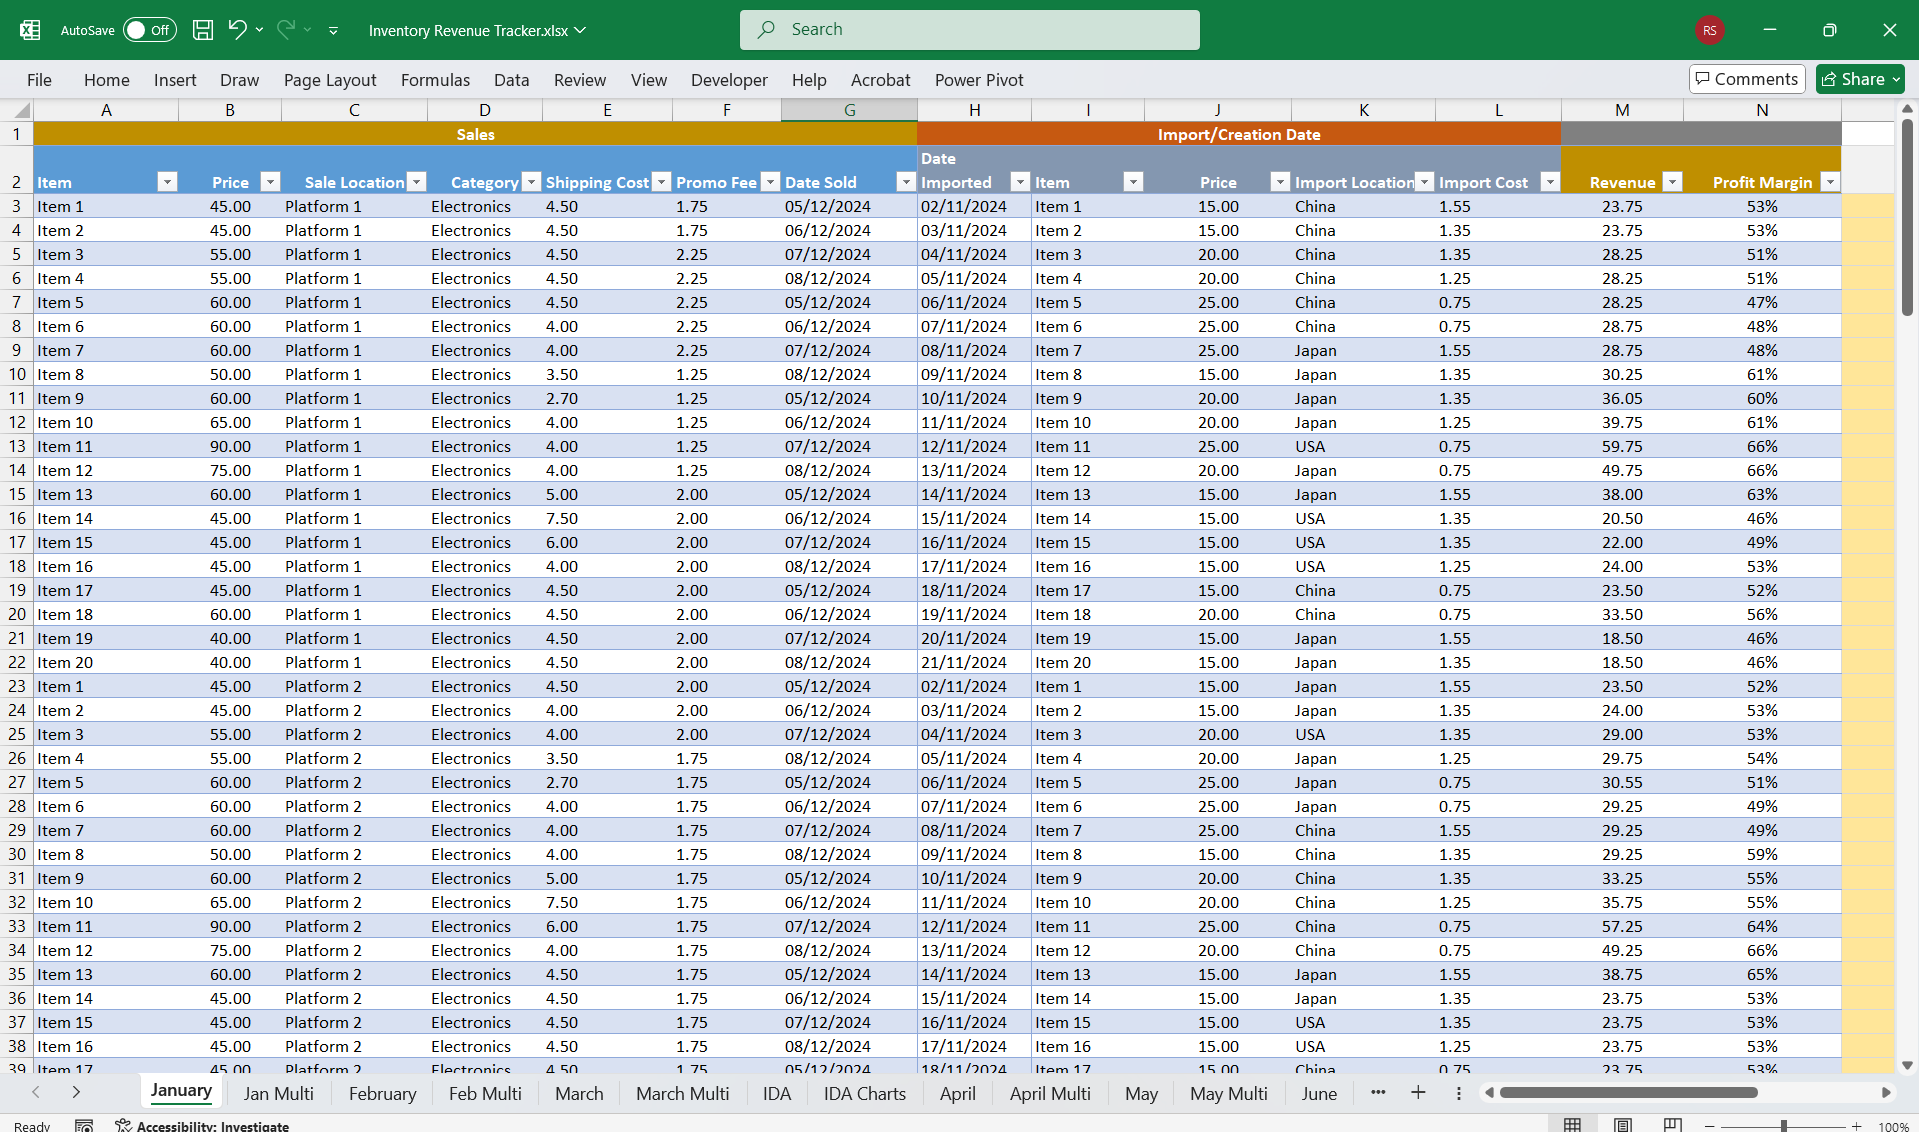
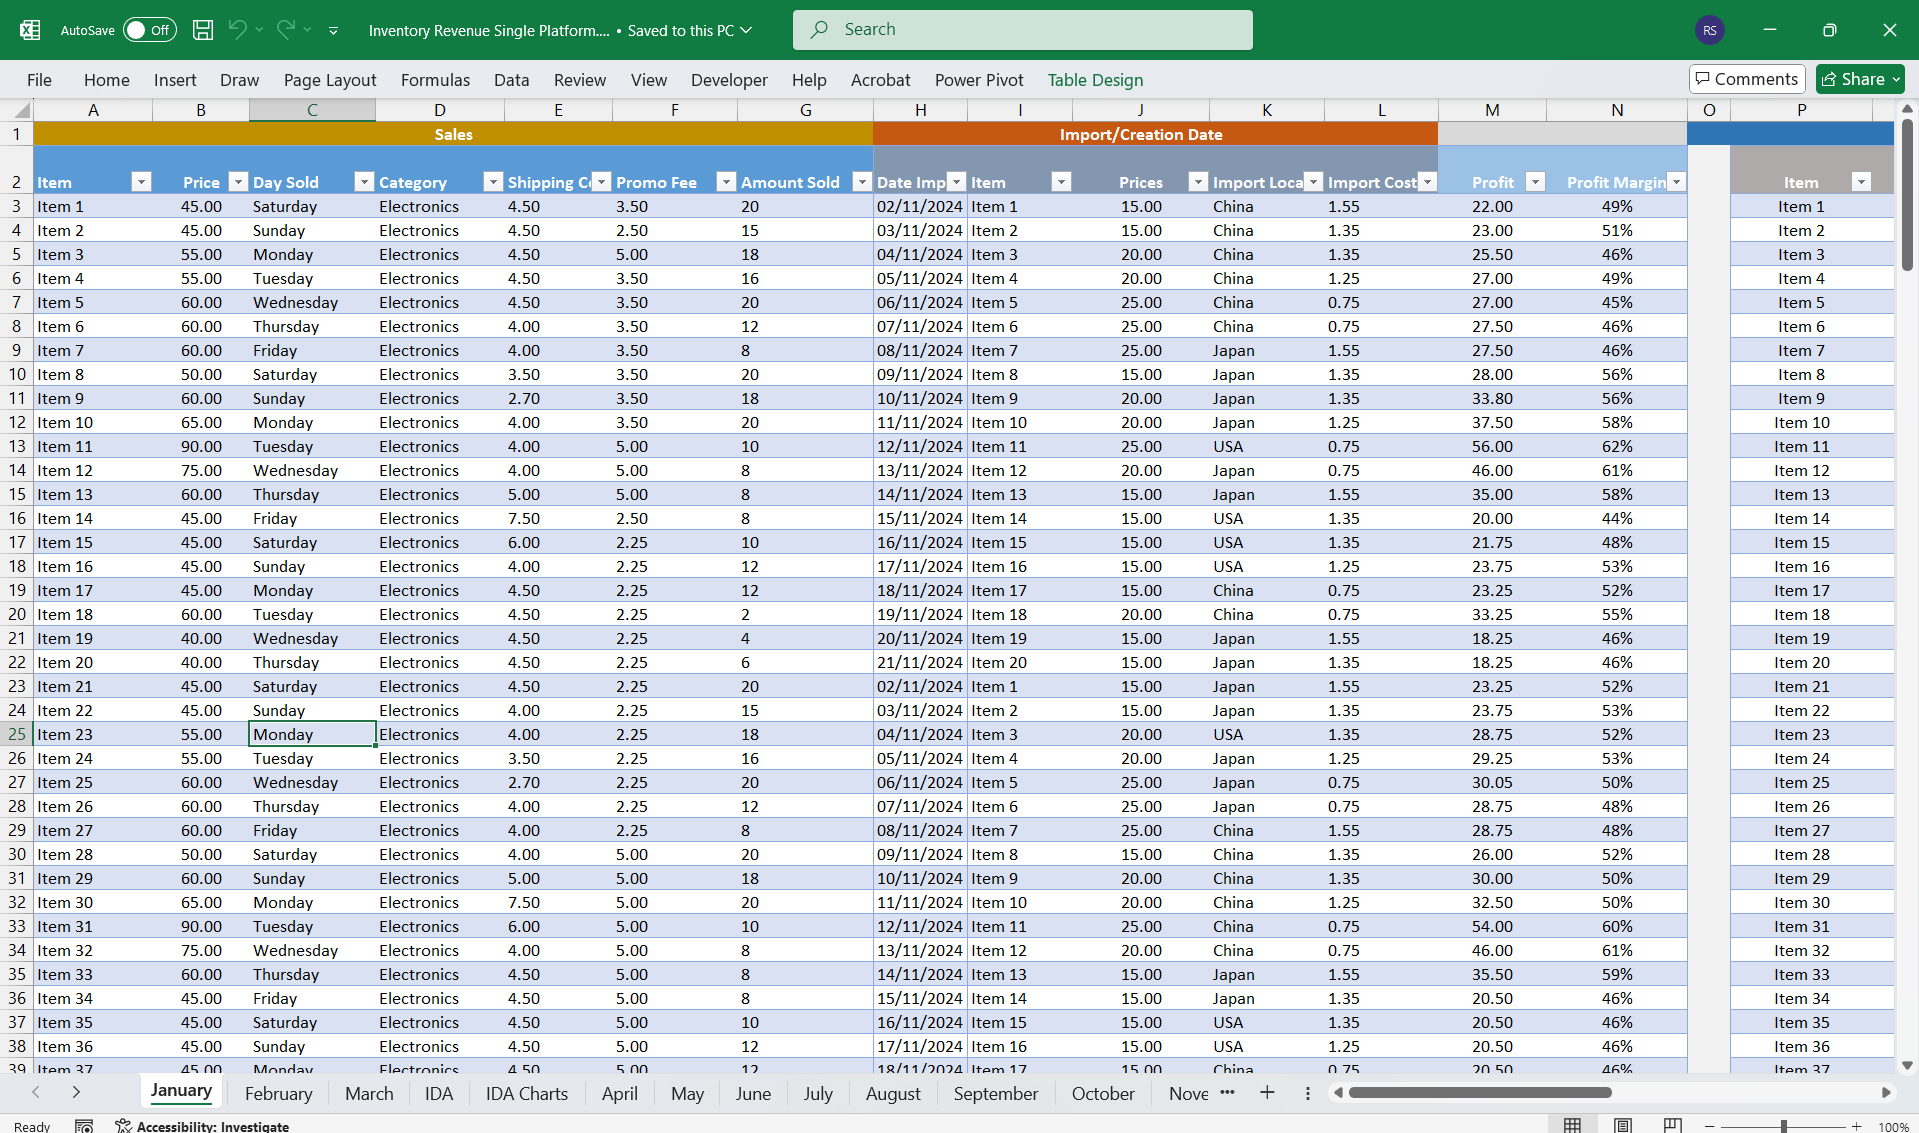
### 1. Monthly Worksheets (12 Sheets for January–December)

Each worksheet tracks sales data for a specific month, with the following columns:

#### Columns/Fields:
1. Date Sold: The date the item was sold.
2. Item Name: Name or identifier of the item.
3. Price: The price at which the item is listed (before discounts or fees).
4. Online Platform Name: Name of the platform where the sale occurred (e.g., Amazon, eBay, Shopify).
5. Category: Category within the platform (e.g., Electronics, Fashion).
6. Shipping Cost: The cost incurred for shipping the item.
7. Promotional Fees: Any fees paid to the platform for promotions (e.g., ads, boosted listings).
8. Amount Sold: The total number of units sold of the item.
9. Gross Revenue: Automatically calculated as `Price * Amount Sold`.
10. Discount Applied: Any discounts given per sale (absolute or percentage).
11. Net Revenue: Automatically calculated as `Gross Revenue – Discount Applied – Shipping Cost – Promotional Fees`.
12. Profit Margin: Automatically calculated as `(Net Revenue – Cost of Goods Sold) / Net Revenue * 100`.

#### Features:
•  Conditional Formatting: Highlights high-performing categories or low-margin items.
•  Auto-Summary Rows: Aggregates total revenue, costs, and profits for each month.

—-

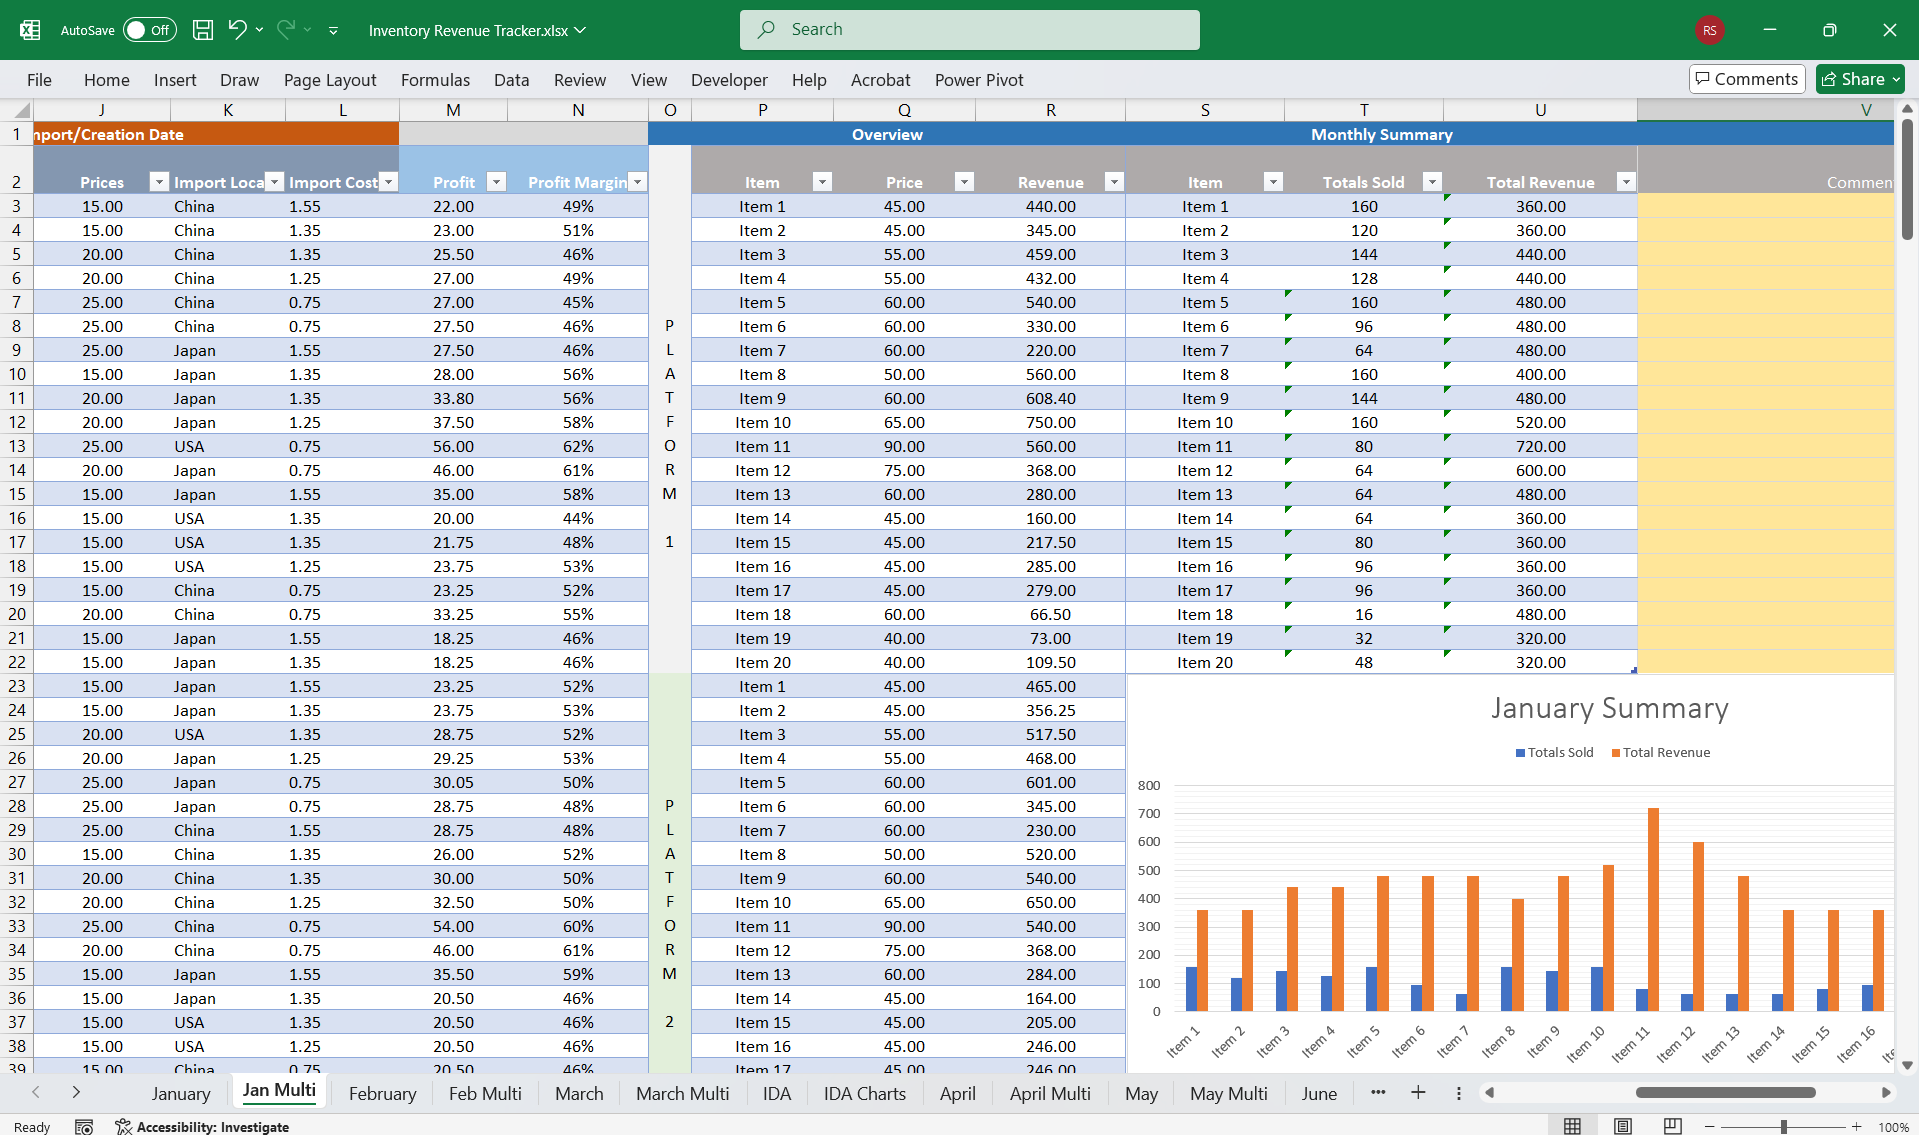
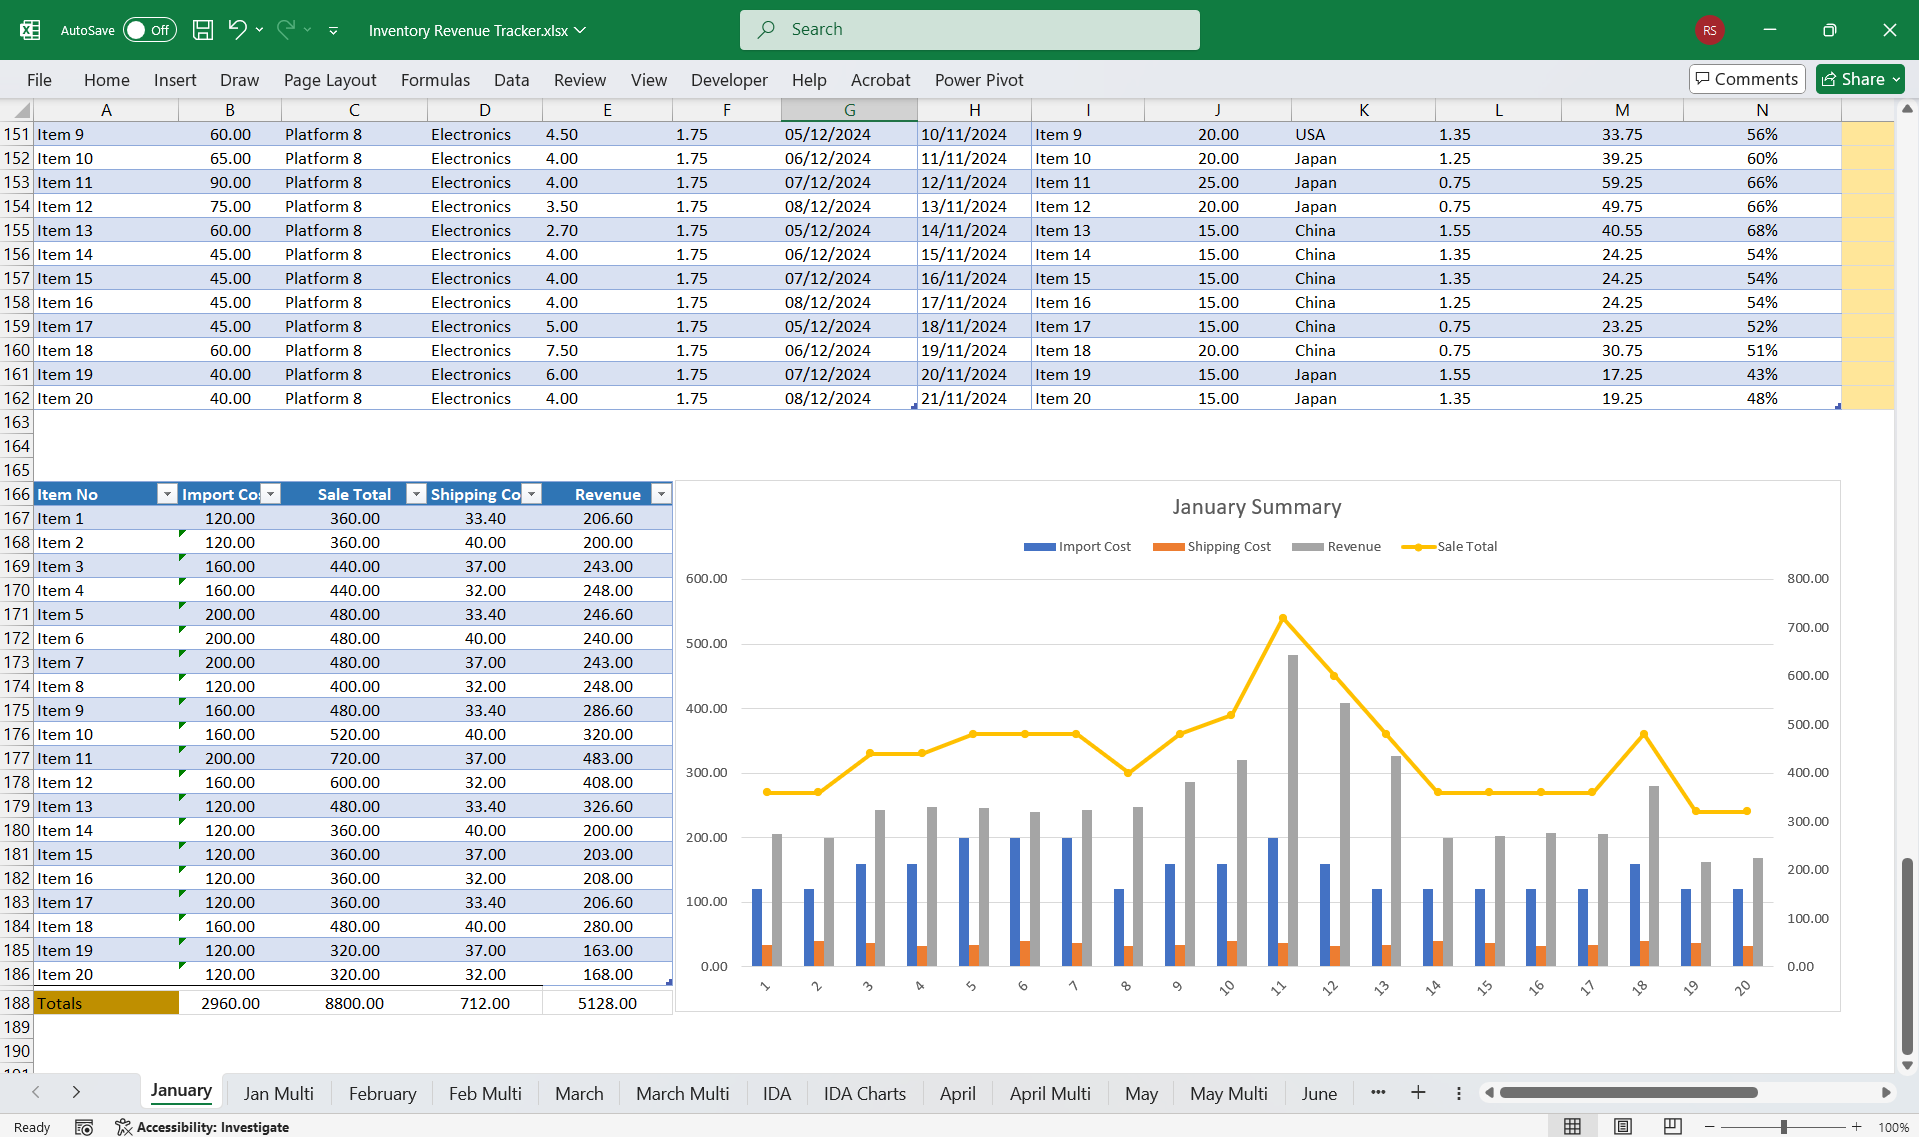
### 2. Consolidated Summary Charts

Aggregates data from all monthly worksheets to provide an overview of sales performance.

#### Helps you follow:
1. Total Sales Revenue: Summarizes gross and net revenue for the year.
2. Platform-wise Revenue: Pie charts or bar graphs to visualize revenue from each platform.
3. Category Performance: Tracks best- and worst-performing categories.
4. Monthly Trends: Line charts to display monthly revenue, costs, and profit trends.
5. Shipping and Fee Analysis: Highlights the percentage of revenue spent on shipping and promotional fees.

—-

### 3. Inventory Log

A centralized inventory sheet to track item availability, sales, and replenishment needs.

#### Columns/Fields:
1. Item Name: Name or identifier of the item.
2. Category: Category of the item (e.g., Electronics, Fashion).
3. Opening Stock: The quantity available at the beginning of the period.
4. Stock Added: Quantity added to inventory during the period.
5. Amount Sold (Linked): Automatically updated from the "Amount Sold" field in the monthly sheets.
6. Closing Stock: Automatically calculated as `Opening Stock + Stock Added – Amount Sold`.
7. Restocking Alerts: Conditional formatting to flag items with low stock (e.g., <10 units).

#### Features:
•  Replenishment Recommendations: Automatically calculates restocking requirements based on sales trends.

—-

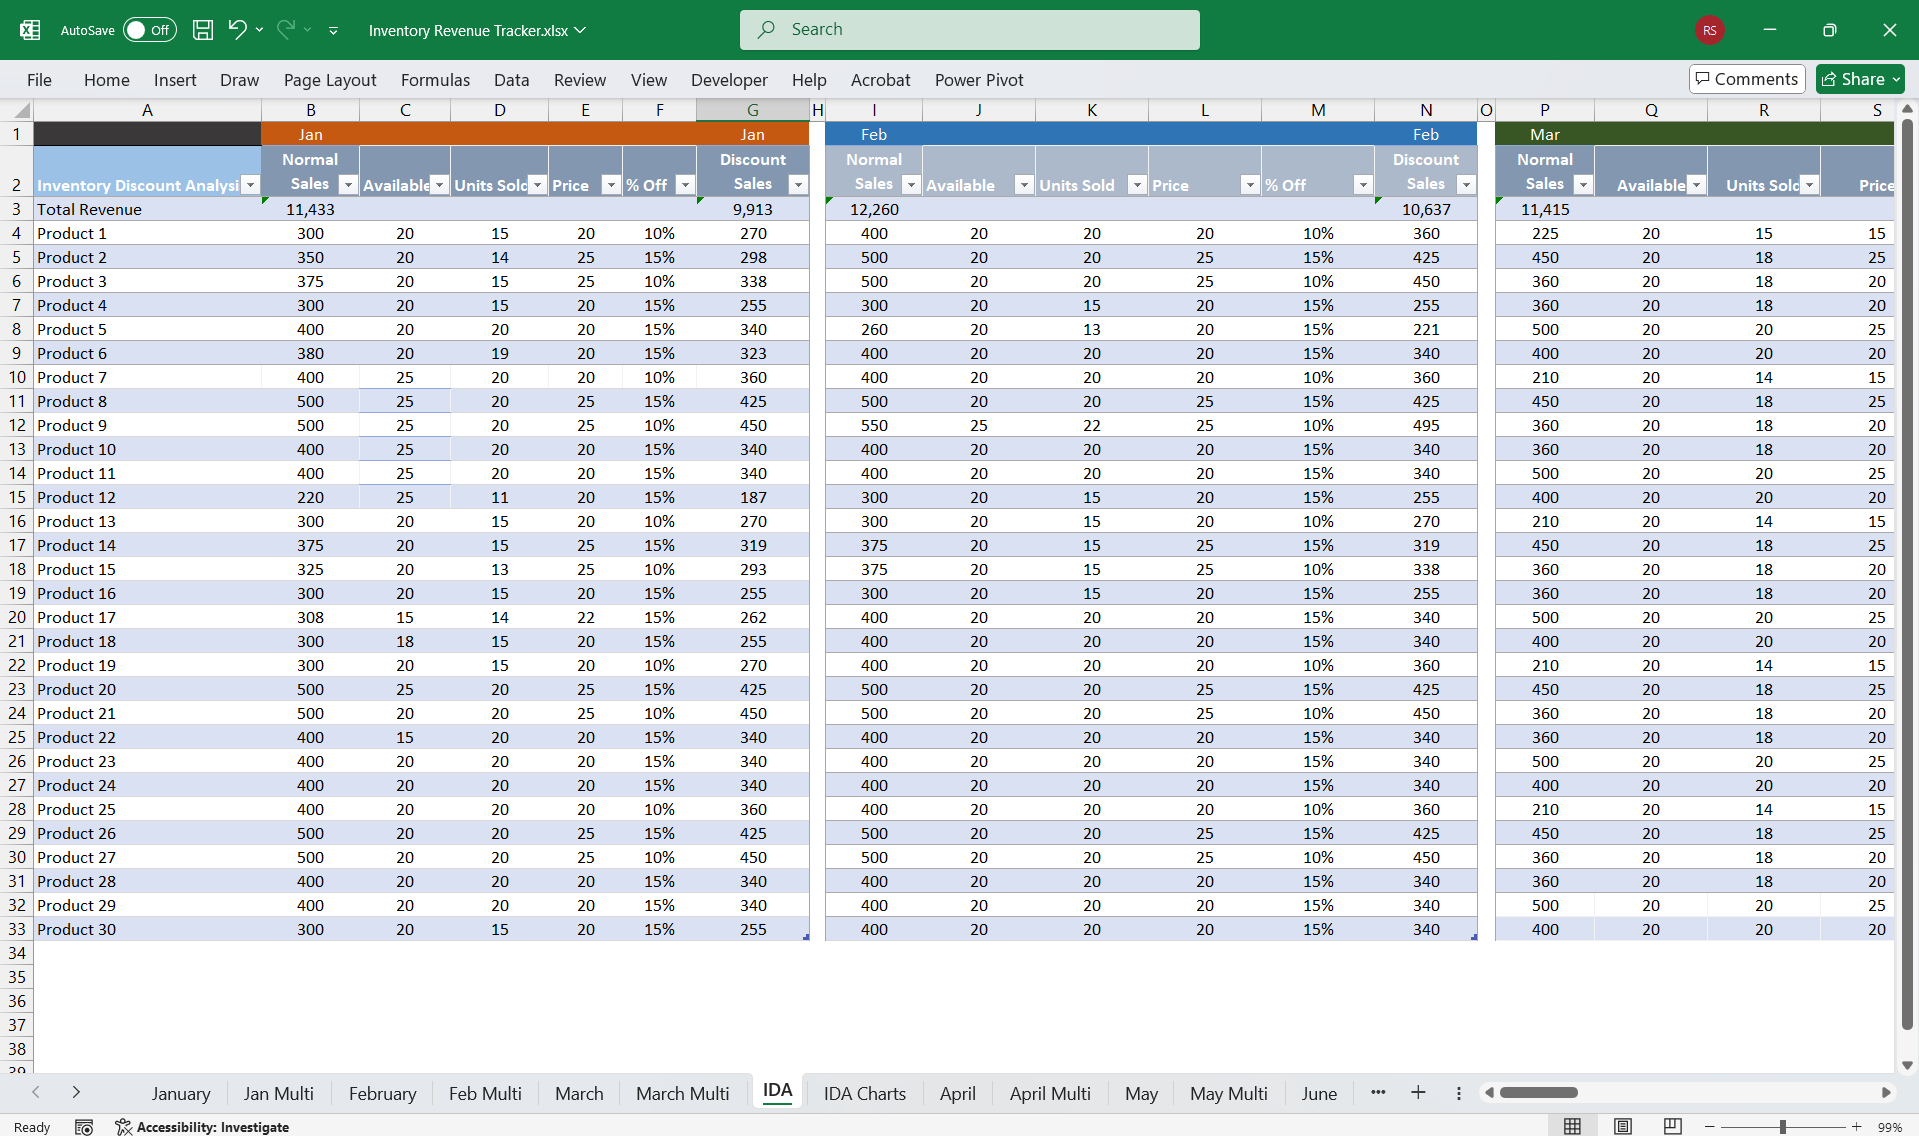
### 4. Inventory Discount Analysis

A dedicated sheet to track and analyze the impact of discounts and promotional activities on sales performance.

#### Columns/Fields:
1. Item Name: Name or identifier of the item.
2. Price: Regular price of the item.
3. Discount Applied: Type and value of the discount (percentage or flat).
4. Discounted Price: Automatically calculated as `Price – Discount`.
5. Units Sold with Discount (Linked): Pulls data from monthly worksheets for sales during discount periods.
6. Revenue with Discount: Automatically calculated as `Units Sold with Discount * Discounted Price`.
7. Gross Revenue Comparison: Difference between discounted and non-discounted revenue.
8. Profit Impact: Calculate the cost of goods sold and other expenses.

#### Helps:
•  Visual Analytics: Charts comparing sales volume and profit margins for discounted vs. non-discounted items.
•  Discount Effectiveness: Uses formulas to rank the effectiveness of discounts based on their impact on sales and profits.

—-

### Automation and Formula Usage

1. Dynamic Linking: Use `=SUMIFS()` and `=SUMPRODUCT()` to consolidate and analyze data across monthly sheets.
2. Conditional Formatting: Highlights trends, such as high promotional costs or low profit margins.
3. Custom Calculations:
•  Gross Revenue: `=Price * Amount Sold`
•  Net Revenue: `=Gross Revenue – Discount – Shipping Cost – Promotional Fees`
•  Closing Stock: `=Opening Stock + Stock Added – Amount Sold`

—-

### Helpful Features
•  Platform-Specific Analysis: Filters to view sales data for specific platforms.
•  Easier Analytics or Year-End Reports: Aggregates all metrics for the year, highlighting top-performing platforms, categories, and items.

This structure will help manage sales and inventory across multiple sales platforms while providing valuable insights into how discounts and promotional activities impact overall performance.

Got a question about the product? Email us at support@flevy.com or ask the author directly by using the "Ask the Author a Question" form. If you cannot view the preview above this document description, go here to view the large preview instead.

Source: Best Practices in Expense Tracker Excel: Sales Revenue & Expense Tracker w/ Inventory Discount Excel (XLSX) Spreadsheet, Willcox PMO


$30.00
At Wilcox PMO we provide CFO Services planning & analysis to aid companies in interpreting financial statements. Our 5-Year 3 Statement models eliminate the need to create project finance trackers from scratch and include all common actions.
Add to Cart
  

ABOUT THE AUTHOR

Author: Willcox PMO
Additional documents from author: 62

As a senior Project Manager at Willcox PMO I oversee all functions relating to the development of the company, and as a previous network architect at Cisco; I also oversee all aspects of the company's IT development. Additionally, I'm responsible for overseeing the strategic direction and planning of all the company activities in order to achieve our company project development goals while ... [read more]

Ask the Author a Question

Must be logged in

Did you know?
The average daily rate of a McKinsey consultant is $6,625 (not including expenses). The average price of a Flevy document is $65.


Trusted by over 10,000+ Client Organizations
Since 2012, we have provided best practices to over 10,000 businesses and organizations of all sizes, from startups and small businesses to the Fortune 100, in over 130 countries.
AT&T GE Cisco Intel IBM Coke Dell Toyota HP Nike Samsung Microsoft Astrazeneca JP Morgan KPMG Walgreens Walmart 3M Kaiser Oracle SAP Google E&Y Volvo Bosch Merck Fedex Shell Amgen Eli Lilly Roche AIG Abbott Amazon PwC T-Mobile Broadcom Bayer Pearson Titleist ConEd Pfizer NTT Data Schwab


Read Customer Testimonials

 
"As a small business owner, the resource material available from FlevyPro has proven to be invaluable. The ability to search for material on demand based our project events and client requirements was great for me and proved very beneficial to my clients. Importantly, being able to easily edit and tailor "

– Michael Duff, Managing Director at Change Strategy (UK)
 
"Last Sunday morning, I was diligently working on an important presentation for a client and found myself in need of additional content and suitable templates for various types of graphics. Flevy.com proved to be a treasure trove for both content and design at a reasonable price, considering the time I "

– M. E., Chief Commercial Officer, International Logistics Service Provider
 
"I like your product. I'm frequently designing PowerPoint presentations for my company and your product has given me so many great ideas on the use of charts, layouts, tools, and frameworks. I really think the templates are a valuable asset to the job."

– Roberto Fuentes Martinez, Senior Executive Director at Technology Transformation Advisory
 
"I have found Flevy to be an amazing resource and library of useful presentations for lean sigma, change management and so many other topics. This has reduced the time I need to spend on preparing for my performance consultation. The library is easily accessible and updates are regularly provided. A wealth of great information."

– Cynthia Howard RN, PhD, Executive Coach at Ei Leadership
 
"One of the great discoveries that I have made for my business is the Flevy library of training materials.

As a Lean Transformation Expert, I am always making presentations to clients on a variety of topics: Training, Transformation, Total Productive Maintenance, Culture, Coaching, Tools, Leadership Behavior, etc. Flevy "

– Ed Kemmerling, Senior Lean Transformation Expert at PMG
 
"I am extremely grateful for the proactiveness and eagerness to help and I would gladly recommend the Flevy team if you are looking for data and toolkits to help you work through business solutions."

– Trevor Booth, Partner, Fast Forward Consulting
 
"If you are looking for great resources to save time with your business presentations, Flevy is truly a value-added resource. Flevy has done all the work for you and we will continue to utilize Flevy as a source to extract up-to-date information and data for our virtual and onsite presentations!"

– Debbi Saffo, President at The NiKhar Group
 
"The wide selection of frameworks is very useful to me as an independent consultant. In fact, it rivals what I had at my disposal at Big 4 Consulting firms in terms of efficacy and organization."

– Julia T., Consulting Firm Owner (Former Manager at Deloitte and Capgemini)


Your Recently Viewed Documents


Customers Also Like These Documents

Related Management Topics


Expense Tracker

Download our FREE Organization, Change, & Culture, Templates

Download our free compilation of 50+ slides and templates on Organizational Design, Change Management, and Corporate Culture. Methodologies include ADKAR, Burke-Litwin Change Model, McKinsey 7-S, Competing Values Framework, etc.