
Pitch Deck Financial Visualizations Template – Excel XLSX
Excel (XLSX)
VIDEO DEMO
PITCH DECK EXCEL DESCRIPTION
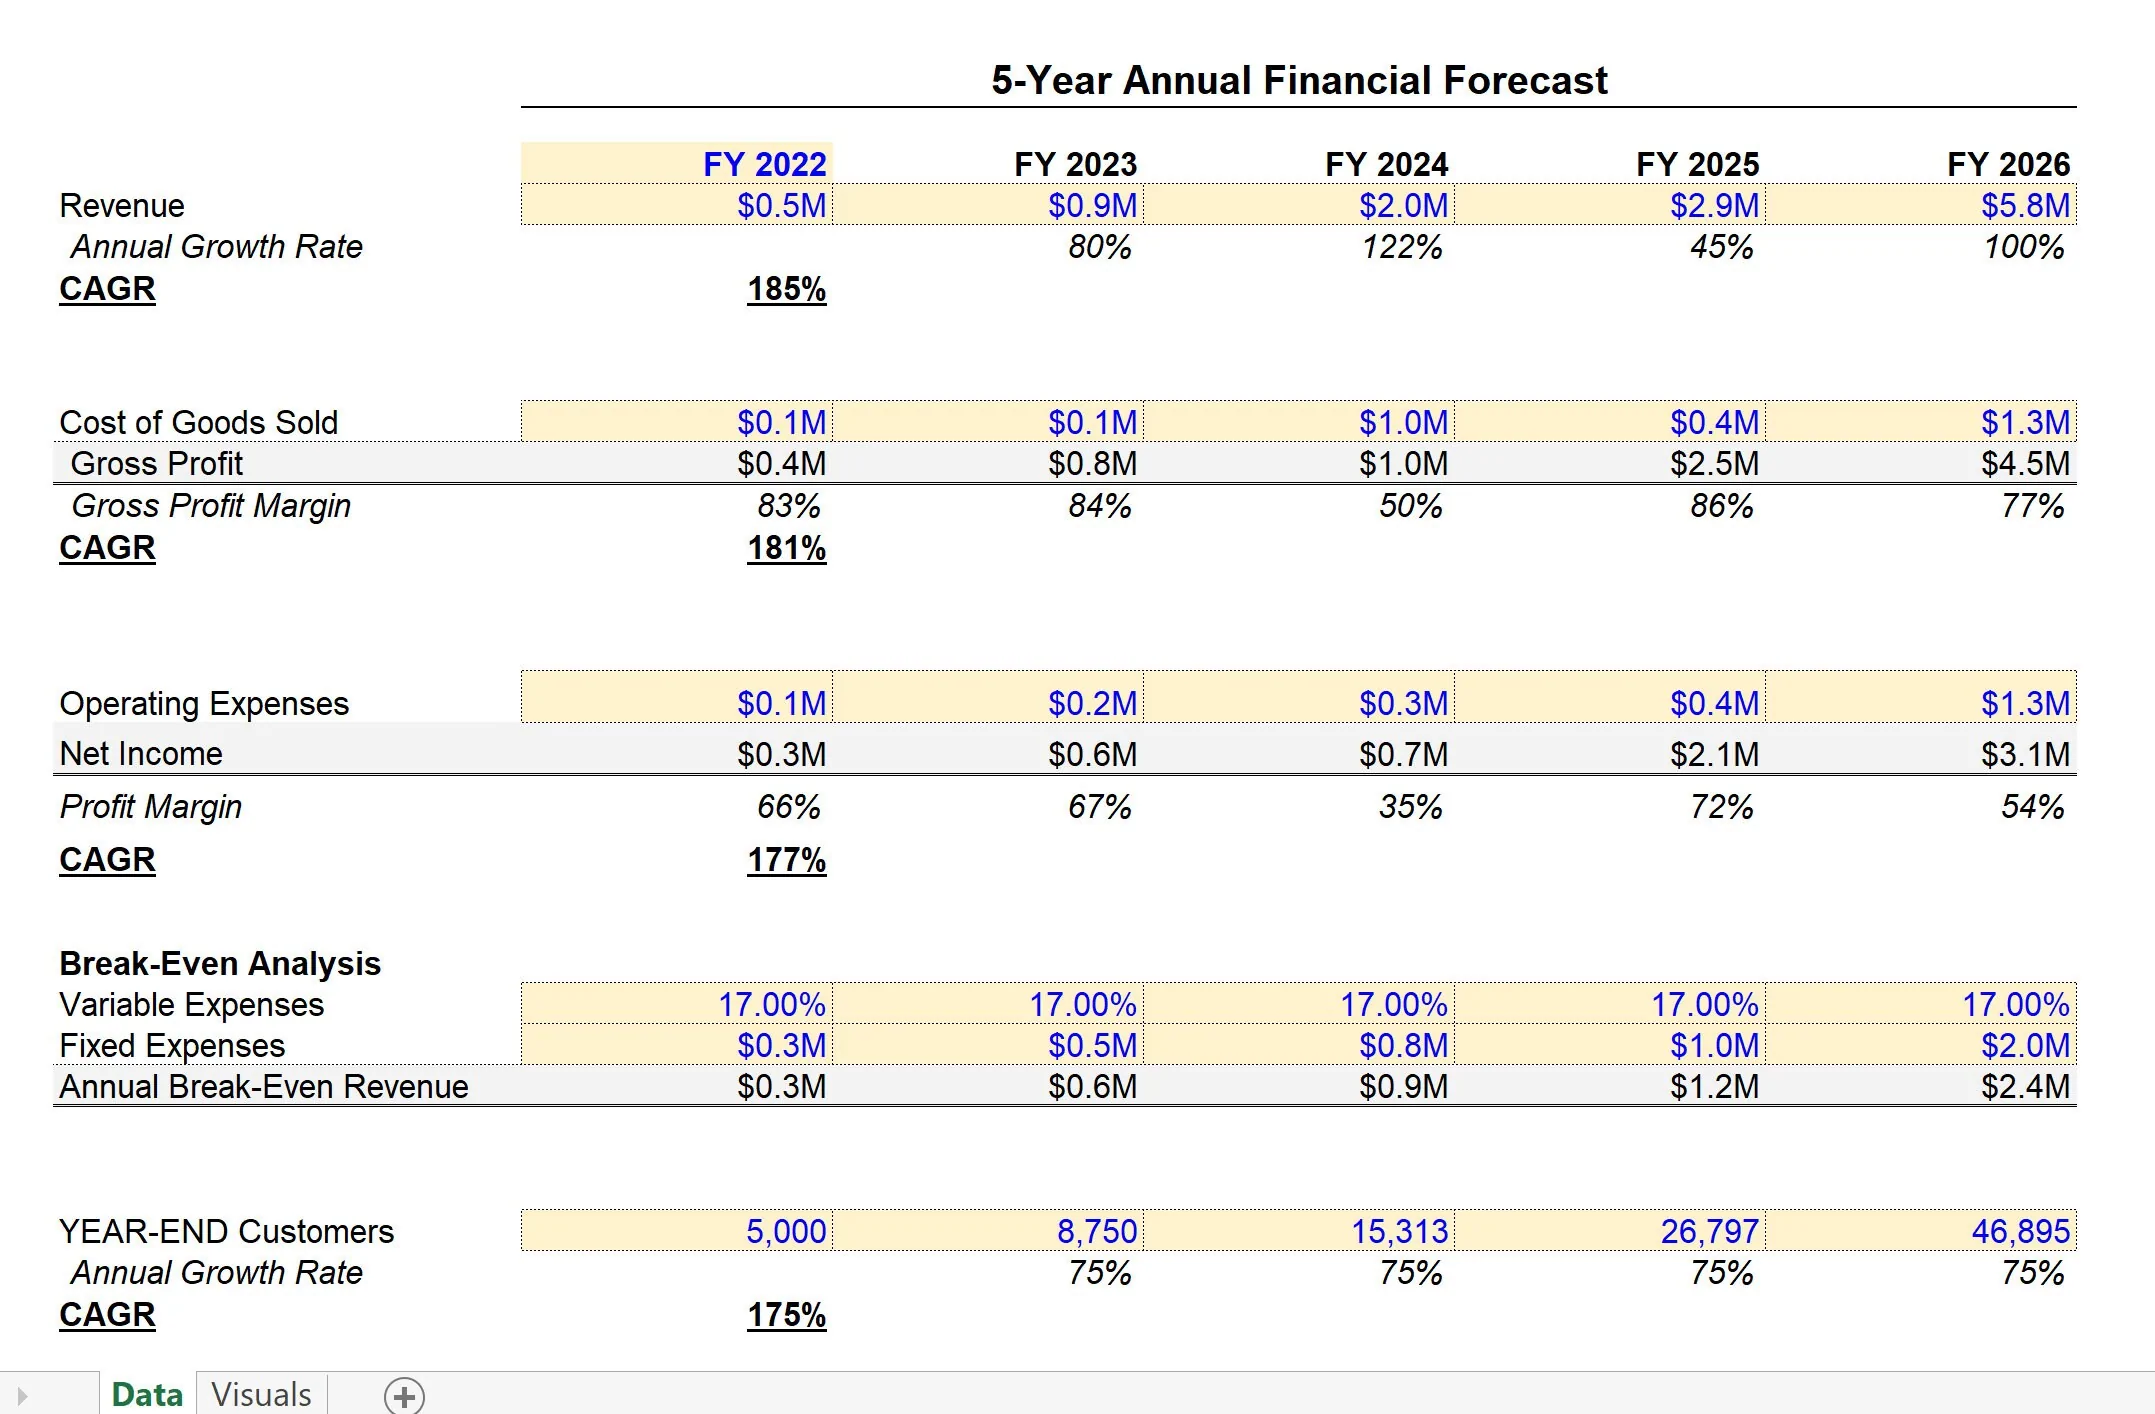
Easily input your financial projections or historical actuals and this template will automatically create clean and clear visualizations that display your numbers in an easy-to-read format. You don't need to worry about formatting your pitch deck financials after using this template.
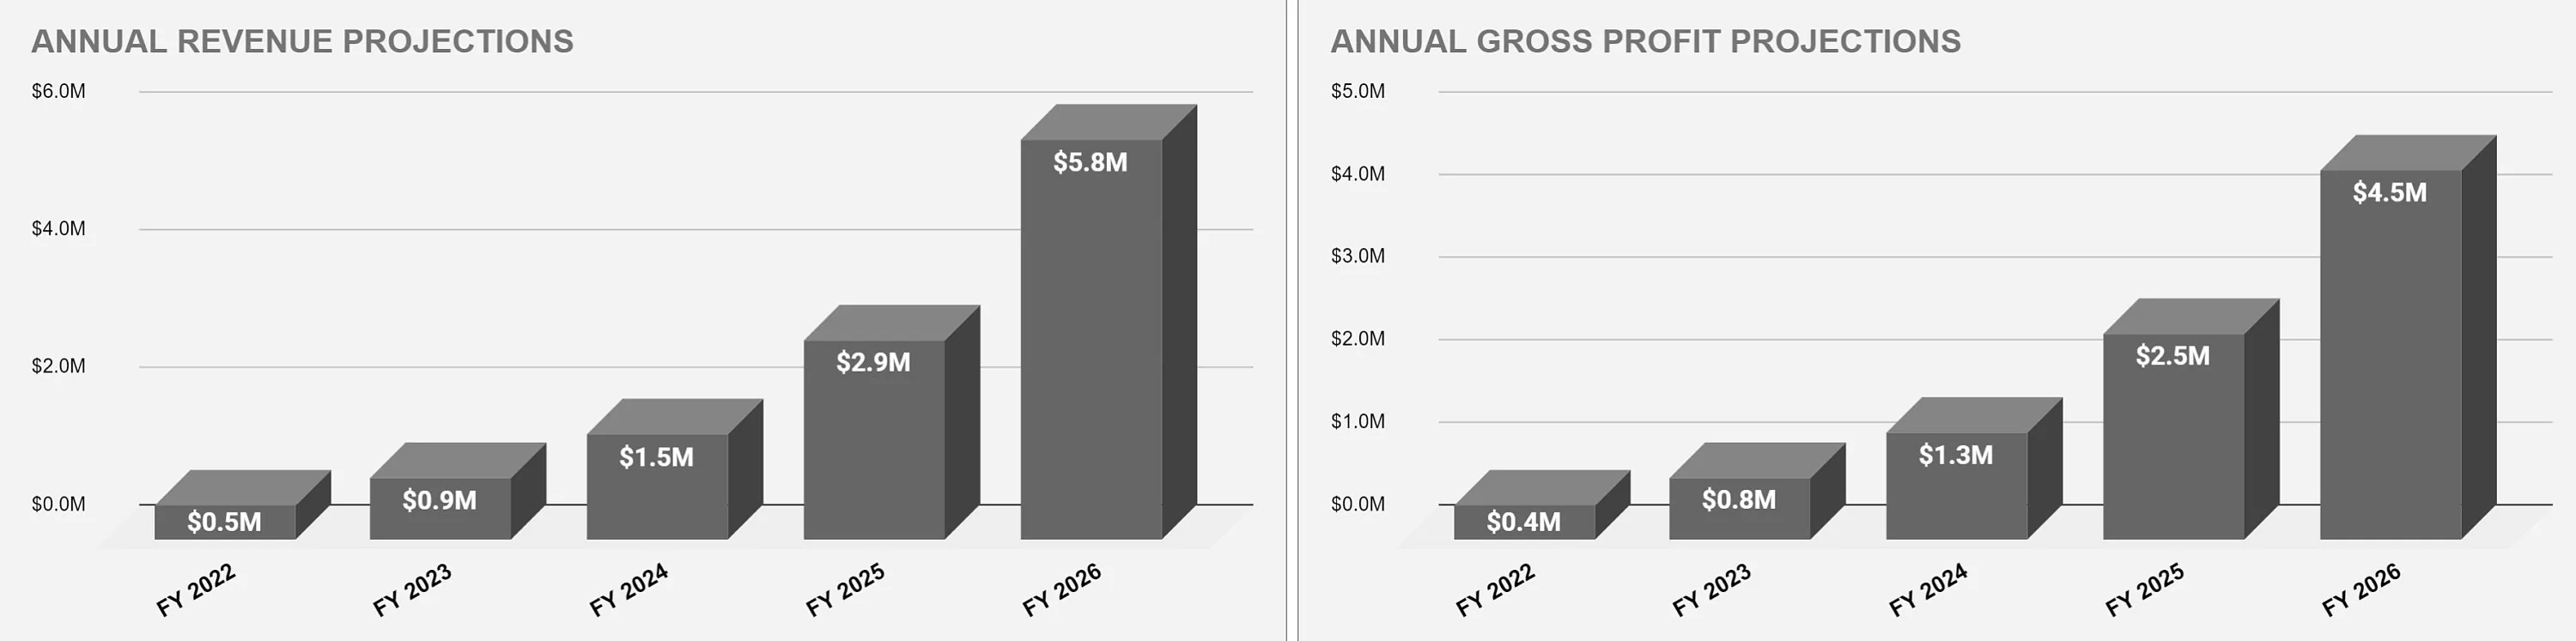
This template is designed to make it easy to create professional visualizations. All the charts have been done so the user simply needs to enter their financial line items into each year and the charts will all update.
Being ‘pitch deck ready' simply speaks to the way these visualizations were put together. The most important things are clarity of fonts, color simplicity, sizing of fonts / axis, spelling, and general clarity of the actual data that is being presented.
You don't want your pitch deck to have confusing financial information in it that is not well known. The data points that are displayed encompass the primary financial performance items that are most commonly sought after by those who are likely to view pitch decks in a meaningful way.
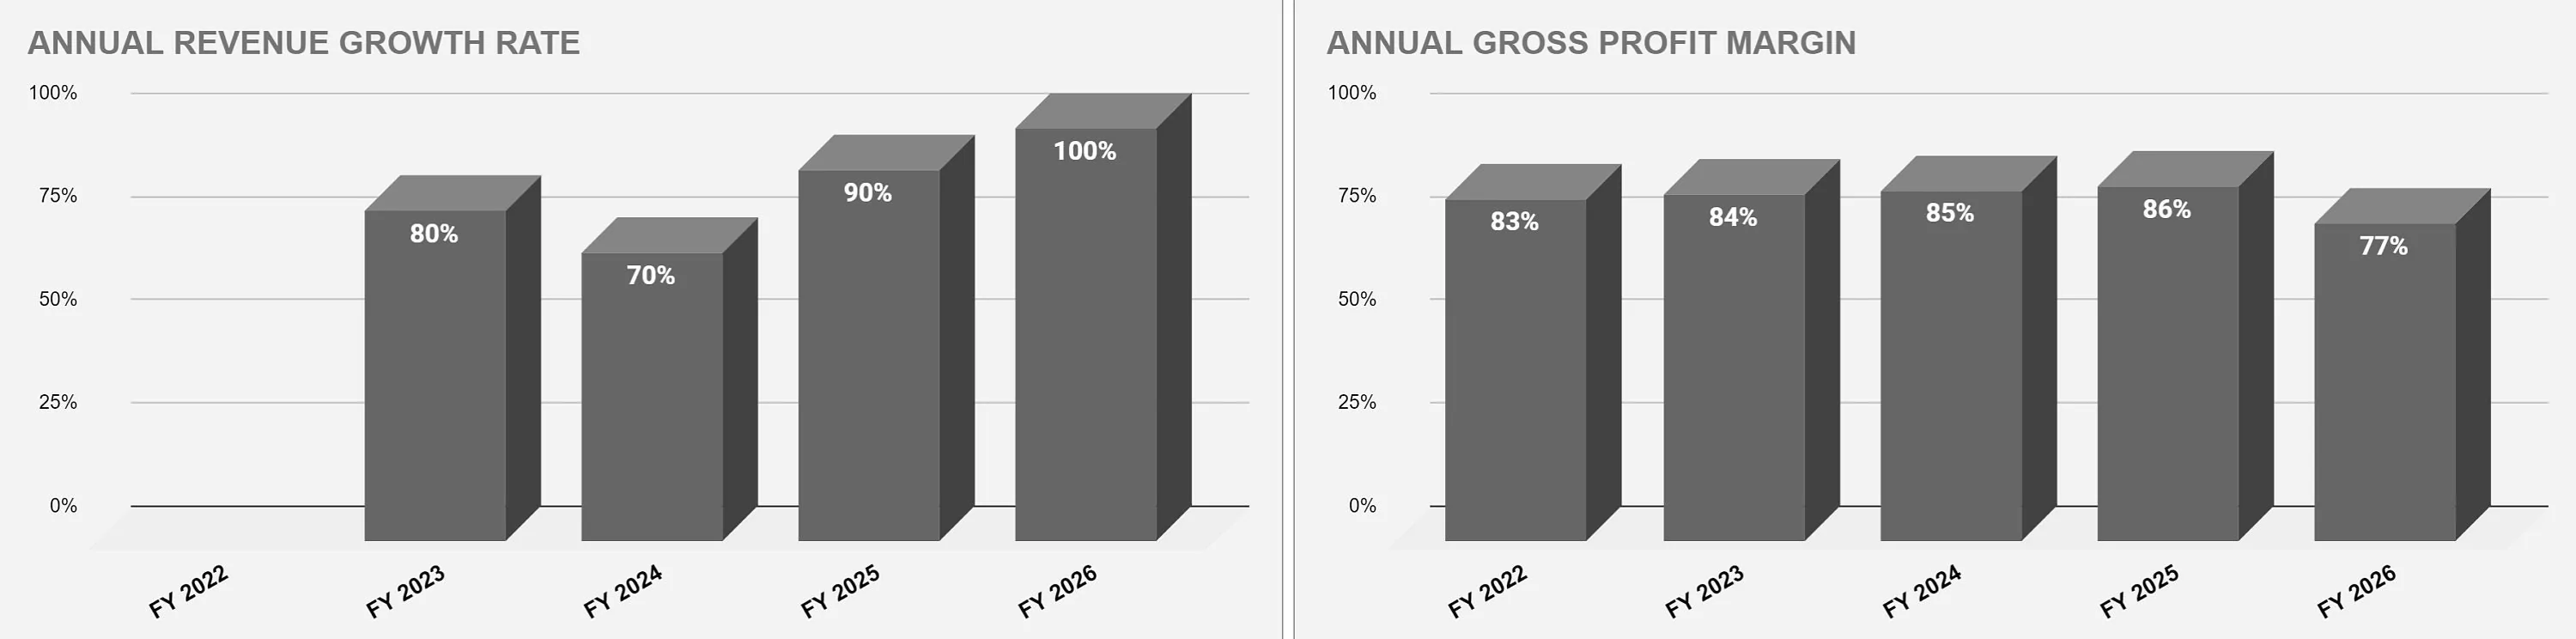
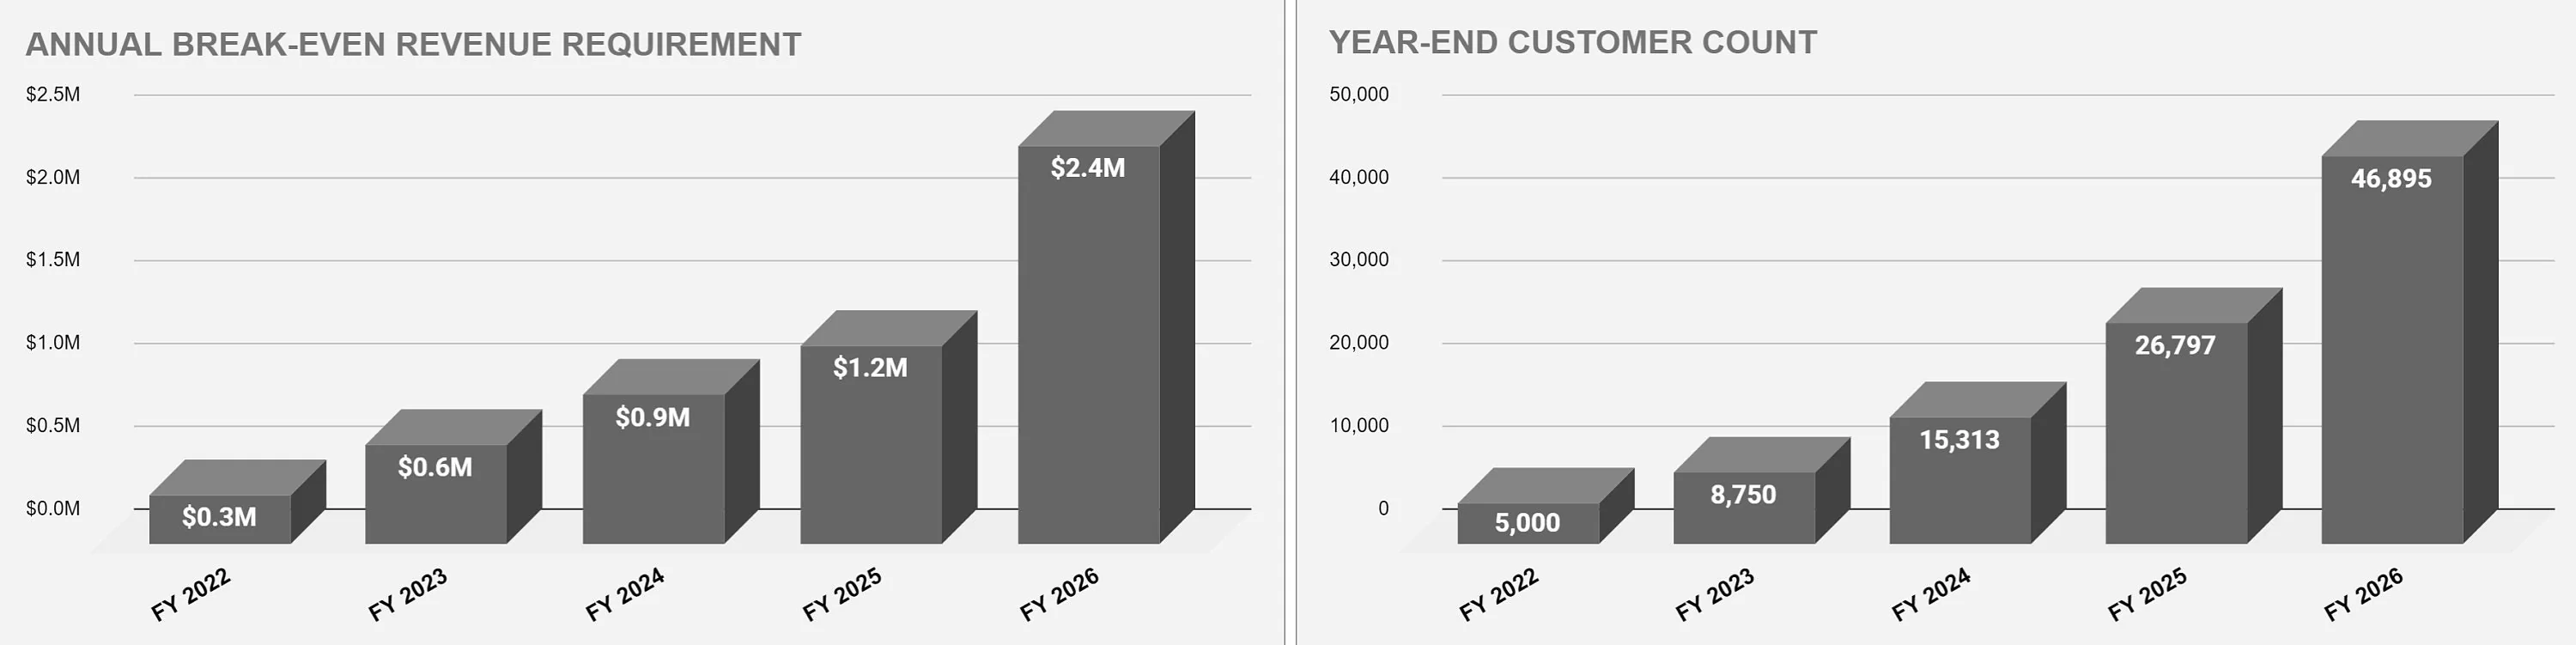
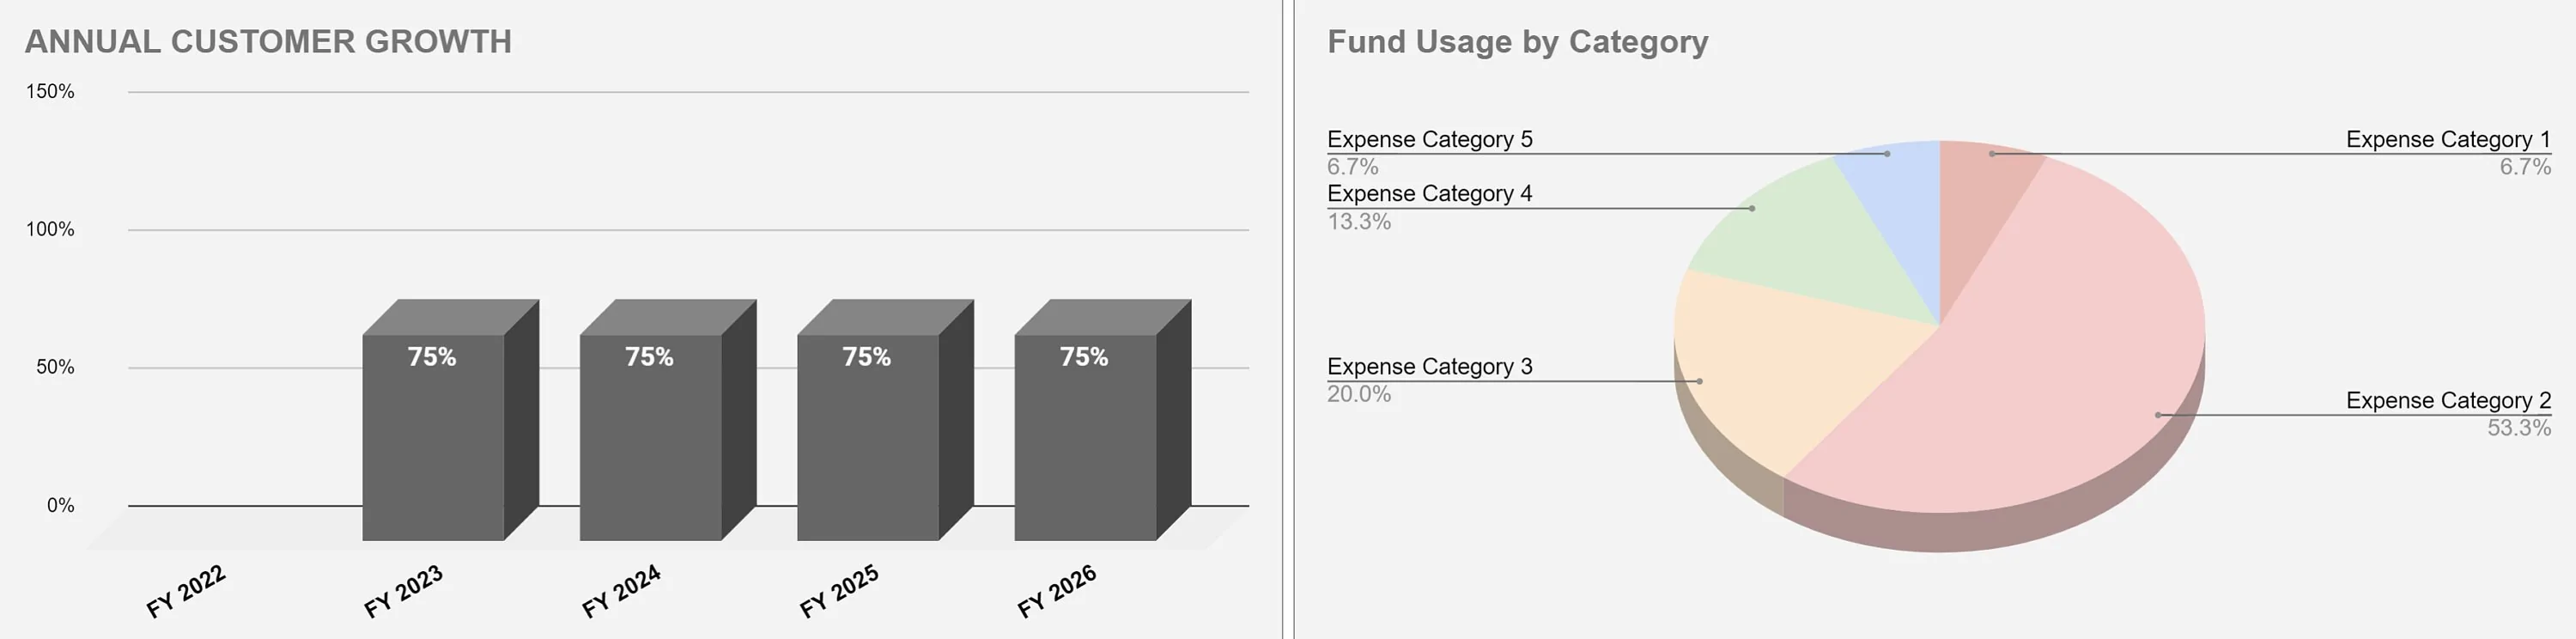
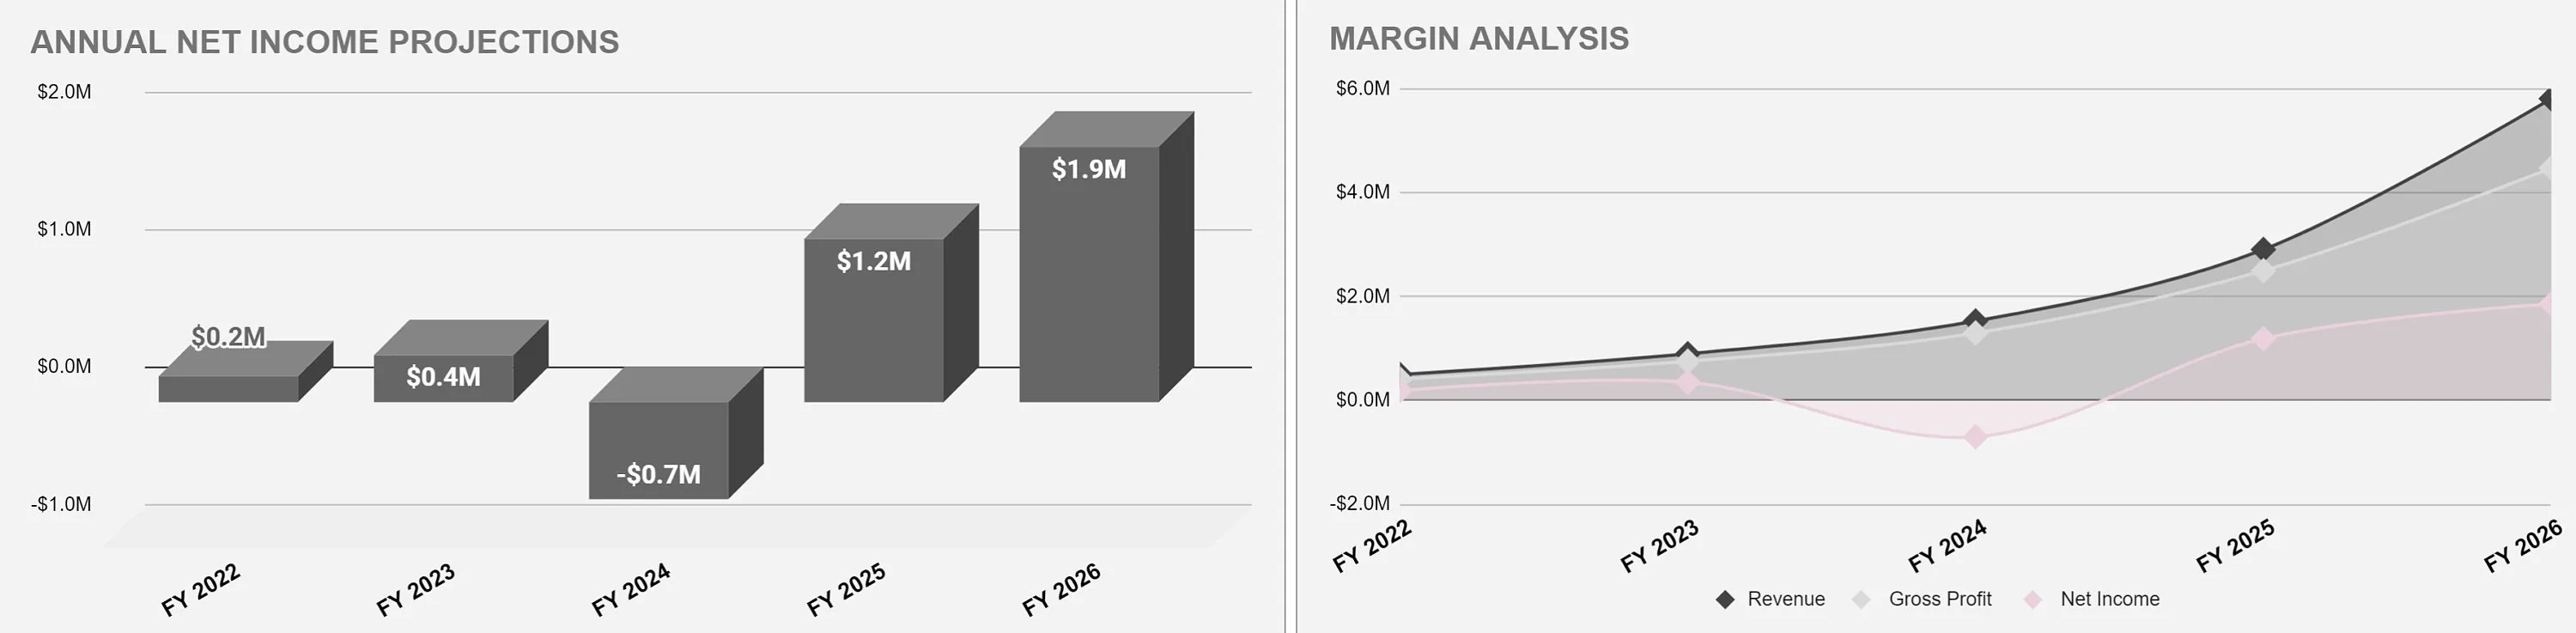
The charts include the following metrics on an annual basis for up to 5 years:
• Revenue
• Gross Profit
• Revenue Growth Rate
• Gross Profit Margin
• Break-even Revenue
• Year-end customers
• Customer Growth
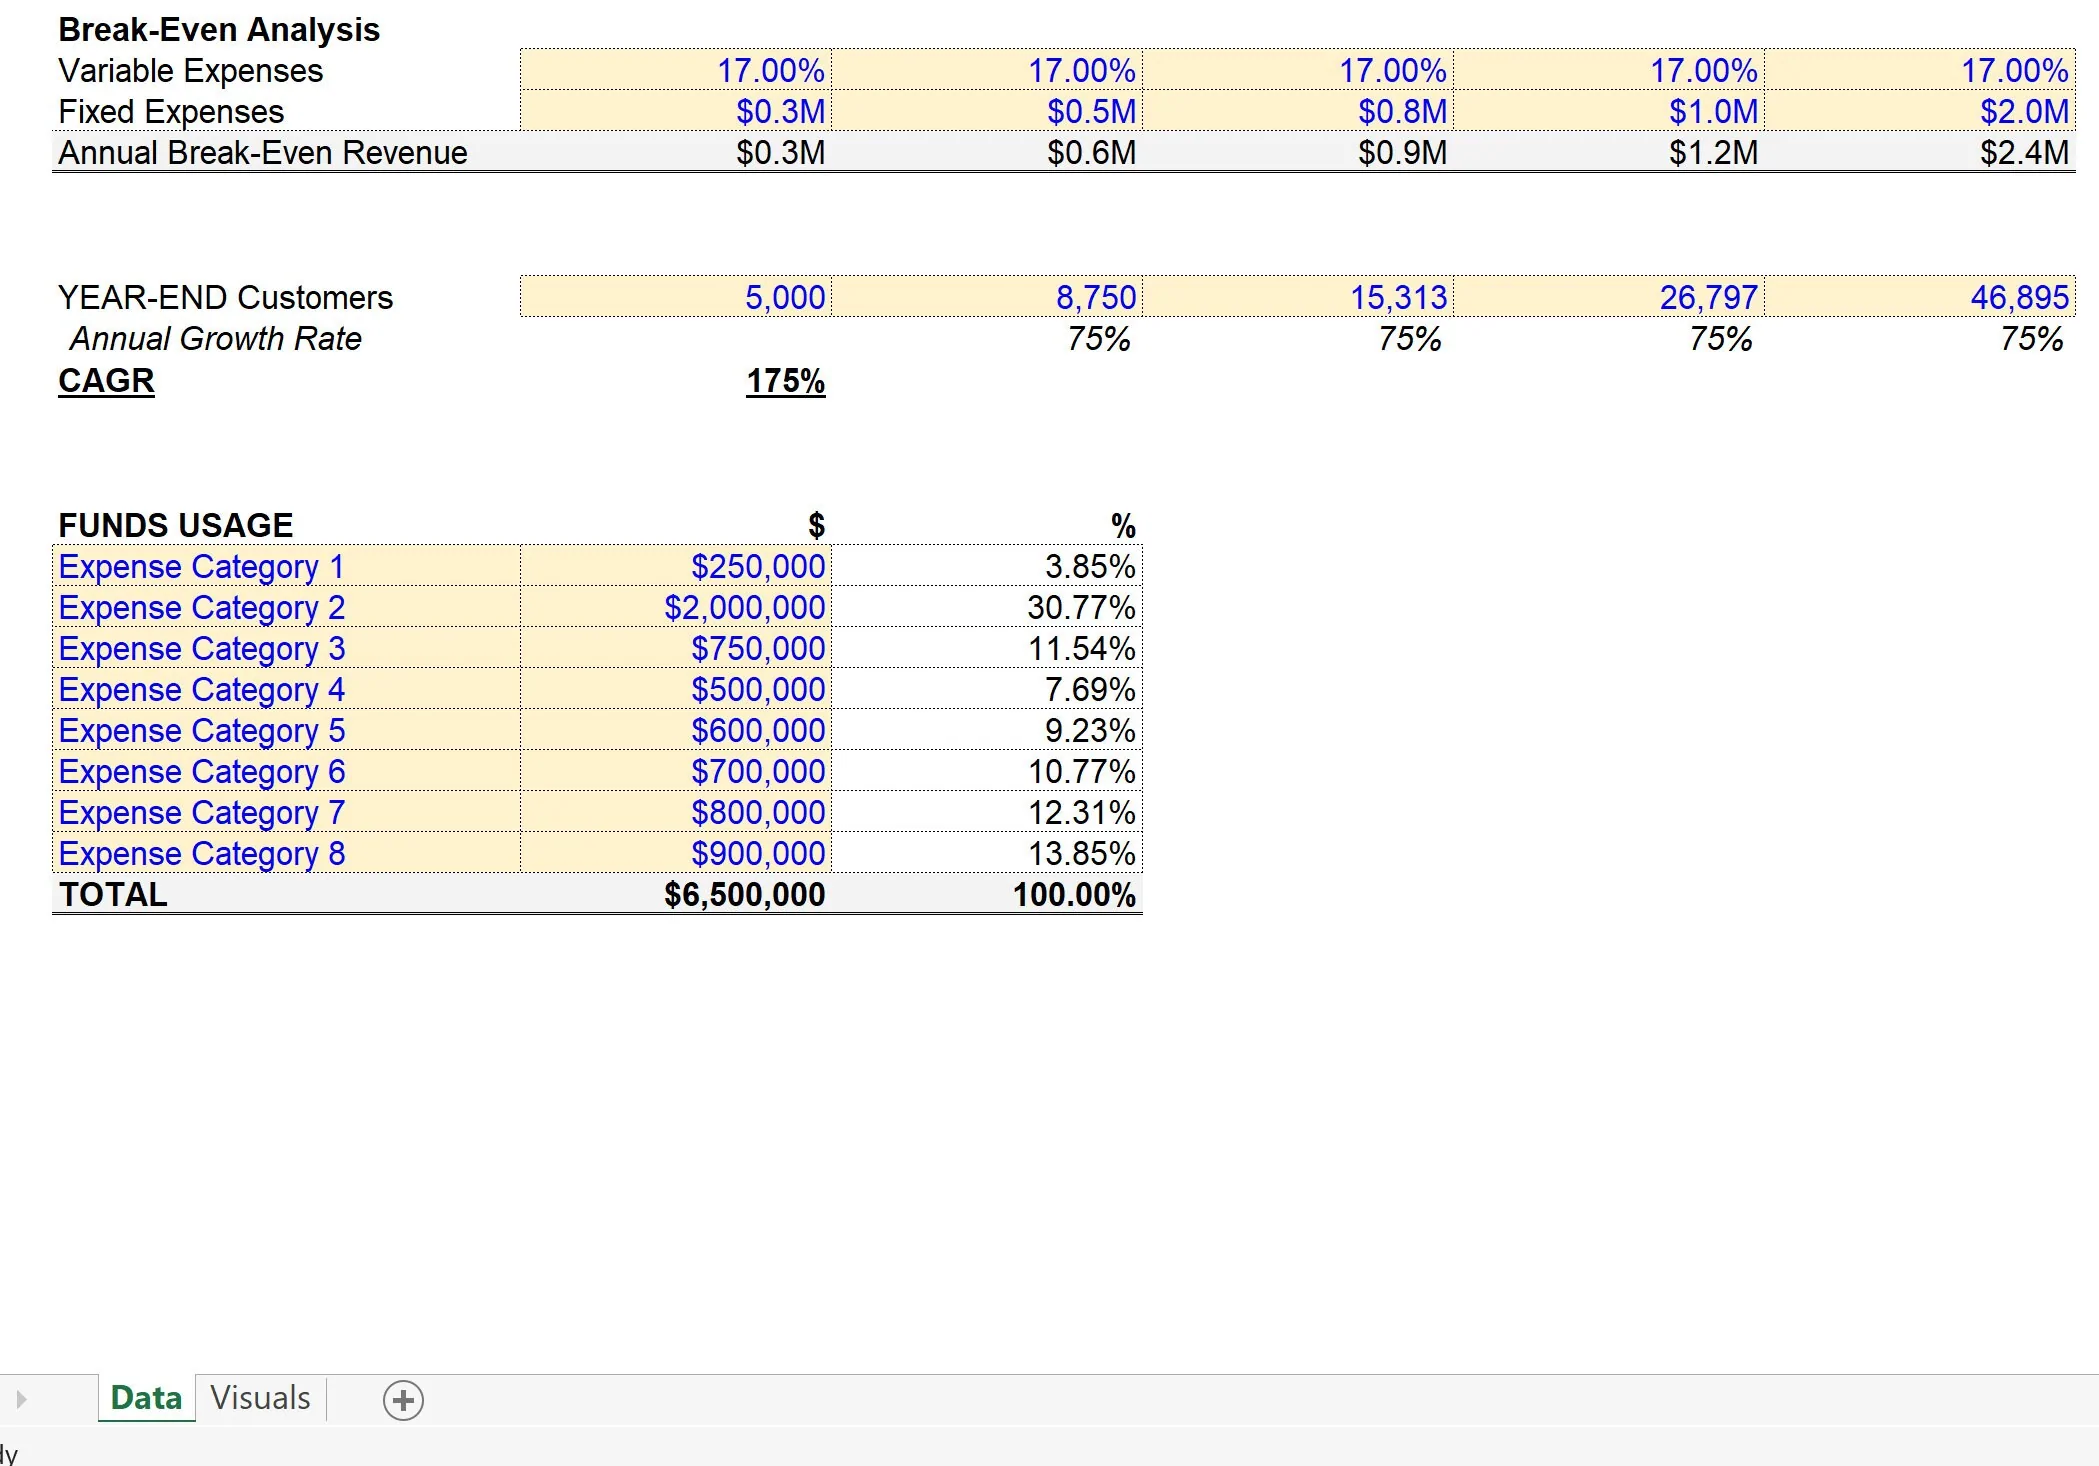
• Fund Usage
• Net Income
• Margin Analysis
• Revenue vs. Break-even Revenue
Nearly any business should have those financial line items solved for if they are building a pitch deck. The only one that is not 100% common is customer count as you may not have relevance for that, but all the rest are fairly analogous to any business.
There is a Google Sheet and Excel version that comes in the download. Note, this can be used for historical presentation purposes as well as partial historical and partial forecast.
Got a question about the product? Email us at support@flevy.com or ask the author directly by using the "Ask the Author a Question" form. If you cannot view the preview above this document description, go here to view the large preview instead.
Source: Best Practices in Pitch Deck Excel: Pitch Deck Financial Visualizations Template Excel (XLSX) Spreadsheet, Jason Varner | SmartHelping
ABOUT THE AUTHOR
I graduated in 2011 with a Bachelor's degree in Accounting and began my career as a financial analyst at a small chain of auto repair shops. After gaining valuable experience, I launched my own practice specializing in real estate underwriting, later expanding into general business modeling.
I honed my spreadsheet modeling expertise by completing over 400 projects on Upwork with a 100% success
... [read more]
Ask the Author a Question
You must be logged in to contact the author.
