

Online Shop Financial Model – Excel XLSX
Excel (XLSX)
BENEFITS OF THIS DOWNLOADABLE EXCEL DOCUMENT
- The model generates the three financial statements.
- Calculates the relevant metrics (Free Cash Flows to the Firm, Internal Rate of Return, payback period, cash on cash multiple)
- The financing options for the project include a standard long term loan as well as an overdraft facility and of course equity funding from investors.
ECOMMERCE EXCEL DESCRIPTION
Online Shop Financial Model presents the business case of a brand new start-up Online Shop with an upfront investment in a website, SEO, logo, copywriting. The model generates the three financial statements as well as the cash flows and calculates the relevant metrics (Free Cash Flows to the Firm, Internal Rate of Return, payback period, cash on cash multiple). The financing options for the project include a standard long term loan as well as an overdraft facility and of course equity funding from investors.
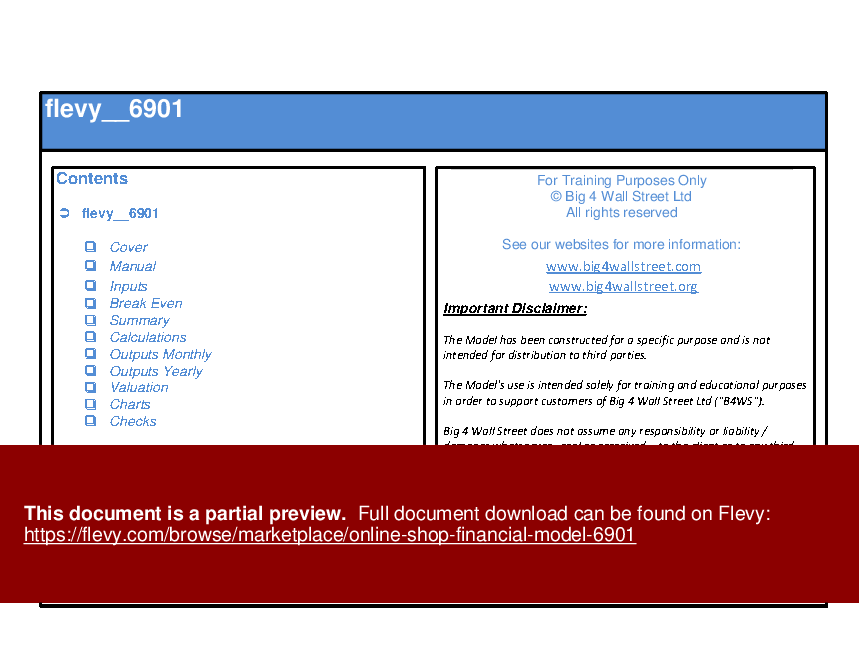
So a quick overview of the model, in the contents tab you can see the structure of the model and by clicking on any of the headlines to be redirected to the relevant worksheet.
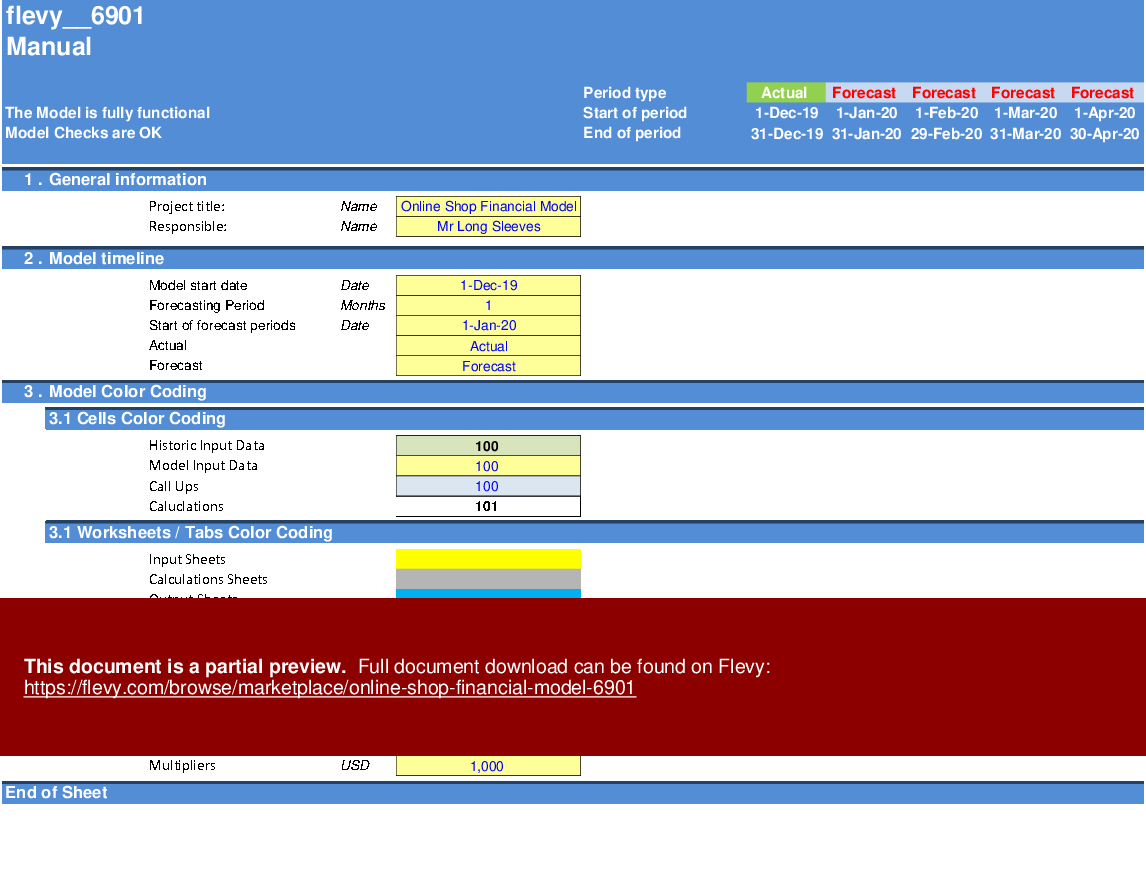
On the manual tab, you are able to feed the general information for the model such as: project name & title, responsible, the timeline of the model and date and currency conventions.
Additionally, there is a description of the color-coding of the model in the same tab. Inputs are always depicted with a yellow fill and blue letters, call up (that is direct links from other cells) are filled in light blue with blue letters while calculations are depicted with white fill and black characters.
There is also a color coding for the various tabs of the model. Yellow tabs are mostly assumptions tabs, grey tabs are calculations tabs, blue tabs are outputs tabs (that is effectively results or graphs) and finally, light blue tabs are admin tabs (for example: the cover page, contents, and checks).
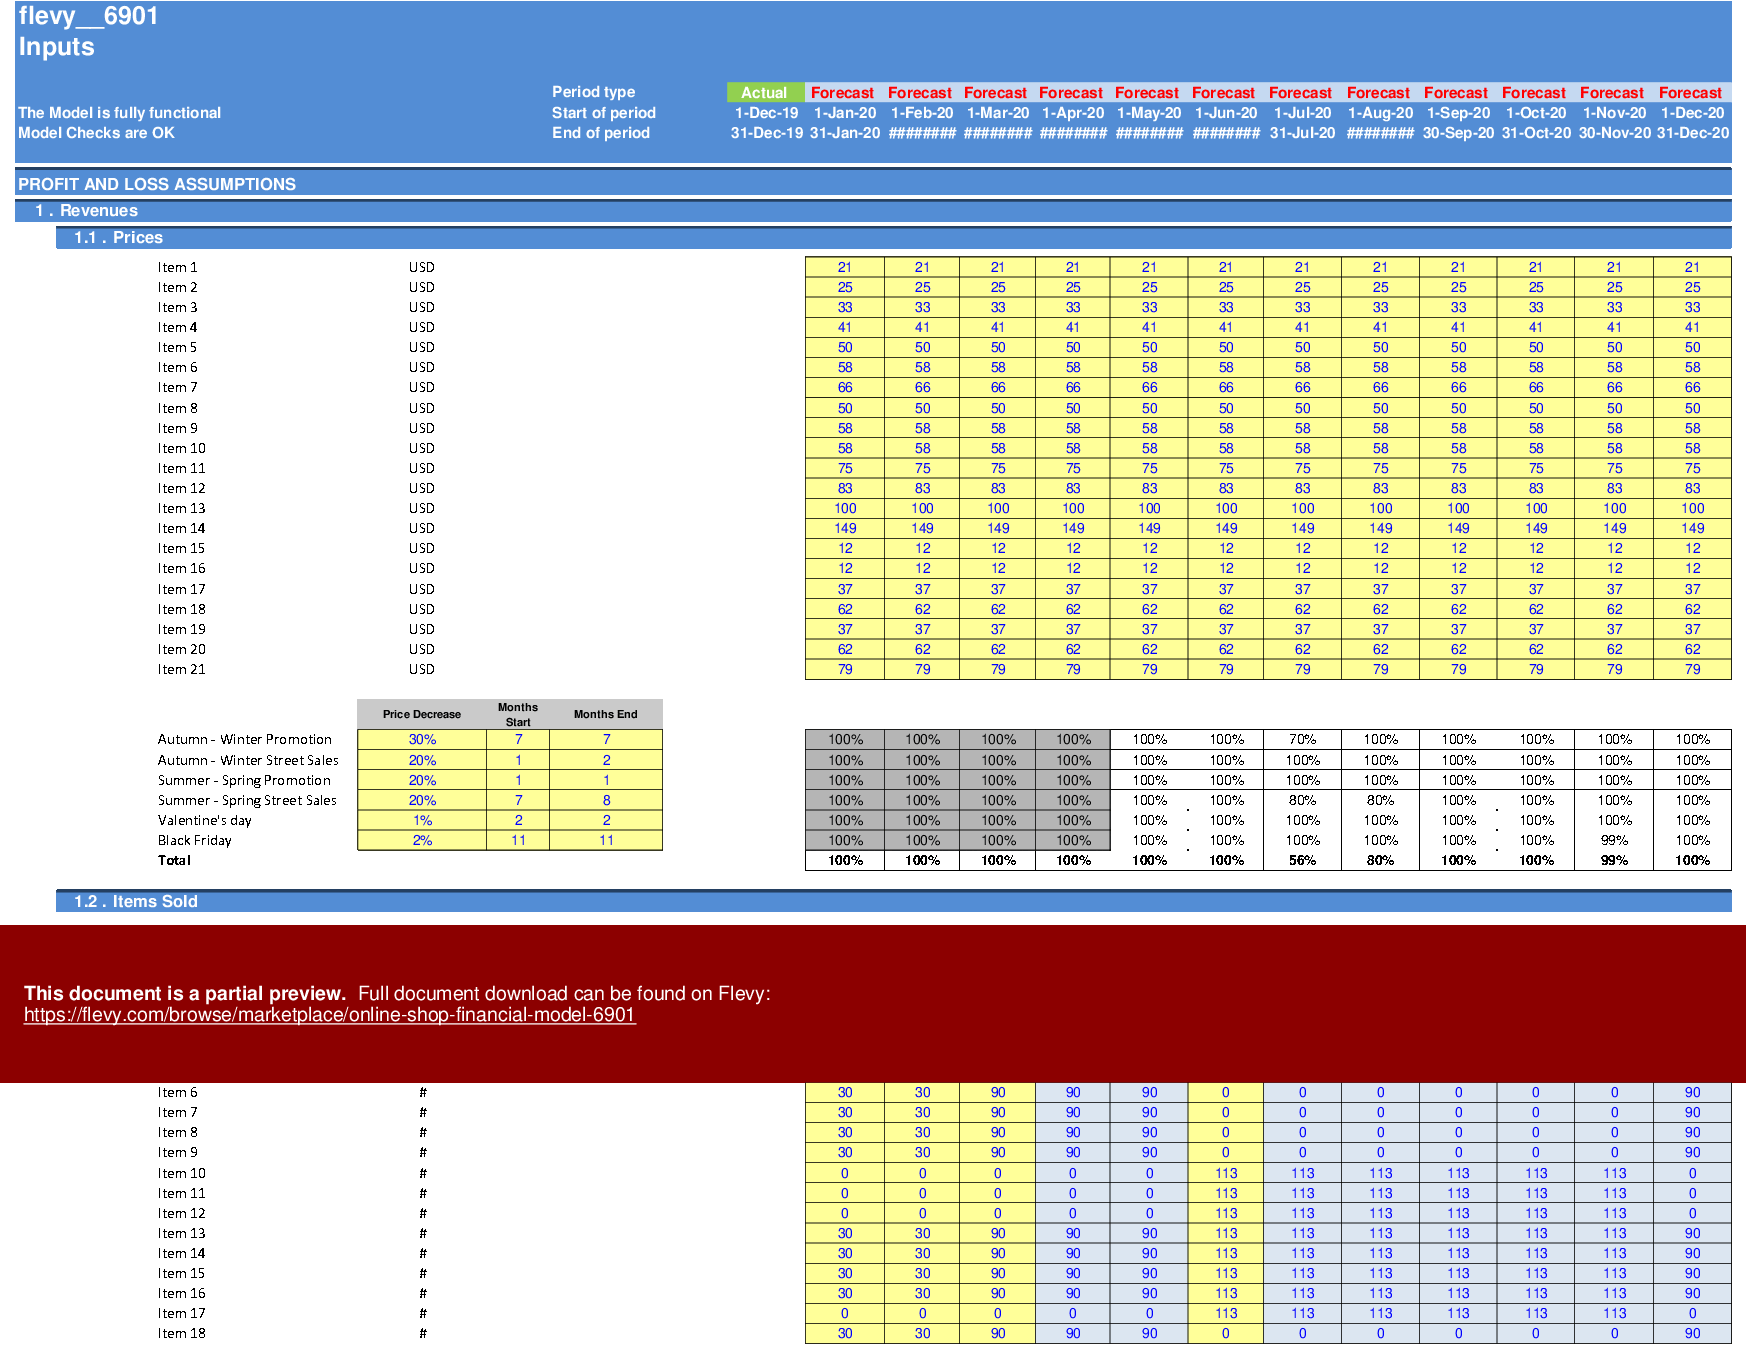
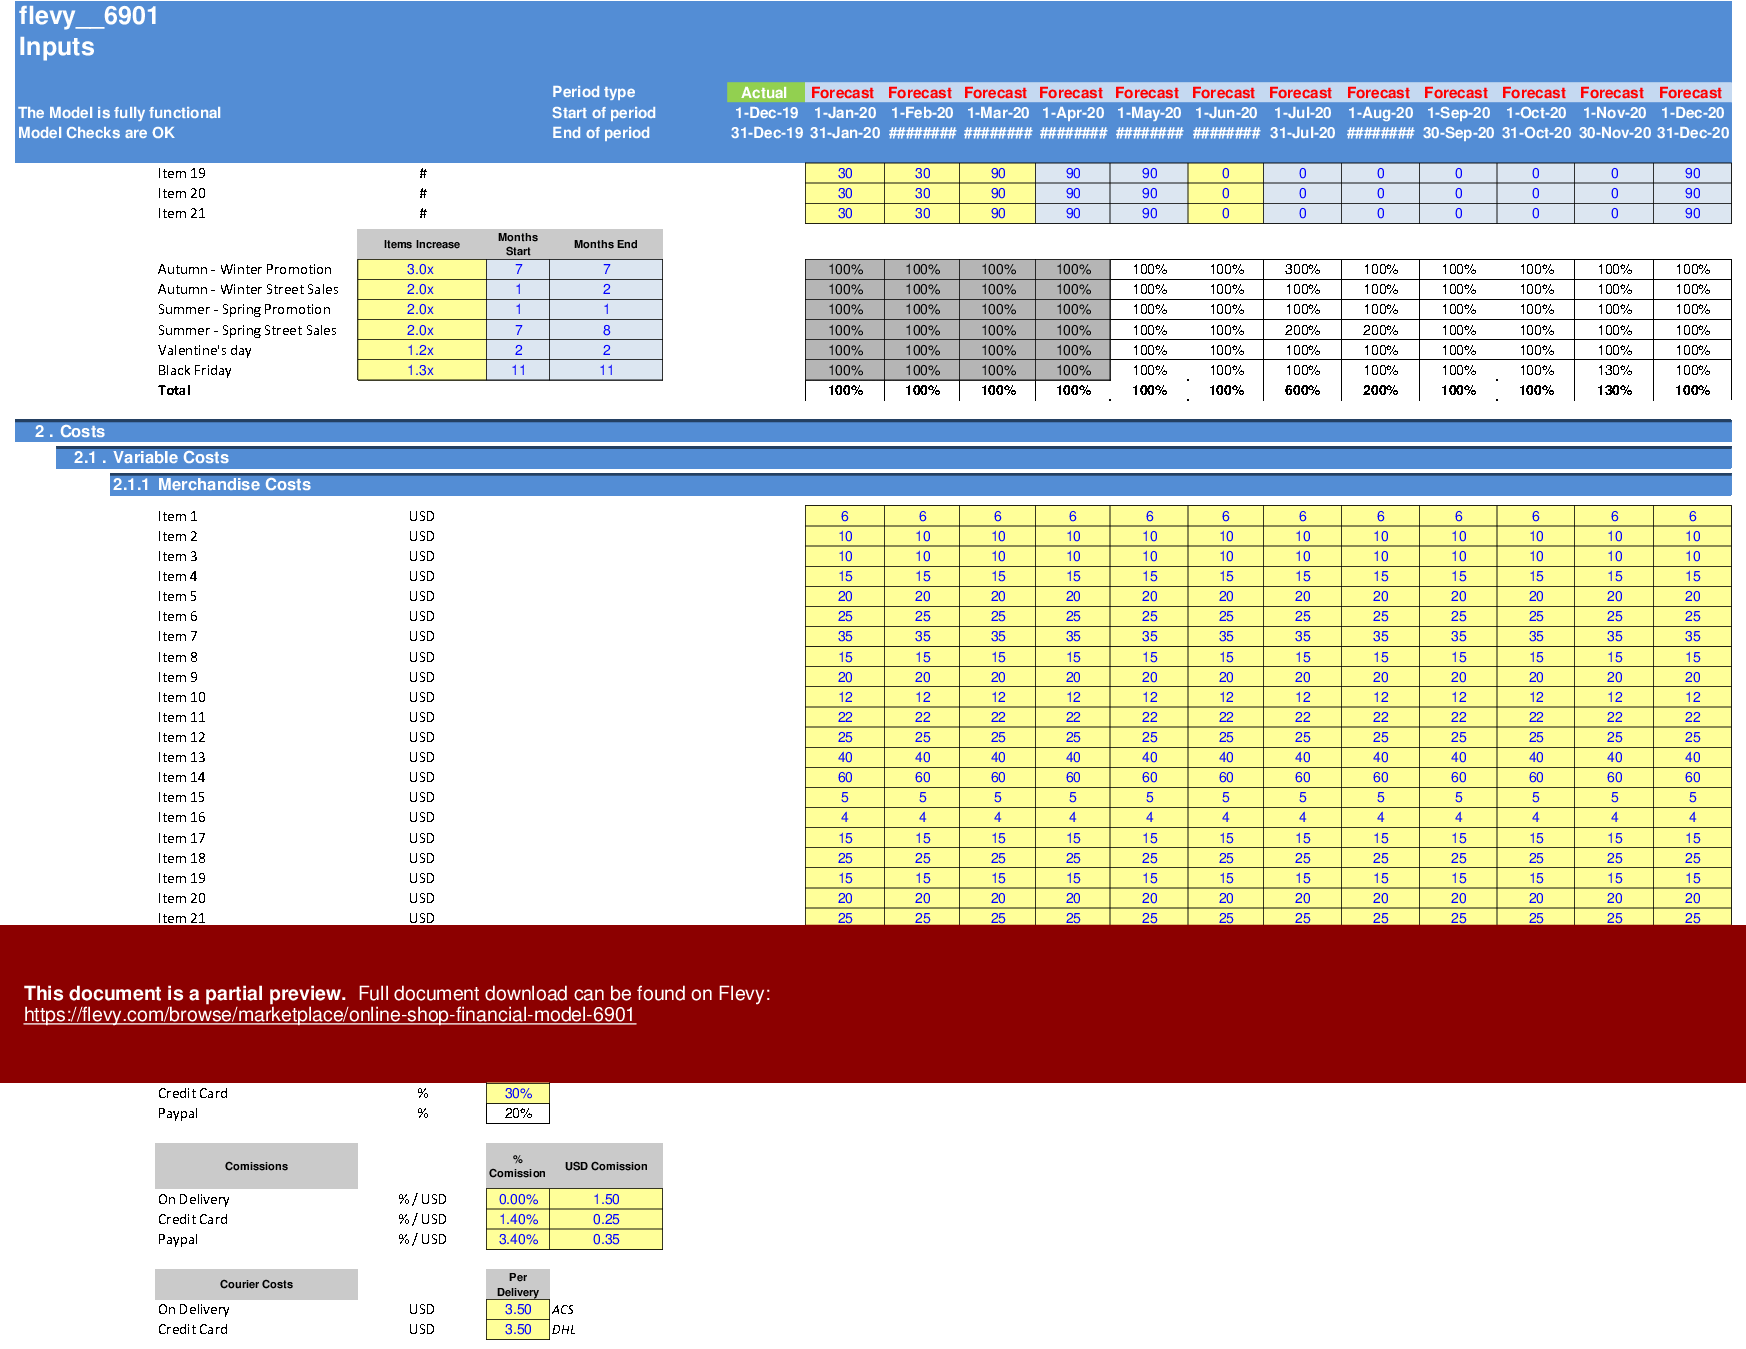
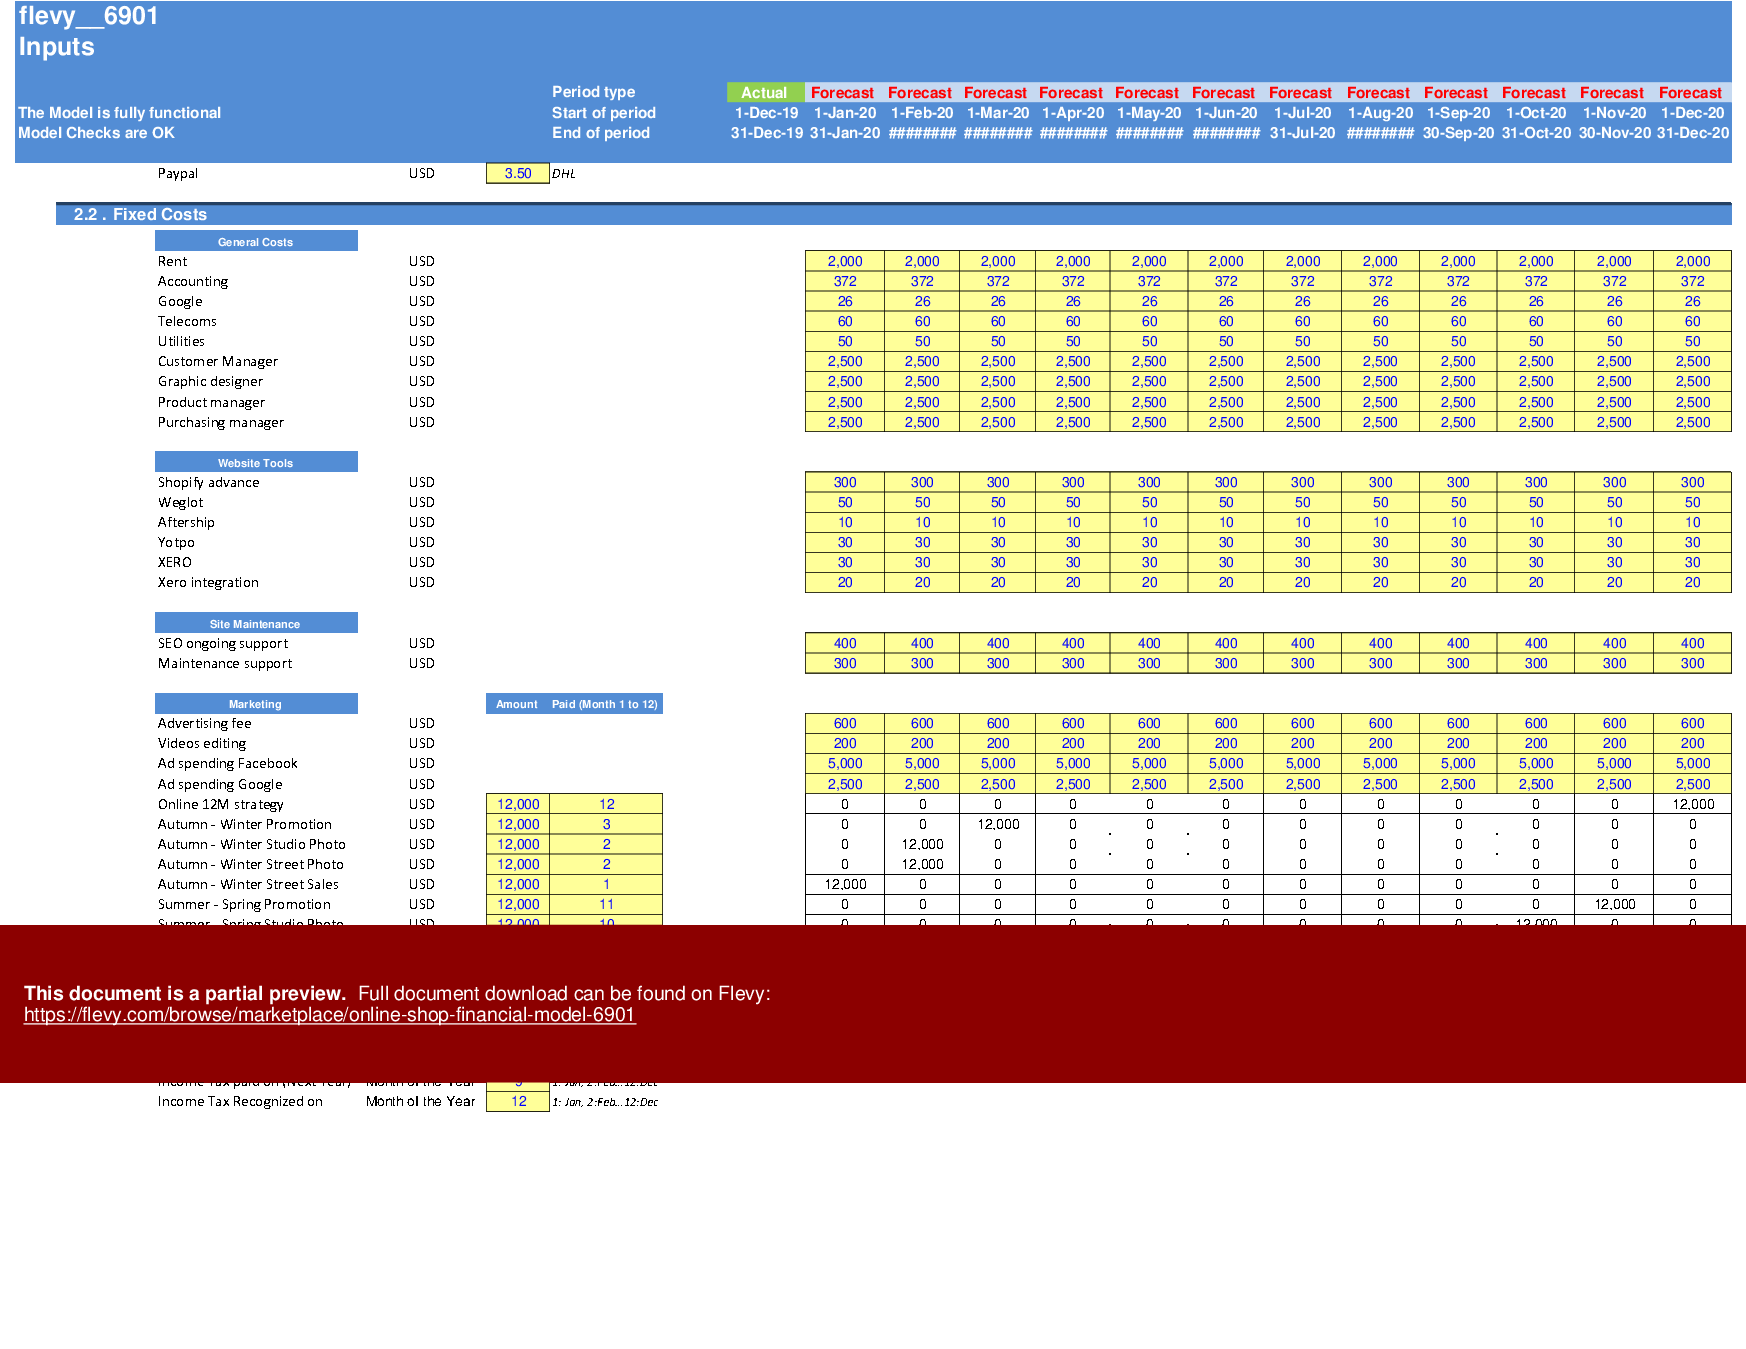
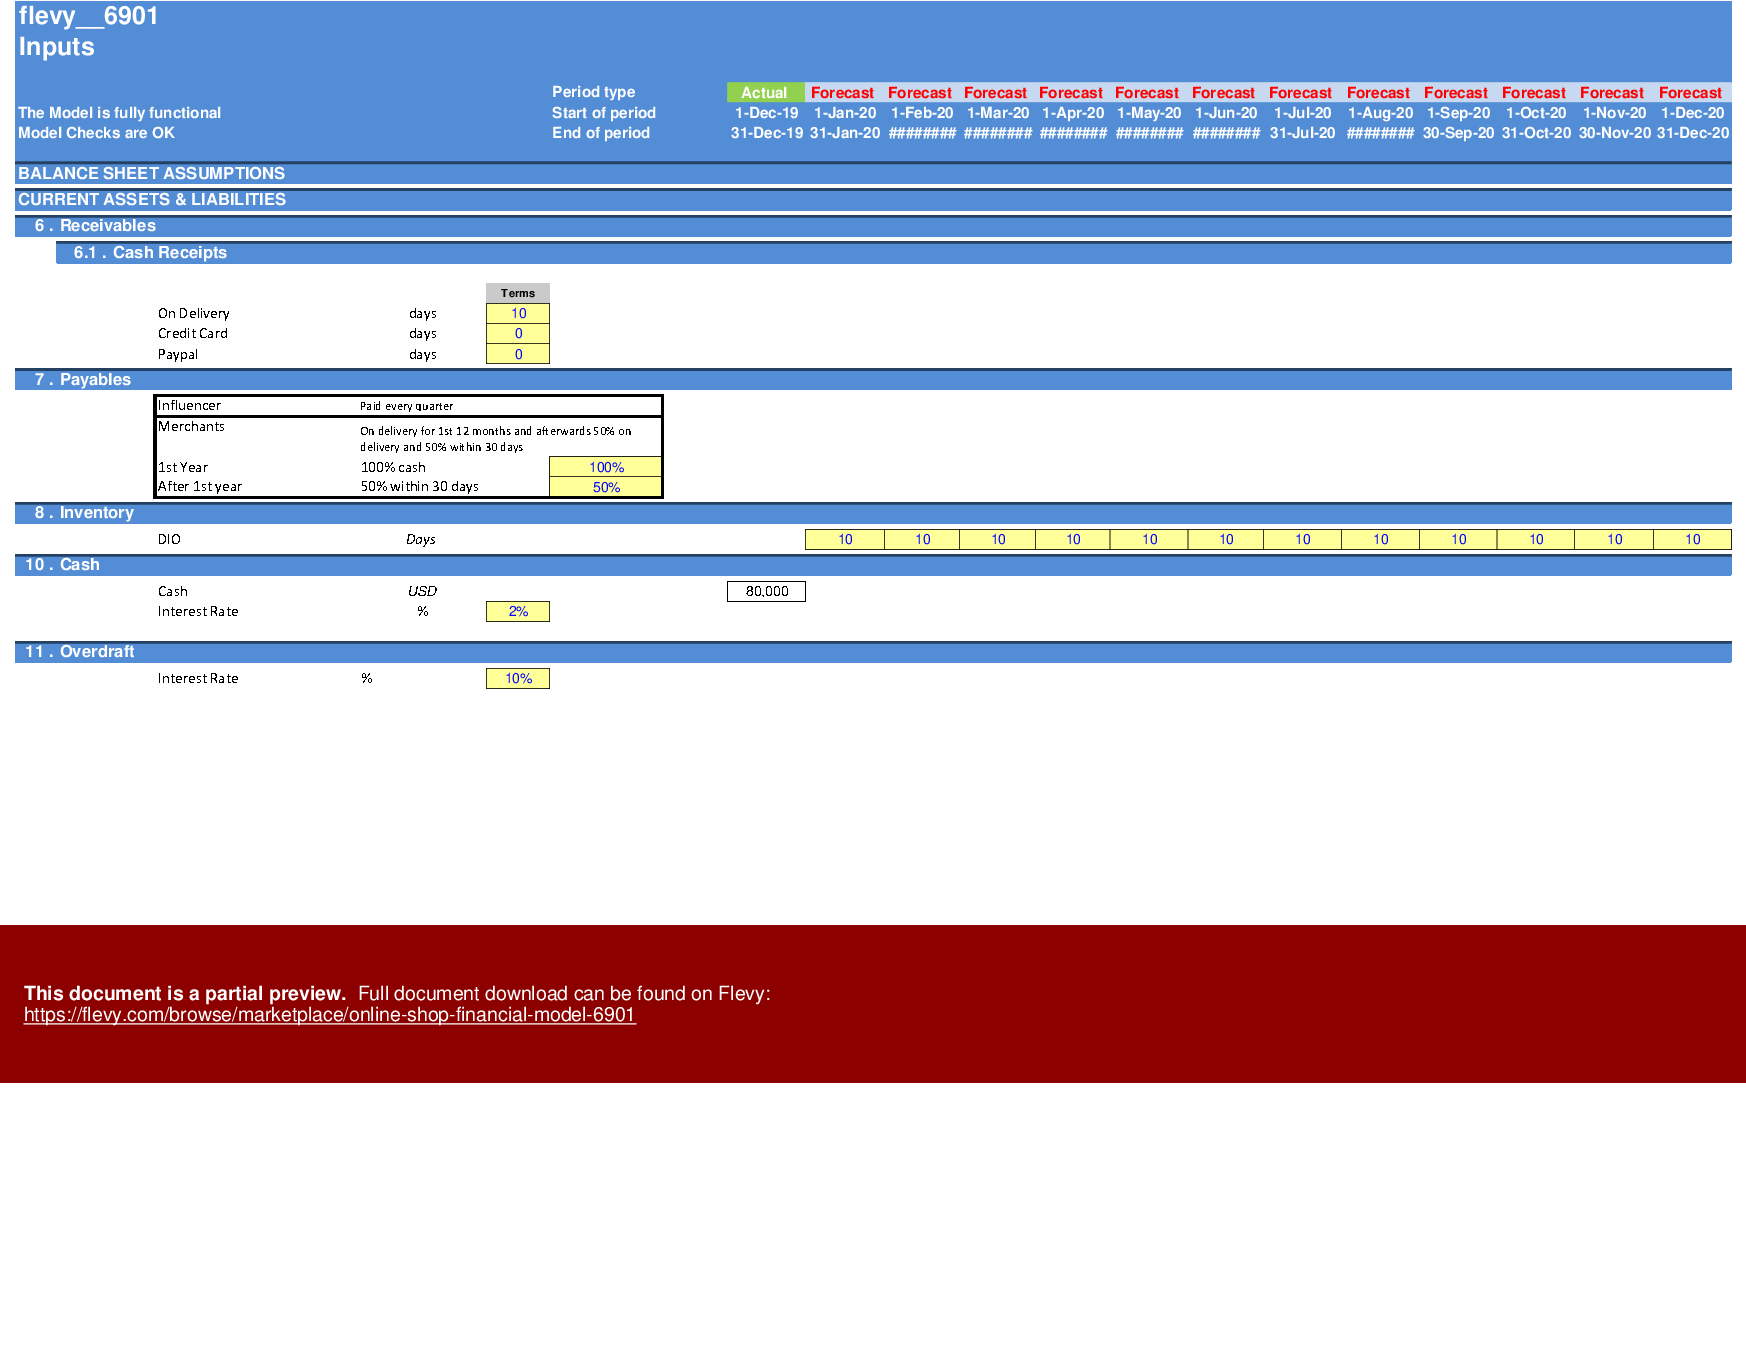
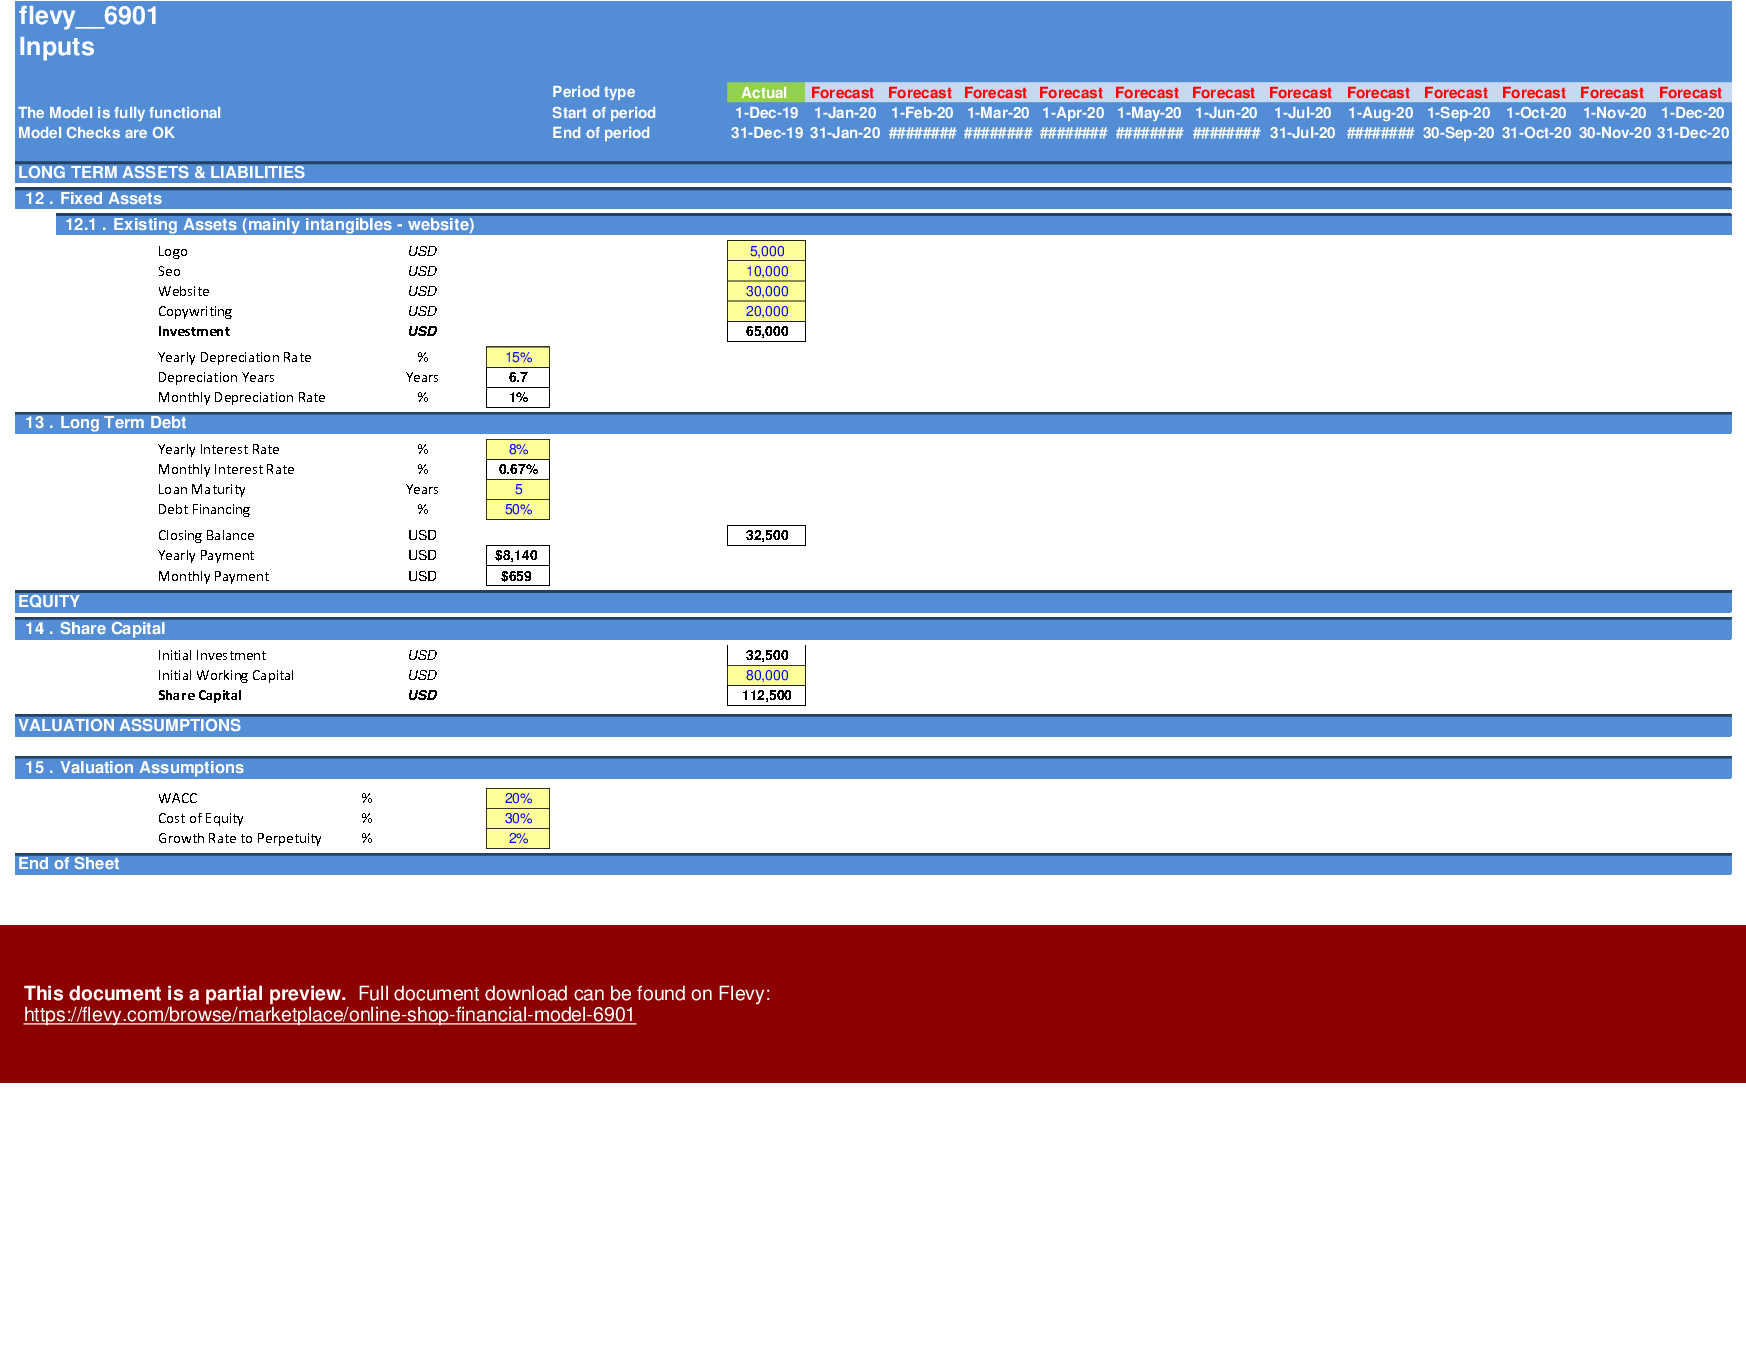
Moving on to the Inputs: detailed inputs for revenues (21 group of items, price per item, price promotions, quantity of items sold, quantity boosts due to promotion), costs splits between variable costs (merchandise costs, influencer, shipping & card commission costs) and fixed costs (general costs, website tools, site maintenance, marketing), working capital (receivables, payables, and inventory), fixed assets (includes website, SEO, logo, copywriting), debt & equity financing as well as valuation assumptions (such as discount rates used in the weighted average cost of capital).
In the summary tab, you are able to see a high-level report with the main financial & accounting ratios. It can be readily printed on one page for your convenience.
Another useful tab is the break even analysis where you can see the items needed to be sold every day and their dollar value in order to break even.
Calculations: This is where all calculations are performed. The revenues are calculated based on the items sold, pricing, promotions, and campaign boosts and deducting the variable and fixed costs the operating profit is resulting in. Based on the assets financed and the gearing of the financing the interest and depreciation are occurring. By using the working capital assumptions the impact of the business cycle is presented. Finally depending on the level of the investment considered the relevant debt financing is calculated (Long term debt and overdraft).
In the Outputs Monthly tab: everything is aggregated here into the relevant statements: profit and loss, balance sheet and cash flow on a monthly basis.
The same info can be found on the Outputs Yearly tab, however on a yearly basis now.
Moving to the Valuation tab, a valuation is performed by using the free cash flows to the firm and then a series of investment metrics are presented (Internal Rate of Return, Payback Period, Cash on Cash multiple).
In the Charts tab: Various graphs present the revenues, average price, costs, profitability, margins, and overdraft & cash.
Checks: A dedicated worksheet that makes sure that everything is working as it should!
Important Notice: Yellow indicates inputs and assumptions that the user is able to change, blue cells are used for called up cells, and white cells with black characters indicates calculation cells.
Got a question about the product? Email us at support@flevy.com or ask the author directly by using the "Ask the Author a Question" form. If you cannot view the preview above this document description, go here to view the large preview instead.
Source: Best Practices in Ecommerce, Integrated Financial Model Excel: Online Shop Financial Model Excel (XLSX) Spreadsheet, Big4WallStreet
ABOUT THE AUTHOR
We help small and midsize businesses' leaders with their strategic problems by creating or improving financial models, implementing tools to drive efficiency, performance, and better decision making.
With over 15 years of experience in Financial & Business Modeling / Planning, Performance & Analysis (Ernst & Young, Toyota, Viohalco and Upstream), we have developed strong business
... [read more]
Ask the Author a Question
You must be logged in to contact the author.
