 Click main image to view in full screen. Unlock all 12 preview images:
M&A Financial Due Diligence Model | 5Y QoE, Debt & IRR – Excel XLSX
Excel (XLSX) + supplemental PDF


BENEFITS OF THIS DOWNLOADABLE EXCEL DOCUMENT
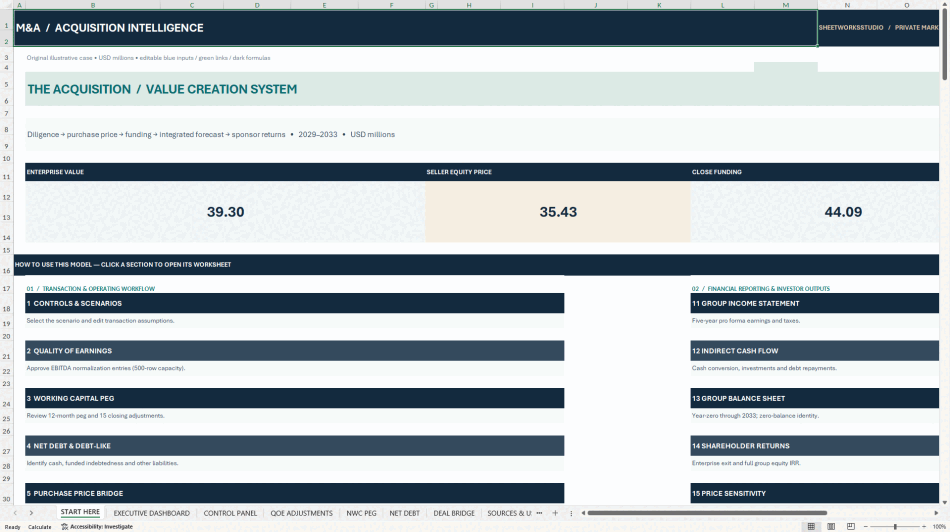
- Assess purchase economics through 500-line Quality-of-Earnings adjustments, a 12-month NWC peg, debt-like items, closing true-ups and an enterprise-to-equity purchase price bridge.
- Model five annual years of buyer/target operations, revenue and cost synergies, senior/mezzanine acquisition debt, cash sweeps, consolidated financial statements and combined-equity exit IRR.
- Explore Base, Downside and Upside deal scenarios plus 49 entry/exit multiple sensitivities in a 20-sheet workbook with eight native linked charts, model checks and a 38-page English guide.
M&A (MERGERS & ACQUISITIONS) EXCEL DESCRIPTION
🏢 M&A ACQUISITION & FINANCIAL DUE DILIGENCE | 5-YEAR EXCEL MODEL
🔎 Quality of Earnings • ⚖️ NWC & Net Debt • 🏦 Acquisition Financing • 📈 Synergies • 💼 Equity IRR
Evaluate acquisition economics with a structured, editable Excel financial model connecting normalized target earnings, enterprise-to-equity purchase price, closing funding, combined business performance, acquisition debt and illustrative investor returns.
The M&A Acquisition & Financial Due Diligence Model by SheetworksStudio is designed for corporate development teams, private equity analysts, finance managers, M&A advisers and acquisition investors seeking one transparent framework for transaction screening and internal deal analysis.
The five-year illustration runs from 2029 to 2033. The model includes buyer and target operating forecasts, a combined three-statement forecast and a dedicated executive investment dashboard.
This is an annual model, not a monthly transaction closing or liquidity forecast.
━━━━━━━━━━━━━━━━━━━━
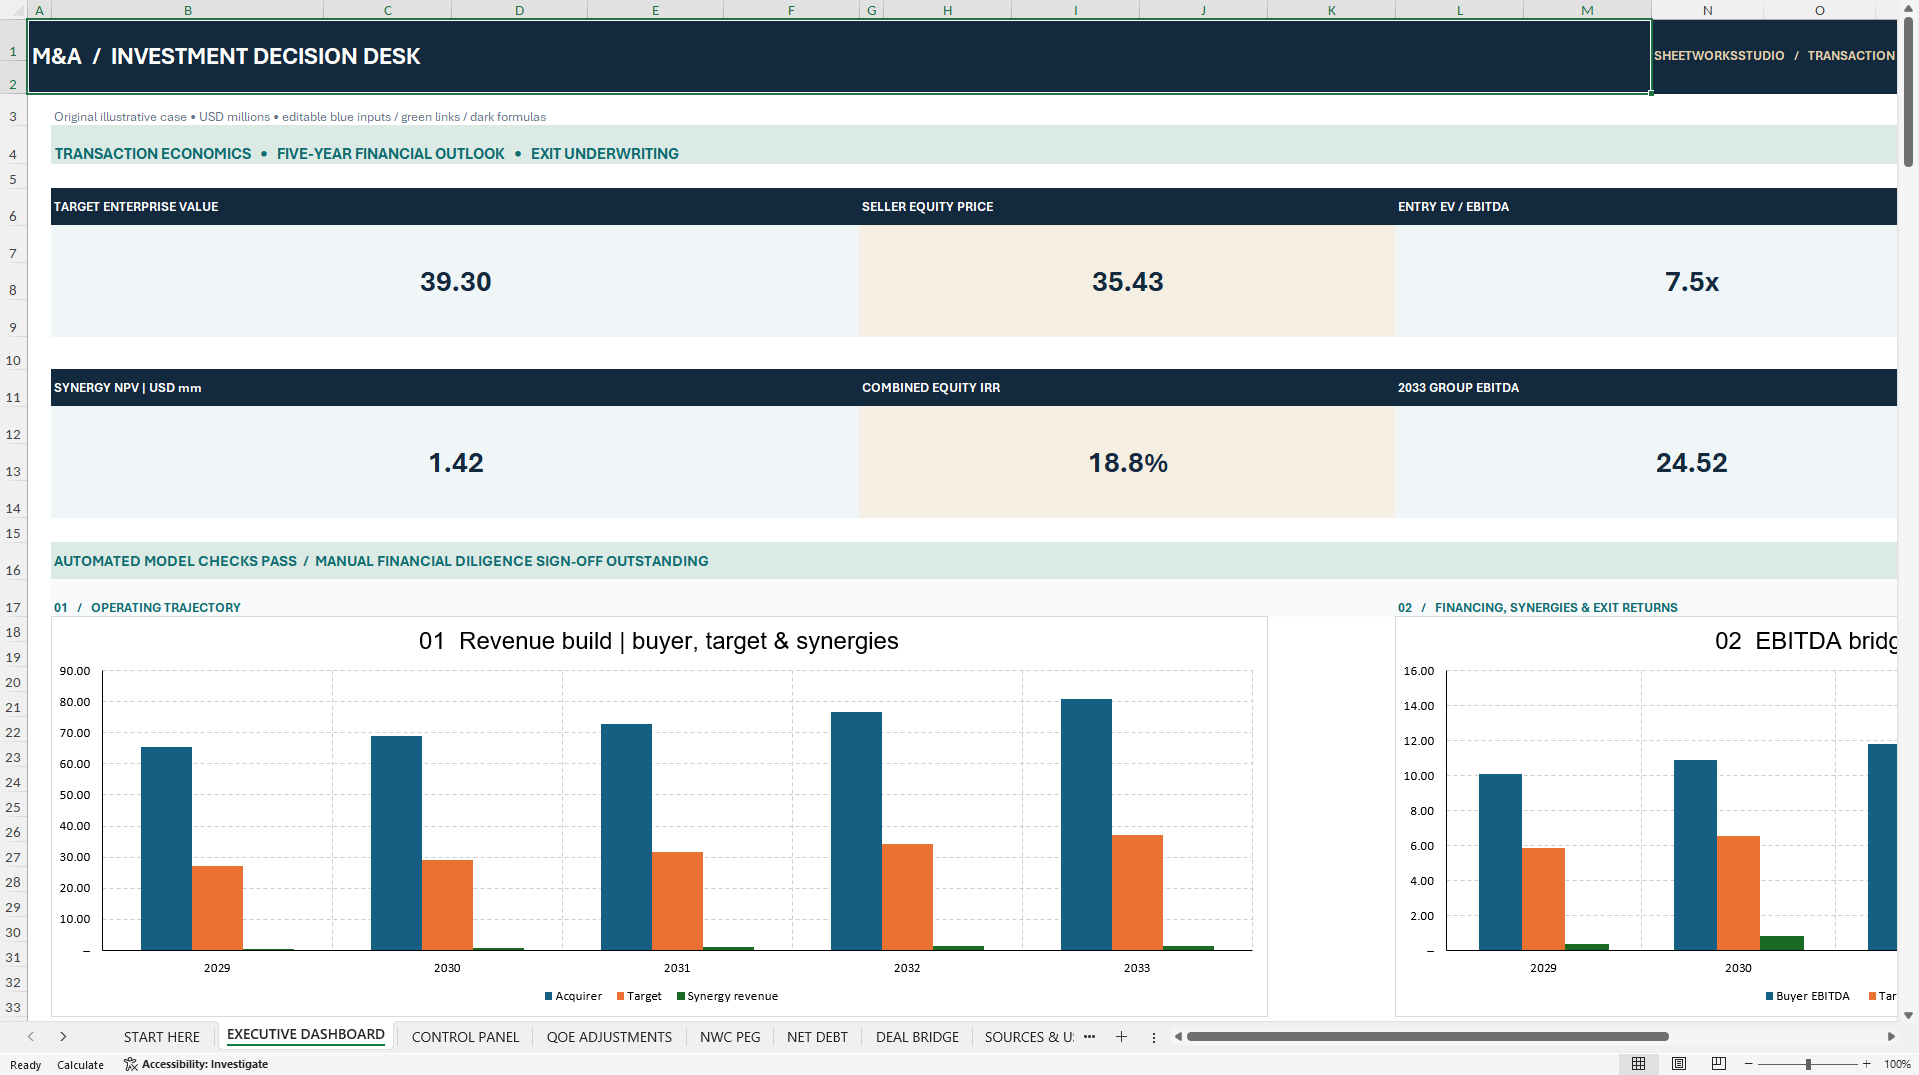
📊 01 | EXECUTIVE TRANSACTION DASHBOARD
━━━━━━━━━━━━━━━━━━━━
Review key acquisition economics and return indicators together:
• Target Enterprise Value
• Seller Equity Purchase Price
• Entry Enterprise Value / EBITDA Multiple
• Closing Acquisition Leverage
• Synergy Net Present Value
• Five-Year Combined Equity IRR
• Forecast Combined EBITDA
• Closing Cash
• Automated Model Status and Manual Due-Diligence Reminder
EIGHT NATIVE EXCEL DASHBOARD CHARTS
• Buyer, Target and Synergy Revenue
• EBITDA Performance and Value Creation
• EBITDA versus Operating Cash Flow
• Senior, Mezzanine and Legacy Debt
• Financial Leverage versus Reference Covenant
• Synergy Benefits and Integration Costs
• Cash Generation and Reinvestment
• Exit Multiple versus Combined Equity IRR
Charts reference the model's operating, financing and sensitivity ranges. Microsoft Excel Desktop recalculation is required to refresh empty stored chart data caches in the supplied workbook.
━━━━━━━━━━━━━━━━━━━━
🔎 02 | QUALITY OF EARNINGS (QoE) & NORMALIZED EBITDA
━━━━━━━━━━━━━━━━━━━━
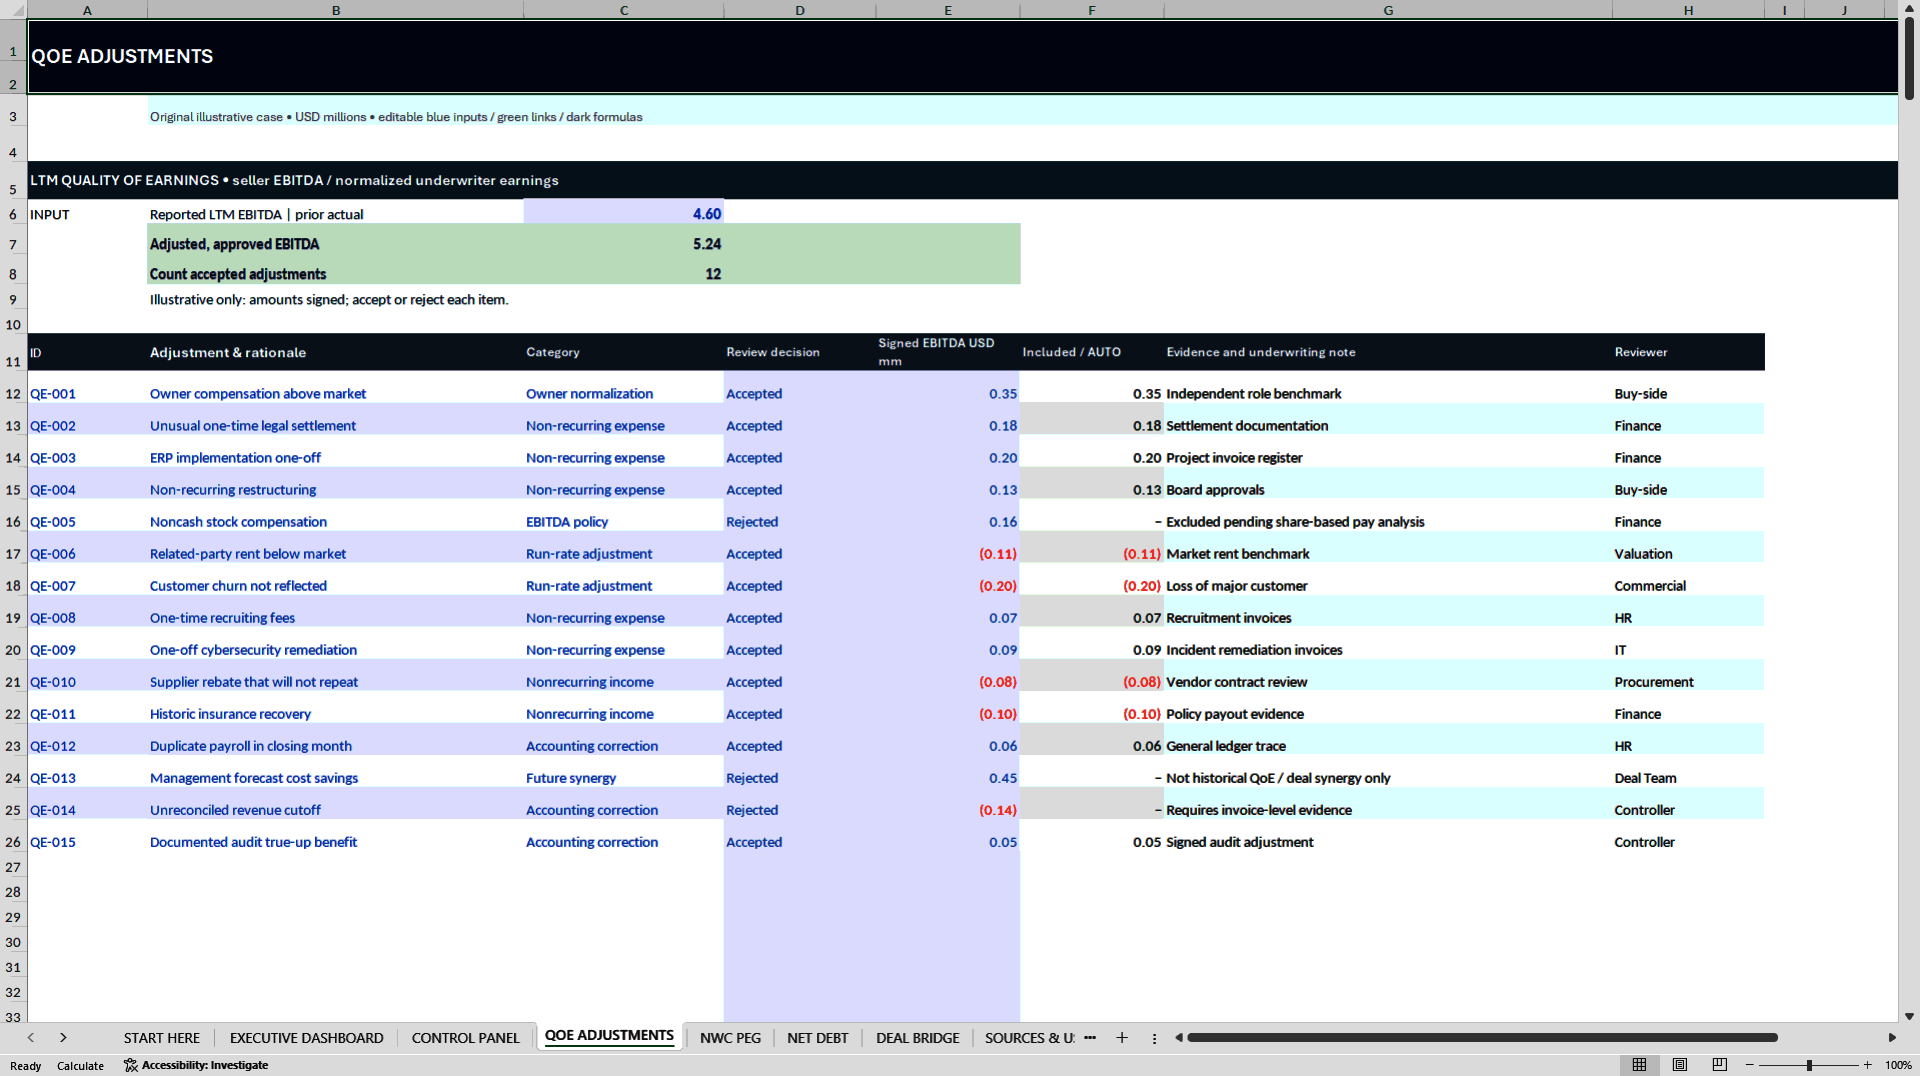
Go beyond reported EBITDA with a structured adjustment register:
• Reported trailing-12-month target EBITDA
• 15 fictional QoE adjustment examples
• Prepared formula capacity for up to 500 adjustment records
• Non-recurring expenses and income
• Owner compensation, related-party and normalization items
• Signed positive or negative adjustment values
• Accepted versus rejected adjustment decisions
• Evidence references, reviewer and rationale
• Adjusted EBITDA feeding transaction valuation
ILLUSTRATIVE BASE CASE
Reported EBITDA: USD 4.60 million
Accepted Net Adjustments: USD 0.64 million
Adjusted EBITDA: USD 5.24 million
The presence or acceptance of an adjustment in this model does not independently verify its accounting, commercial or diligence validity.
━━━━━━━━━━━━━━━━━━━━
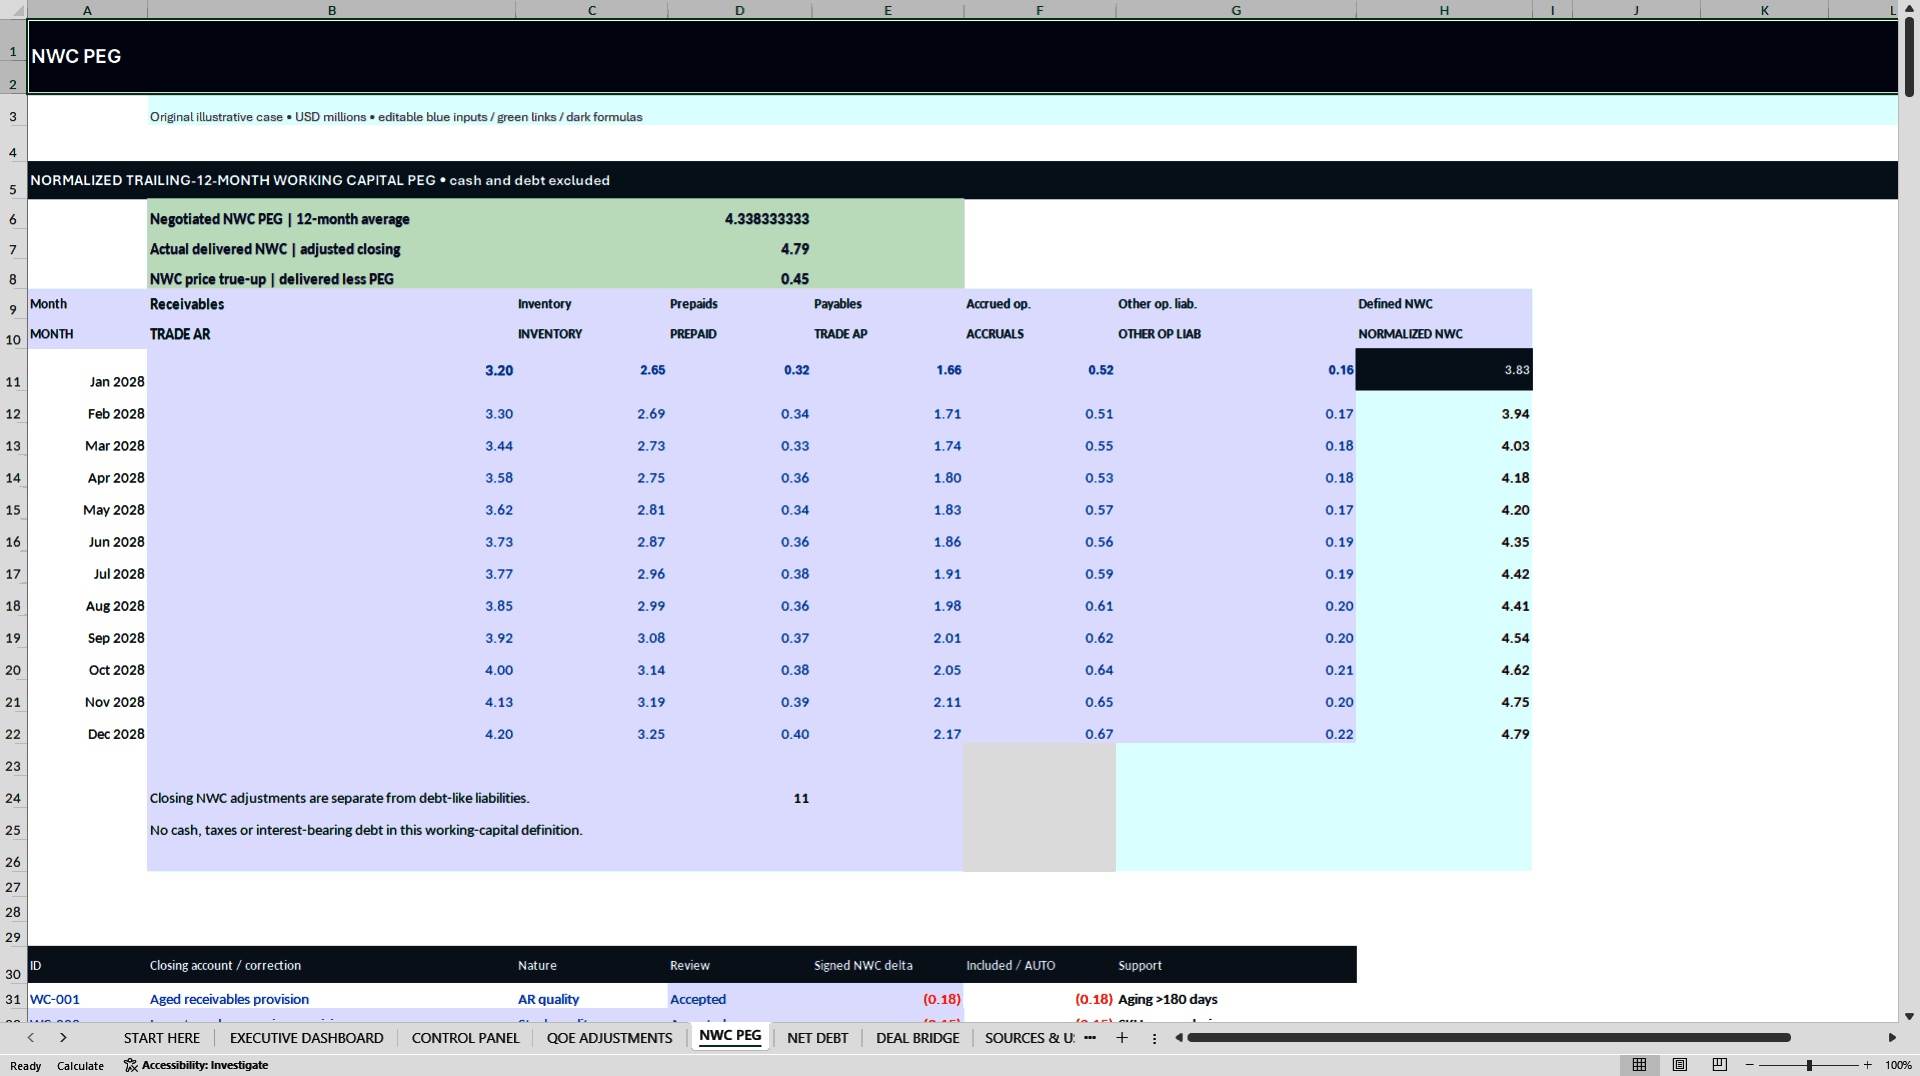
⚖️ 03 | NET WORKING CAPITAL PEG & CLOSING ADJUSTMENTS
━━━━━━━━━━━━━━━━━━━━
Evaluate the relationship between historical normalized operating working capital and the working capital delivered at closing.
• Twelve-month NWC reference schedule
• Receivables, inventory and prepayments
• Accounts payable, accruals and other operating liabilities
• Negotiated working capital peg
• Delivered versus target working capital
• Closing true-up adjustments
• 15 fictional closing adjustment records with extension capacity
• Separation of operating NWC from financial debt and debt-like items
This separation makes the deal bridge more transparent and helps reduce the risk of double-counting obligations.
Actual Share Purchase Agreement definitions must be reviewed independently.
━━━━━━━━━━━━━━━━━━━━
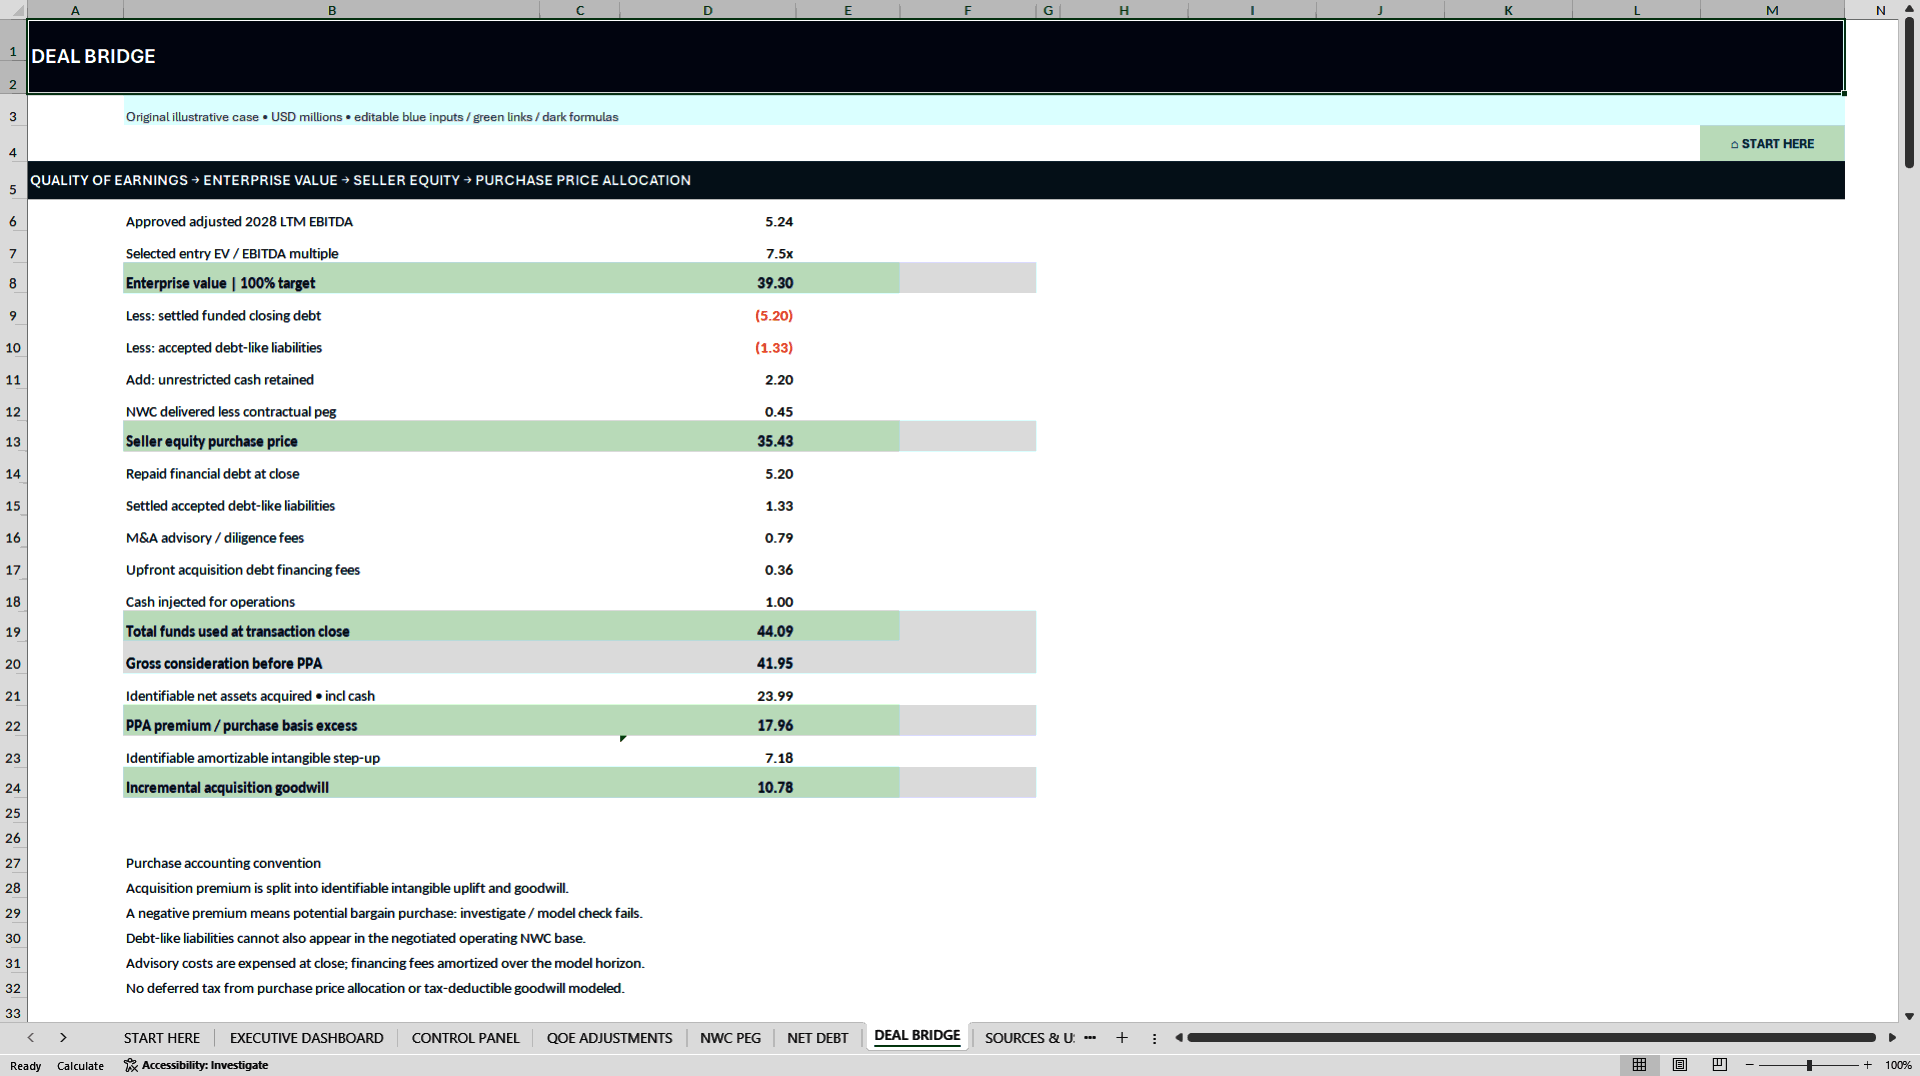
💼 04 | PURCHASE PRICE, ENTERPRISE VALUE & SELLER EQUITY BRIDGE
━━━━━━━━━━━━━━━━━━━━
Convert approved target earnings and the entry valuation multiple into an illustrative purchase consideration.
KEY CAPABILITIES
• Adjusted Target EBITDA
• Entry EV / EBITDA Multiple
• Target Enterprise Value
• Funded financial debt and cash
• Accepted debt-like liabilities
• Working capital purchase-price true-up
• Seller Equity Purchase Price
• Transaction expenses and closing funds required
• Simplified intangible step-up and acquisition goodwill
ILLUSTRATIVE BASE CASE
Adjusted EBITDA: USD 5.24 million
Entry EV / EBITDA Multiple: 7.50x
Target Enterprise Value: USD 39.30 million
Seller Equity Purchase Price: approximately USD 35.43 million
The purchase-accounting framework is simplified and does not replace a complete IFRS 3 or ASC 805 purchase price allocation.
━━━━━━━━━━━━━━━━━━━━
🏦 05 | ACQUISITION SOURCES & USES
━━━━━━━━━━━━━━━━━━━━
Review how the transaction is funded:
• Cash consideration to the seller
• Repayment of target financial debt
• Settlement of accepted debt-like liabilities
• Advisory, legal, diligence and financing fees
• Operating cash injected at closing
• Senior acquisition borrowing
• Mezzanine acquisition borrowing
• Cash contributed by the existing buyer
• Residual new sponsor equity
• Sources-versus-uses reconciliation
The model balances the funding equation by calculating residual sponsor equity.
A balanced result does not prove that debt or sponsor funds are actually available.
━━━━━━━━━━━━━━━━━━━━
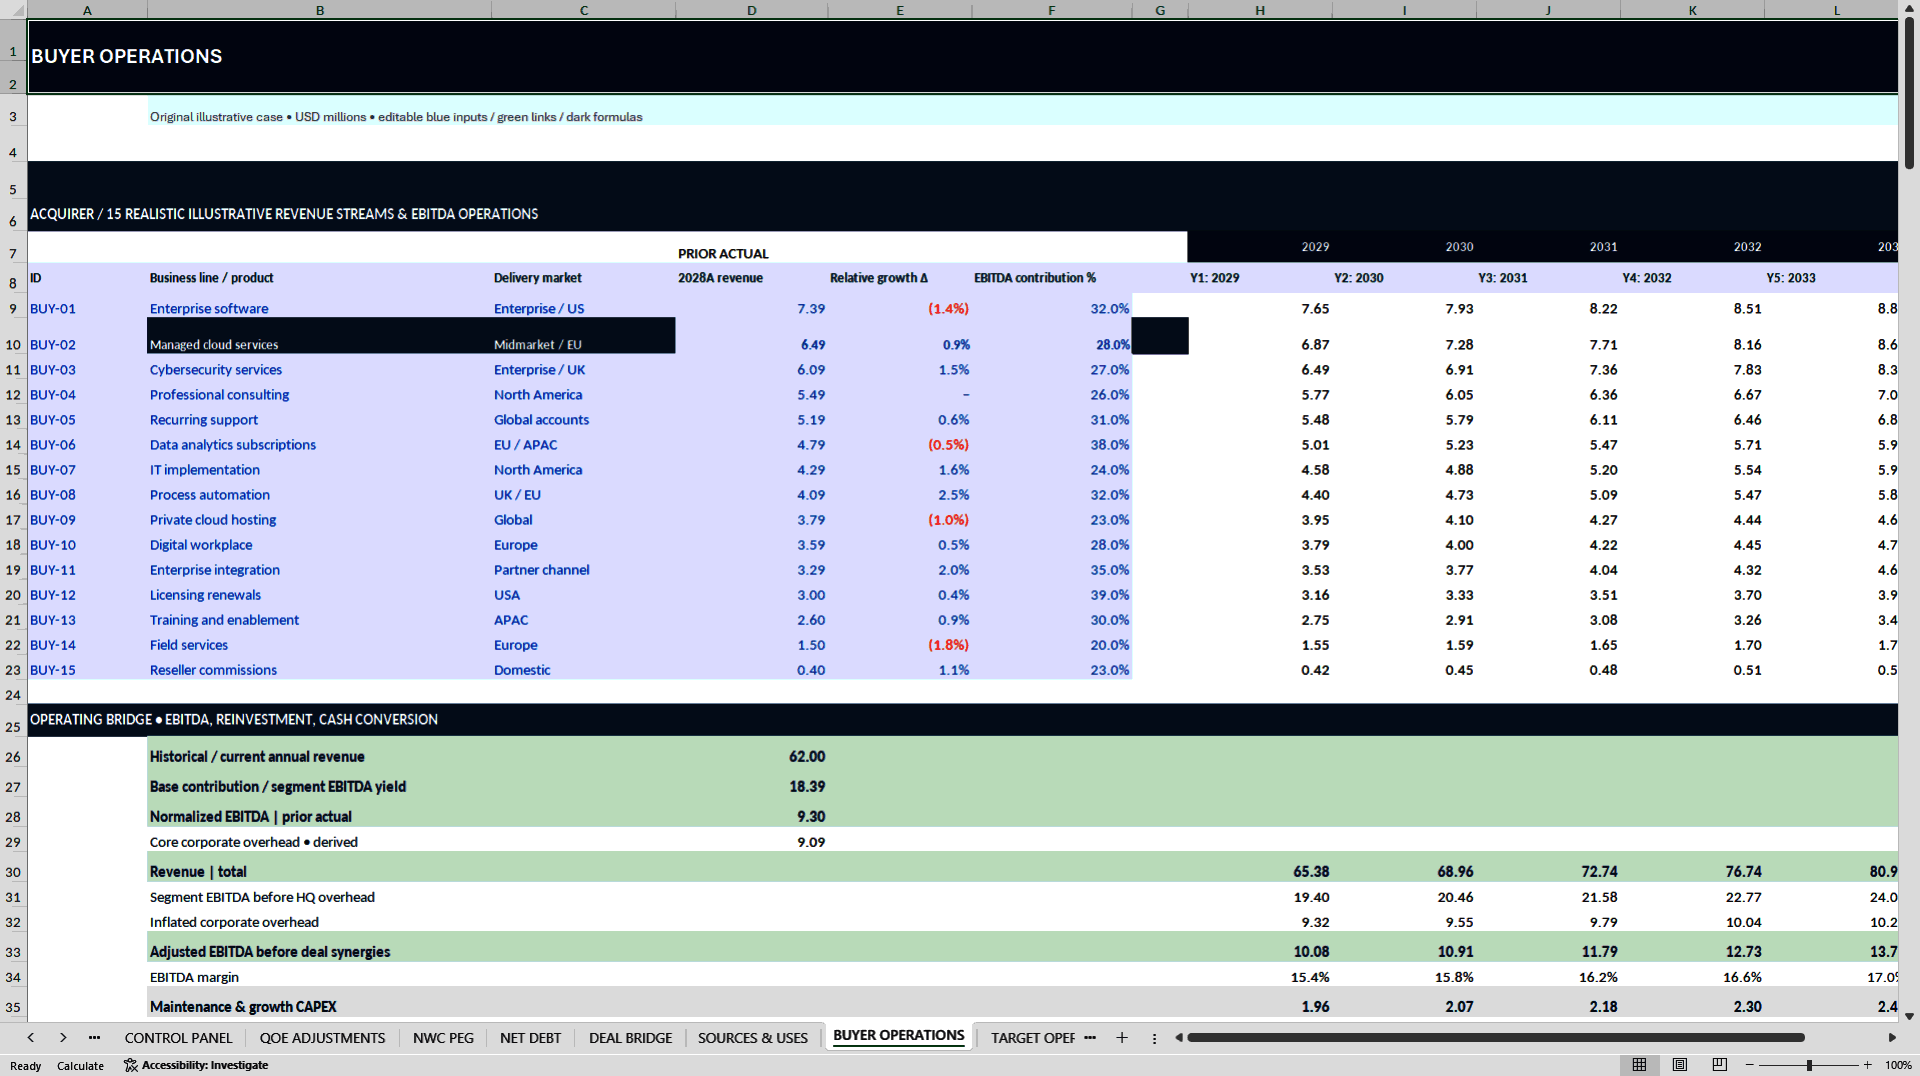
🏢 06 | BUYER, TARGET & COMBINED COMPANY FORECASTS
━━━━━━━━━━━━━━━━━━━━
Forecast operating performance over five annual periods:
• Fifteen buyer revenue streams
• Fifteen target revenue streams
• Revenue growth and EBITDA contribution assumptions
• Corporate overhead and operating expense
• Working capital, CAPEX and depreciation
• Combined revenue and EBITDA
• Simplified tax and interest calculations
• Consolidated Income Statement
• Consolidated Balance Sheet
• Consolidated Cash Flow Statement
The workbook models buyer and target operating drivers separately and brings them together in combined financial reports.
It does not provide three independently complete forecast financial statements for each standalone business.
━━━━━━━━━━━━━━━━━━━━
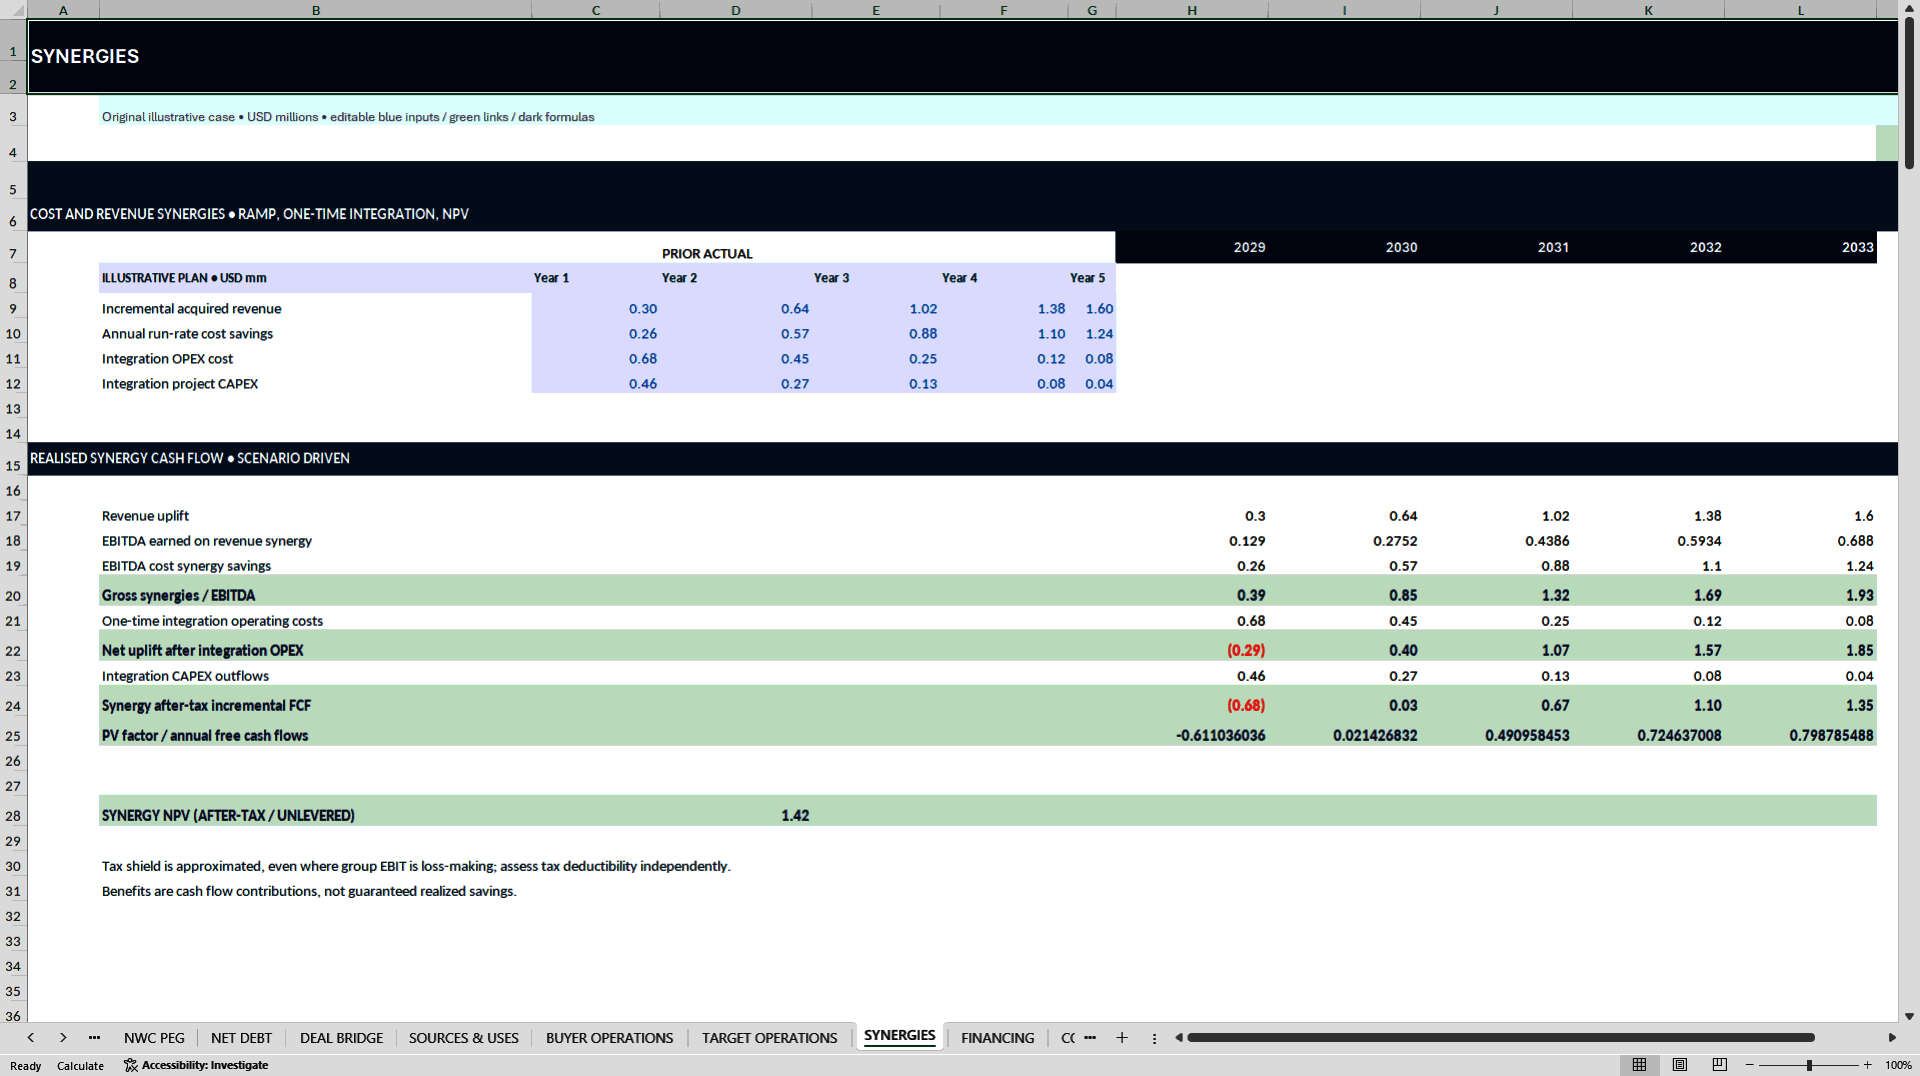
🔄 07 | SYNERGIES & INTEGRATION ECONOMICS
━━━━━━━━━━━━━━━━━━━━
Analyze potential acquisition value creation alongside integration expenses.
• Incremental revenue opportunities
• EBITDA margin on revenue synergies
• Operating cost savings
• Annual synergy realization assumptions
• One-time integration operating costs
• Integration capital expenditure
• After-tax incremental cash flow
• Discounted Synergy NPV
Synergy NPV is a standalone illustrative metric. Do not add it to enterprise value if the same anticipated benefits are already included in forecast earnings or exit valuation assumptions.
━━━━━━━━━━━━━━━━━━━━
💳 08 | SENIOR DEBT, MEZZANINE & CASH SWEEPS
━━━━━━━━━━━━━━━━━━━━
Connect closing finance sources with the modeled five-year debt schedules:
• Senior acquisition debt and amortization
• Mezzanine acquisition financing and interest
• Existing buyer debt
• Annual interest and debt-service expense
• Minimum principal repayments
• Excess-cash senior debt sweep
• Outstanding borrowing balances
• Financial leverage and illustrative covenant headroom
• Financing fee amortization
Cash sweeps are constrained by modeled cash availability and remaining senior principal.
Covenant indicators are internal references, not lender-certified covenant calculations.
━━━━━━━━━━━━━━━━━━━━
📈 09 | INVESTOR RETURNS & EXIT VALUATION
━━━━━━━━━━━━━━━━━━━━
Assess five-year combined-company investor returns through:
• Exit-year EBITDA and EV / EBITDA multiple
• Exit Enterprise Value
• Remaining financial debt and exit cash
• Exit Equity Value
• Combined equity investment basis
• Five-Year Combined Equity IRR
• Indicative economic sponsor participation
• Hypothetical exit return comparisons
IMPORTANT RETURN CONVENTION
The headline combined-equity IRR reflects the value of the existing buyer equity plus new sponsor investment, compared with the estimated terminal equity value of the combined company.
It is not an LBO-only return on the incremental sponsor cash contribution.
The modeled ownership participation is an economic proxy, not a legal capitalization table or distribution waterfall.
━━━━━━━━━━━━━━━━━━━━
🔀 10 | THREE DEAL SCENARIOS
━━━━━━━━━━━━━━━━━━━━
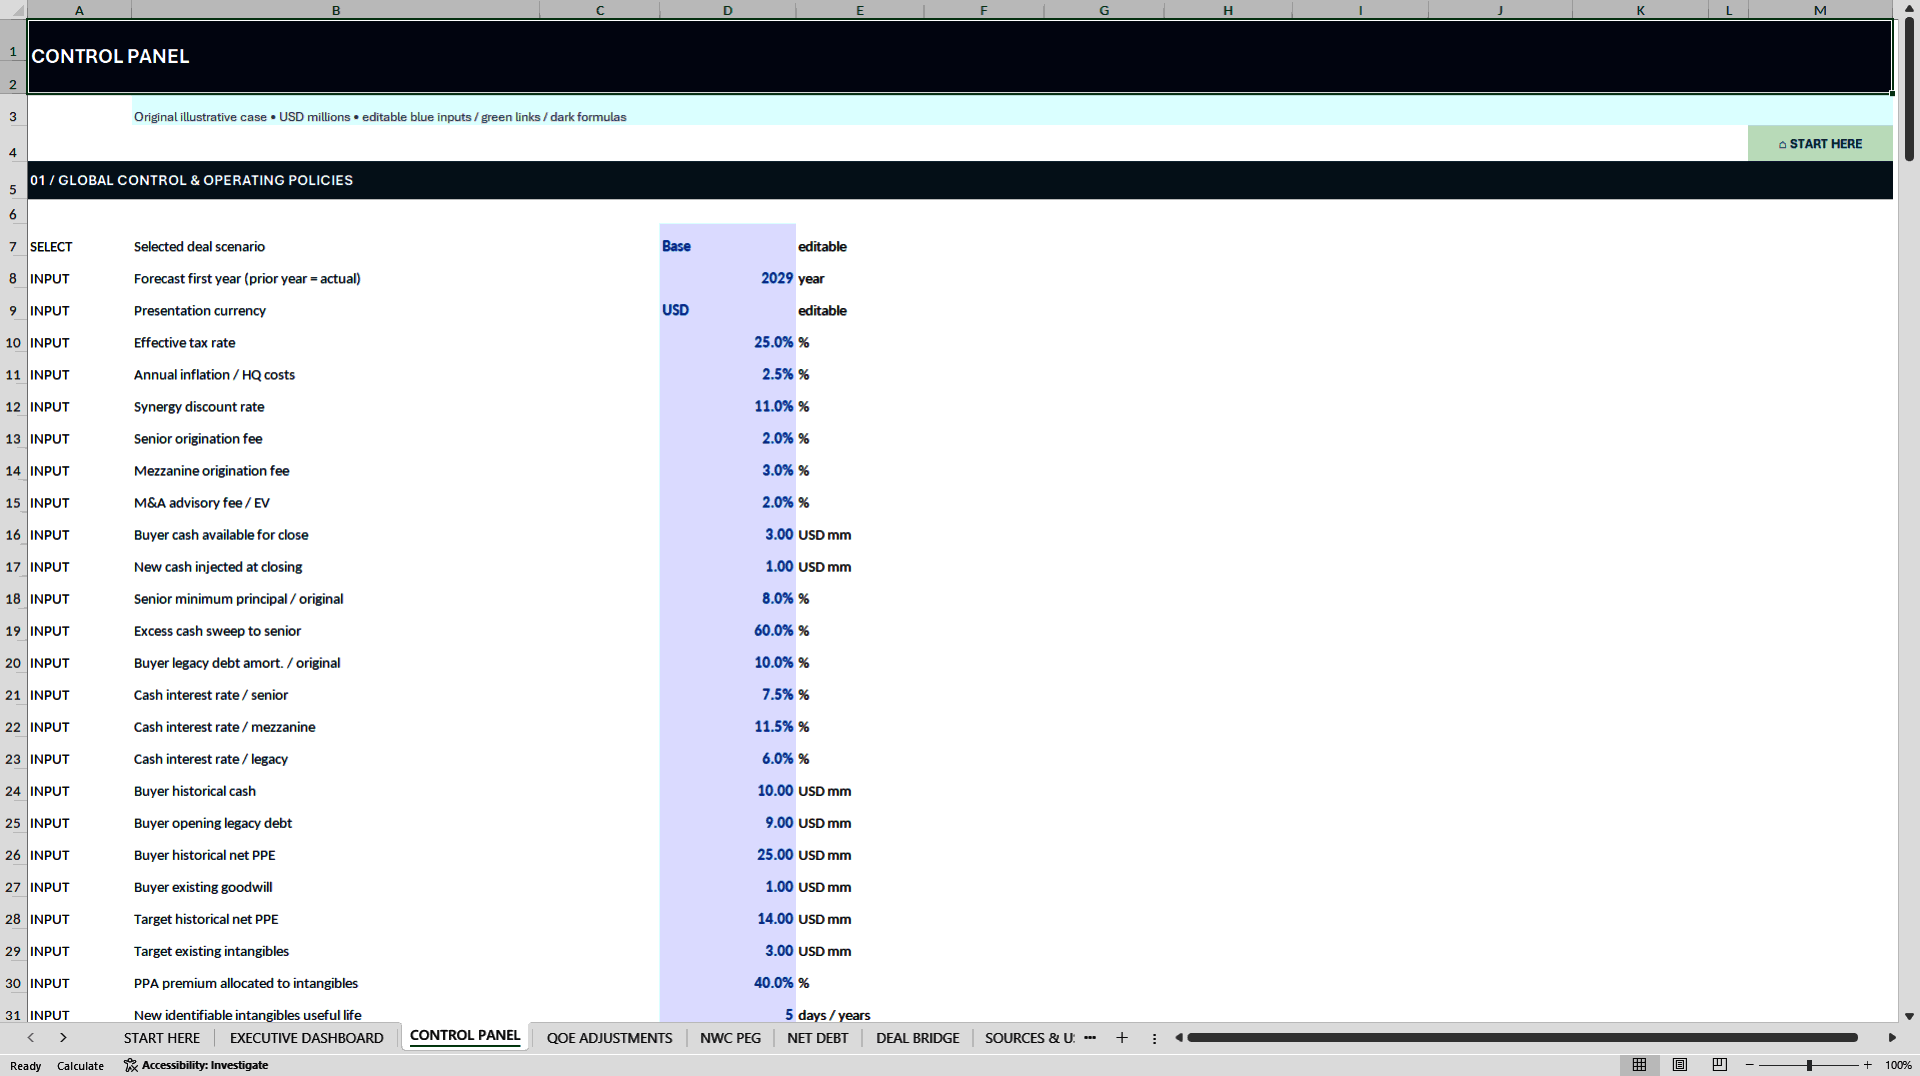
Change the selected case in CONTROL PANEL:
🟦 BASE – Central purchase multiple, business growth, financing and synergy assumptions.
🟧 DOWNSIDE – Higher entry price, weaker operations or reduced synergy performance.
🟩 UPSIDE – More favorable purchase price, growth and synergy outcomes.
Scenario drivers include entry and exit EBITDA multiples, acquisition leverage, buyer/target growth, margins, synergies and integration expenses.
A selected case updates the connected model.
All demonstration figures are fictional, and scenario results require recalculation and review before use.
━━━━━━━━━━━━━━━━━━━━
🔍 11 | 7 × 7 ENTRY / EXIT VALUATION SENSITIVITY
━━━━━━━━━━━━━━━━━━━━
The SENSITIVITY worksheet provides 49 combinations of entry and exit EBITDA multiples against Five-Year Combined Equity IRR.
• Seven entry valuation multiples
• Seven exit valuation multiples
• 49 linked return calculations
• Editable assumptions in the transaction control framework
• Visualization of the relationship between deal price and exit value
The sensitivity matrix keeps the documented operating and financing assumptions constant except for its specified entry/exit valuation effects.
Use the three main scenarios to explore integrated operating and funding changes.
━━━━━━━━━━━━━━━━━━━━
✅ 12 | MODEL CHECKS & MANUAL DILIGENCE GATES
━━━━━━━━━━━━━━━━━━━━
MODEL CHECKS includes controls over:
• Sources & Uses balance
• Closing and forecast balance sheets
• Cash movement and debt rollforwards
• QoE normalization and purchase-price calculations
• NWC true-up reconciliation
• Purchase price allocation relationships
• Financial fees and selected liquidity indicators
The stored illustrative Base Case shows 27 automated PASS rows and one deliberately open MANUAL due-diligence gate relating to debt-like items and working-capital overlap.
The final manual-review status remains REVIEW.
These results have not been independently reproduced by running Excel Desktop recalculation or all scenario variations.
A successful arithmetic reconciliation is not evidence of completed financial due diligence, debt availability, investment suitability or transaction approval.
━━━━━━━━━━━━━━━━━━━━
📦 EXACTLY WHAT YOU RECEIVE
━━━━━━━━━━━━━━━━━━━━
📘 PRIMARY DOCUMENT | M&A ACQUISITION FINANCIAL MODEL (.XLSX)
✅ 20 interconnected Excel worksheets
✅ Five annual forecasts, illustrative 2029–2033
✅ Buyer and Target revenue-stream planning (15 each)
✅ Quality-of-Earnings adjustment register, up to 500 prepared entries
✅ 12-month normalized working capital review
✅ Enterprise-to-equity transaction pricing bridge
✅ Closing funding and Sources & Uses
✅ Senior and Mezzanine debt schedules
✅ Synergy and integration valuation
✅ Consolidated three-statement financial reporting
✅ Three configurable deal scenarios
✅ 7 × 7 sensitivity matrix with 49 combinations
✅ Eight native data-linked Excel charts
✅ Formula-based checks and manual diligence gate
📄 SUPPLEMENTARY DOCUMENT | HOW-TO-USE GUIDE (.PDF)
✅ Full 38-page English A4 manual
✅ Workbook navigation and input instructions
✅ QoE, NWC, net debt and purchase-price adjustments
✅ Closing acquisition funding and financing
✅ Buyer/Target operations, financial statements and synergies
✅ Return conventions, scenario controls and sensitivity
✅ Model checks, troubleshooting and key limitations
On Flevy, upload the editable XLSX as the Primary Document and the ZIP containing the full PDF guide as the Supplementary Document.
━━━━━━━━━━━━━━━━━━━━
🎯 IDEAL FOR
━━━━━━━━━━━━━━━━━━━━
• Corporate Development and M&A Teams
• Acquisition Analysts and CFOs
• Private Equity and Investment Teams
• Financial Due Diligence and Transaction Services Professionals
• Business Owners Evaluating Acquisitions
• Financial Consultants and M&A Advisers
• Investment Committees and Financial Modeling Students
PRACTICAL USE CASES
Acquisition screening, illustrative QoE normalization, working-capital negotiations, price-bridge reviews, debt-capacity planning, integrated operating forecasts, synergy sensitivities, exit-multiple analysis and internal investment discussions.
━━━━━━━━━━━━━━━━━━━━
🧭 SIX-STEP WORKFLOW
━━━━━━━━━━━━━━━━━━━━
1. Open START HERE, save a working copy and review CONTROL PANEL.
2. Replace fictional QoE adjustments and NWC information with source-backed transaction records.
3. Validate cash, funded debt, debt-like items, purchase-price adjustments and closing funding.
4. Configure buyer/target operating assumptions, synergies and acquisition financing.
5. Review the dashboard, three scenarios, combined equity IRR and 7 × 7 sensitivity.
6. Inspect MODEL CHECKS and complete manual diligence reviews before relying on results.
━━━━━━━━━━━━━━━━━━━━
💻 TECHNICAL SPECIFICATIONS
━━━━━━━━━━━━━━━━━━━━
• File Format: Editable Microsoft Excel XLSX
• Forecast: Five annual periods, default 2029–2033
• Main Workbook: 20 worksheets
• Dashboard: Eight native Excel chart objects
• Scenarios: Base, Downside and Upside
• Sensitivity: 7 × 7 entry/exit EV / EBITDA multiples
• Financial Reporting: Simplified combined Income Statement, Balance Sheet and Cash Flow Statement
• Macros/VBA: None required
• External workbook links: None required
• Recommended software: Microsoft Excel Desktop
• Google Sheets: Equivalent functionality and formatting not independently verified
• Opening requirement: Recalculate workbook in Excel Desktop to refresh stored formula results and chart data
• Delivery: Digital download only, no physical item
━━━━━━━━━━━━━━━━━━━━
⚖️ IMPORTANT FINANCIAL, ACCOUNTING & LEGAL NOTICE
━━━━━━━━━━━━━━━━━━━━
This is an independent, unofficial illustrative financial modeling template created by SheetworksStudio.
It is not an audited financial model, an independent Quality-of-Earnings report, a completed due-diligence engagement, an official accounting valuation or an investment recommendation.
All companies, adjustments, historical financial amounts, transaction prices, leverage terms, forecast figures and valuation results are fictional examples. The template does not verify seller financial information, confirm supporting evidence, establish fair values or replace professional business, legal, tax, audit and financial diligence.
Purchase accounting is simplified and not a complete IFRS 3 or ASC 805 implementation. The combined-equity return calculation is not an incremental-sponsor-only LBO IRR.
Actual deal terms, reporting standards, financing covenants and transaction structures require qualified review.
Users must validate all input data, formulas, assumptions, calculations and conclusions independently before making financial or investment decisions.
No acquisition outcome, financing approval, projected return or regulatory acceptance is guaranteed.
Resale, redistribution or republication of the editable source model and supporting files is prohibited except where permitted by the applicable Flevy terms and author's license.
SheetworksStudio | Professional Financial Models & Transaction Analysis Tools
Got a question about the product? Email us at support@flevy.com or ask the author directly by using the "Ask the Author a Question" form. If you cannot view the preview above this document description, go here to view the large preview instead.
Source: Best Practices in M&A (Mergers & Acquisitions), Due Diligence Excel: M&A Financial Due Diligence Model | 5Y QoE, Debt & IRR Excel (XLSX) Spreadsheet, SheetworksStudio
ABOUT THE AUTHOR

SheetworksStudio creates premium Excel-based business templates, dashboards, trackers, financial models, and management systems for professionals, consultants, entrepreneurs, and organizations.
Our portfolio covers finance, project management, operations, risk management, compliance, AI governance, HR, supply chain, performance management, and business planning. Each product is designed to
... [read more]
Ask the Author a Question
You must be logged in to contact the author.