
 Click main image to view in full screen. Unlock all 20 preview images:
Grid Interconnection & Transmission Upgrade Financial Model – Excel XLSX
Excel (XLSX) + supplemental PDF


BENEFITS OF THIS DOWNLOADABLE EXCEL DOCUMENT
- Quantifies interconnection queue timing, stage survival, energization probability, upgrade cost, deposits, delay, cancellation and revenue-at-risk in one connected 20-year model.
- Rebuilds project cash flow and valuation across candidate energization years and queue outcomes, with NPV, project/equity IRR, payback, peak funding and sensitivity analysis.
- Provides executive, risk, cost and go/no-go dashboards so investment, development and financing teams can trace the recommendation back to live assumptions and thresholds.
FINANCIAL MODELING EXCEL DESCRIPTION
LARGE LOAD GRID INTERCONNECTION & TRANSMISSION UPGRADE FINANCIAL MODEL
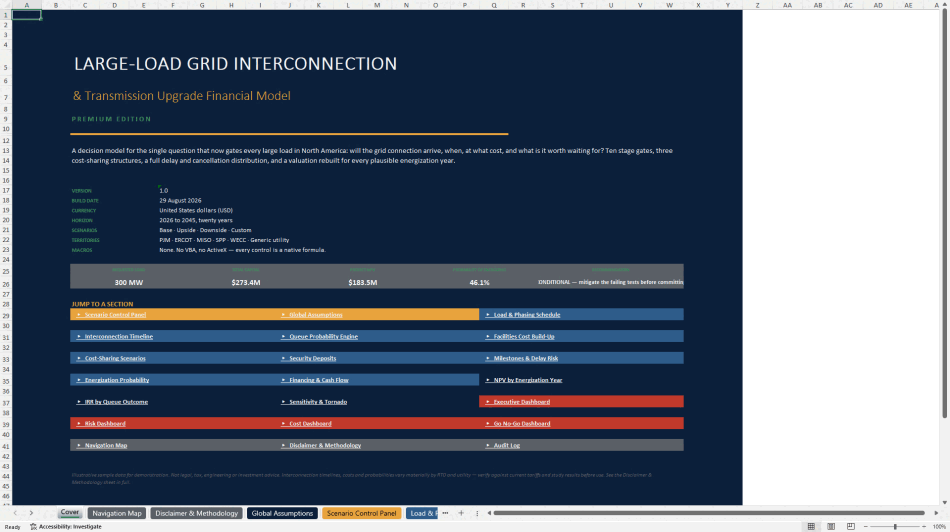
This Excel model provides an integrated 20-year framework for evaluating the economics and risk of connecting a large electrical load to the transmission grid. It is designed for data centers, AI campuses, large industrial loads, energy-infrastructure developers, project-finance teams, advisors, lenders, and investment committees that need to connect interconnection timing and transmission-upgrade exposure directly to cash flow and valuation.
Seller-supplied and already tested; no Studio workbook audit was performed.
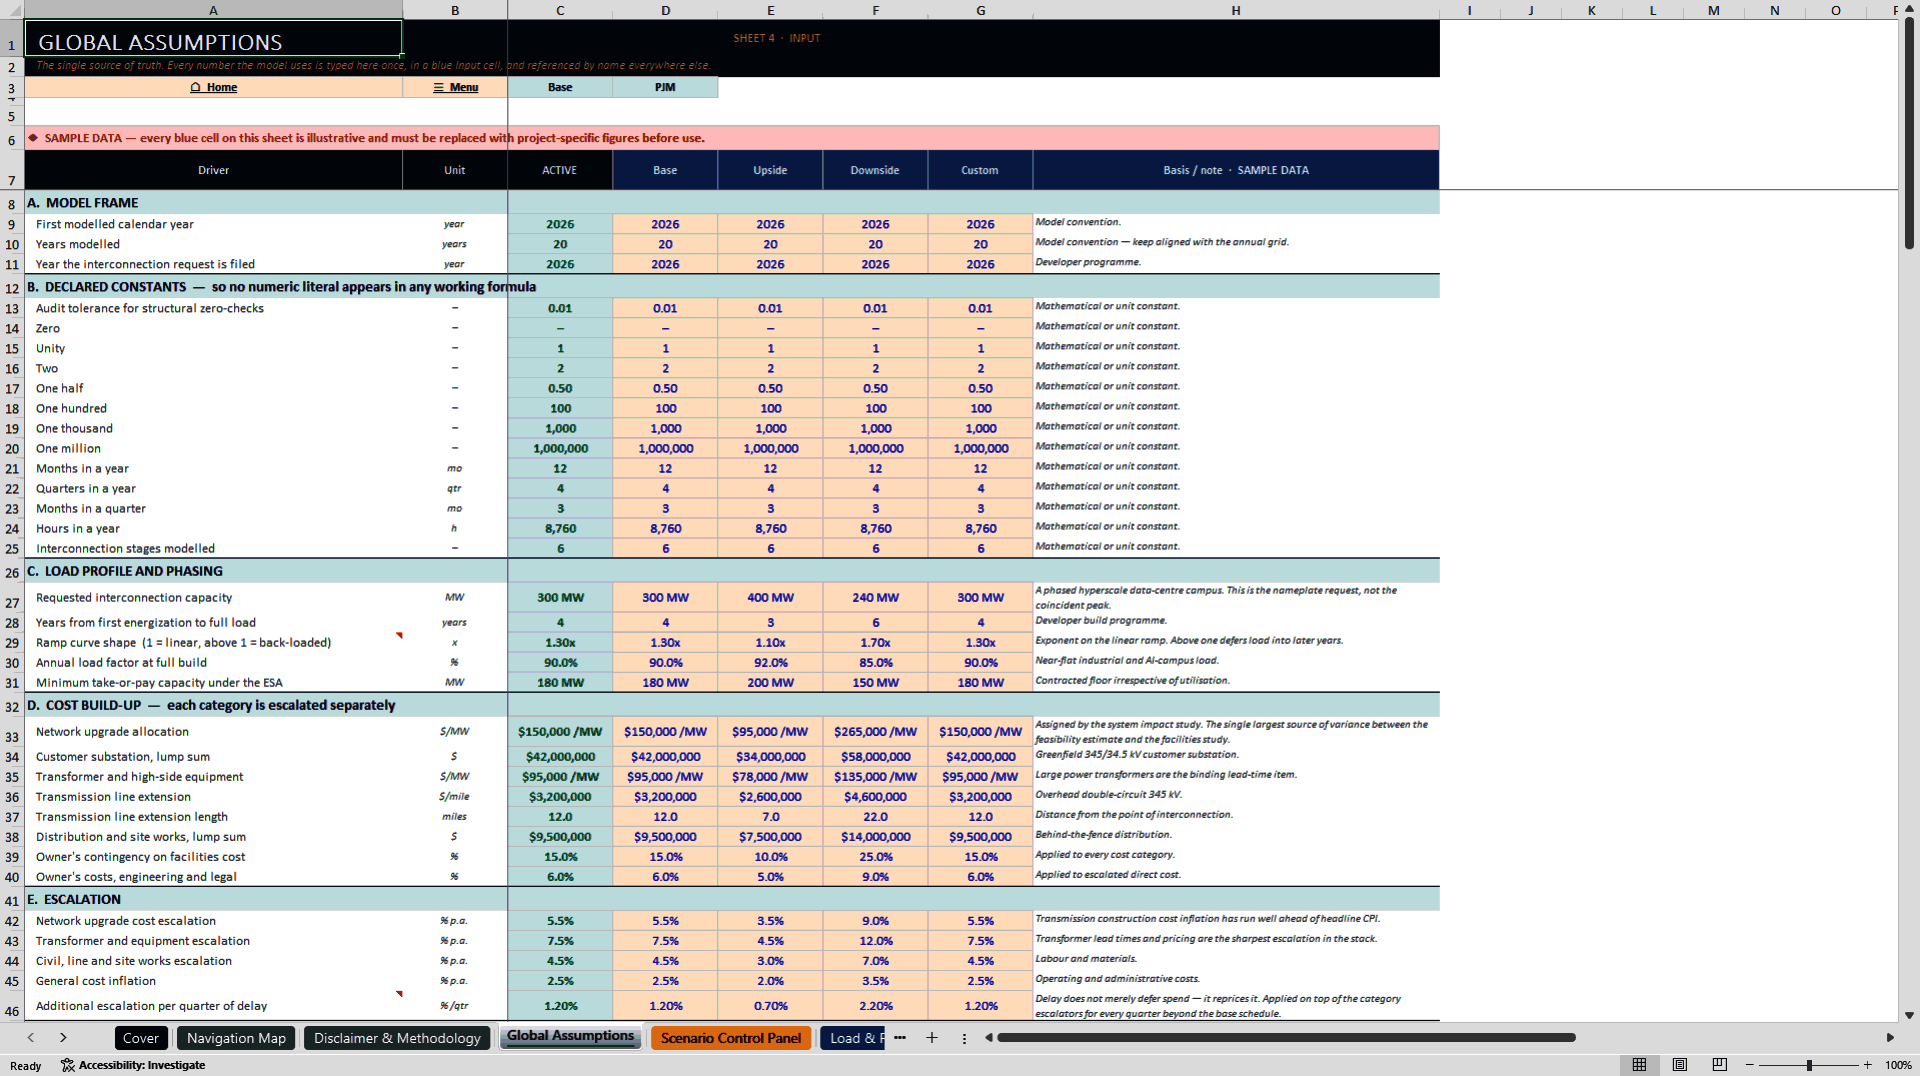
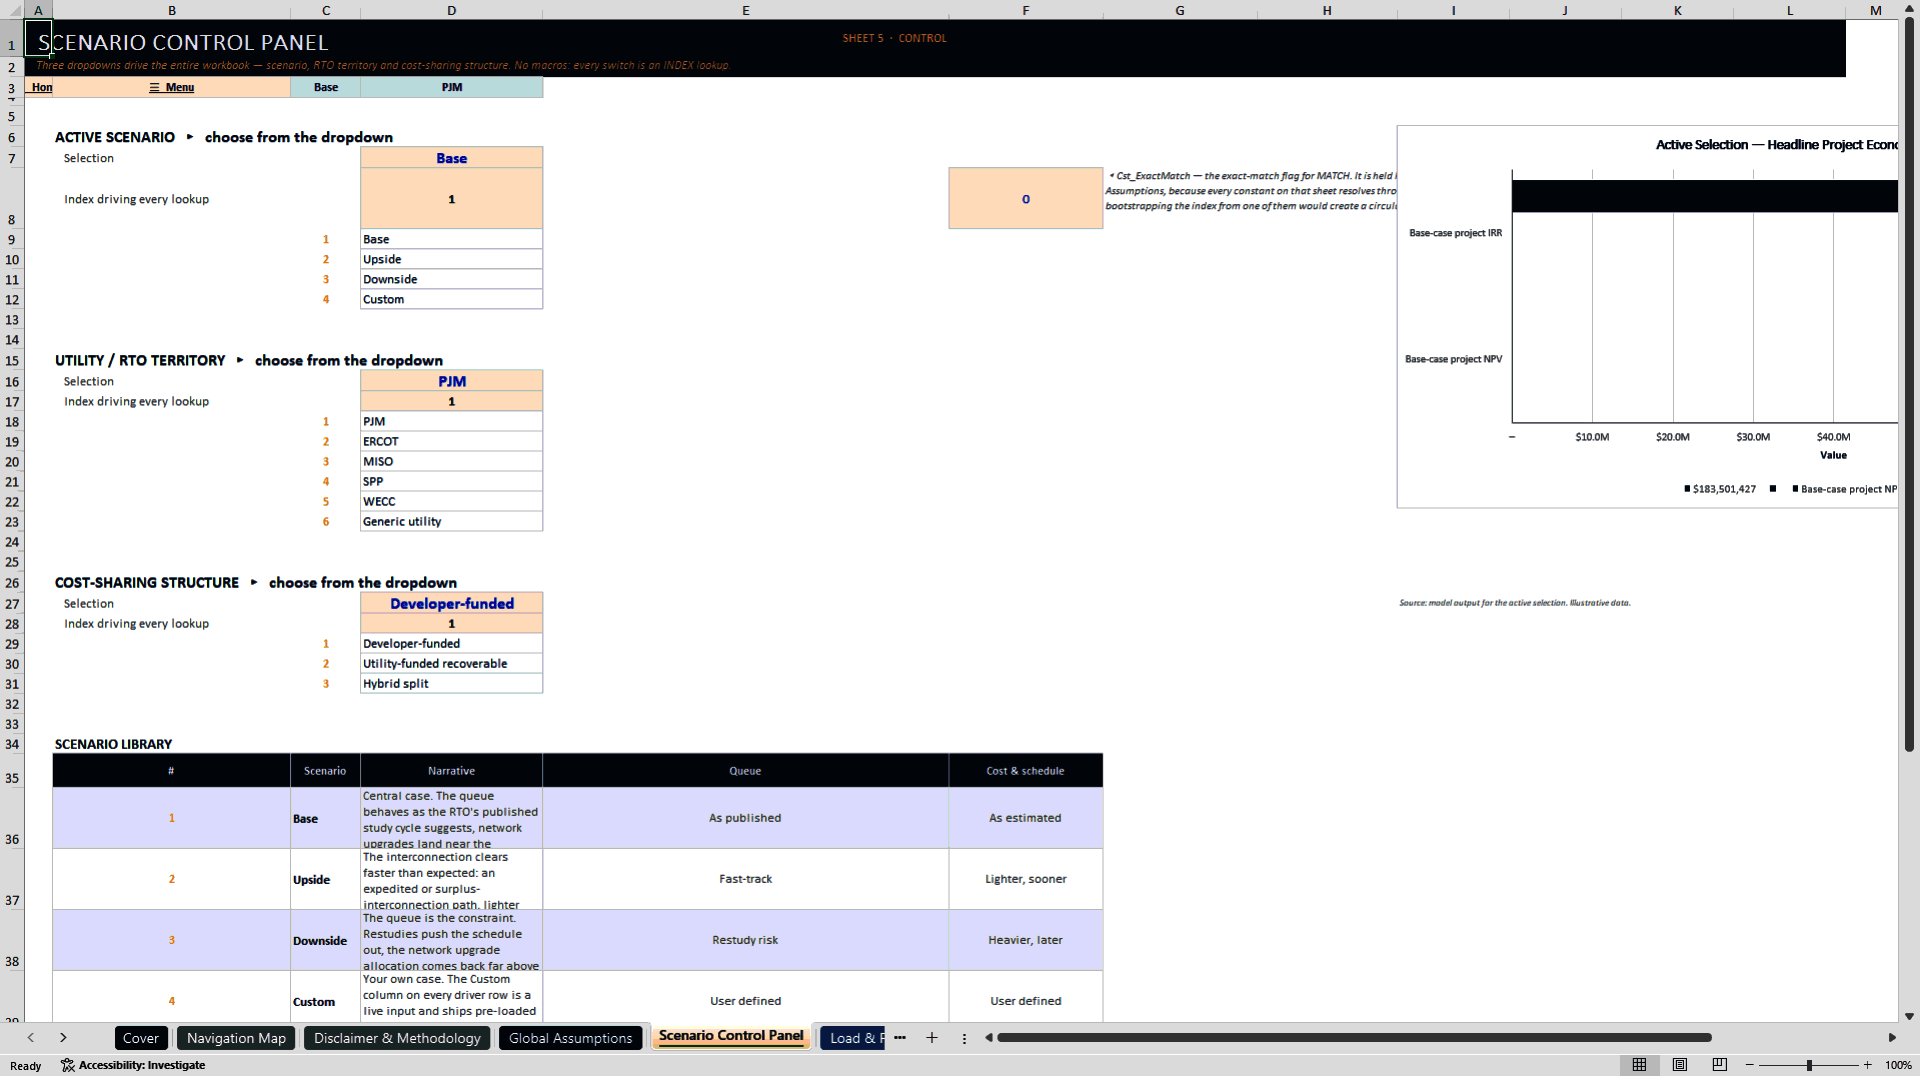
The model begins with a scenario control panel where the user selects Base, Upside, Downside, or Custom assumptions, an RTO/utility territory, and a cost-sharing structure. Territory choices include PJM, ERCOT, MISO, SPP, WECC, and a Generic utility. Global assumptions hold the editable model drivers, including requested MW, load ramp, load factor, network-upgrade allocation, customer substation, transformer and high-side equipment, line extension, site works, contingency, owner's costs, escalation, delay uplift, cost-sharing percentages, refunds, queue-stage timing and probability, security deposits, revenue and operating economics, bridge power, financing, tax, WACC, and decision thresholds.
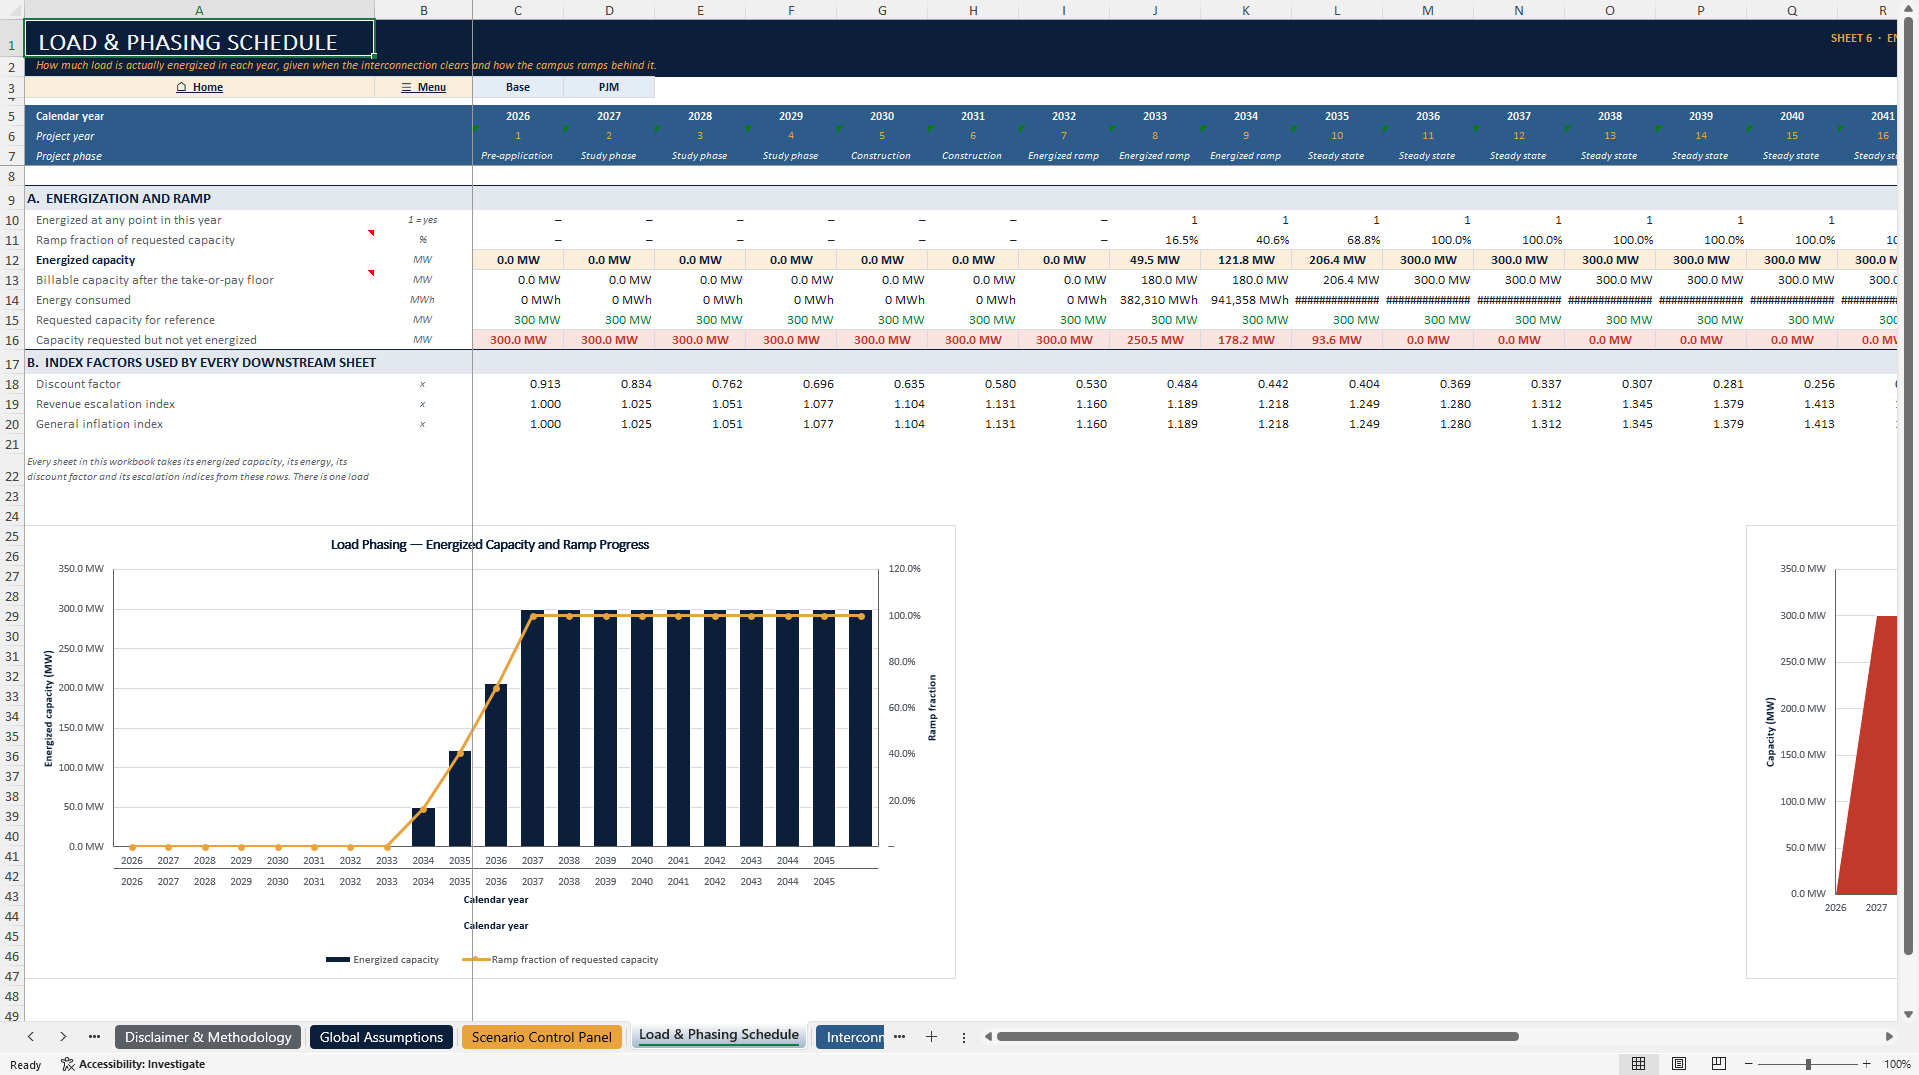
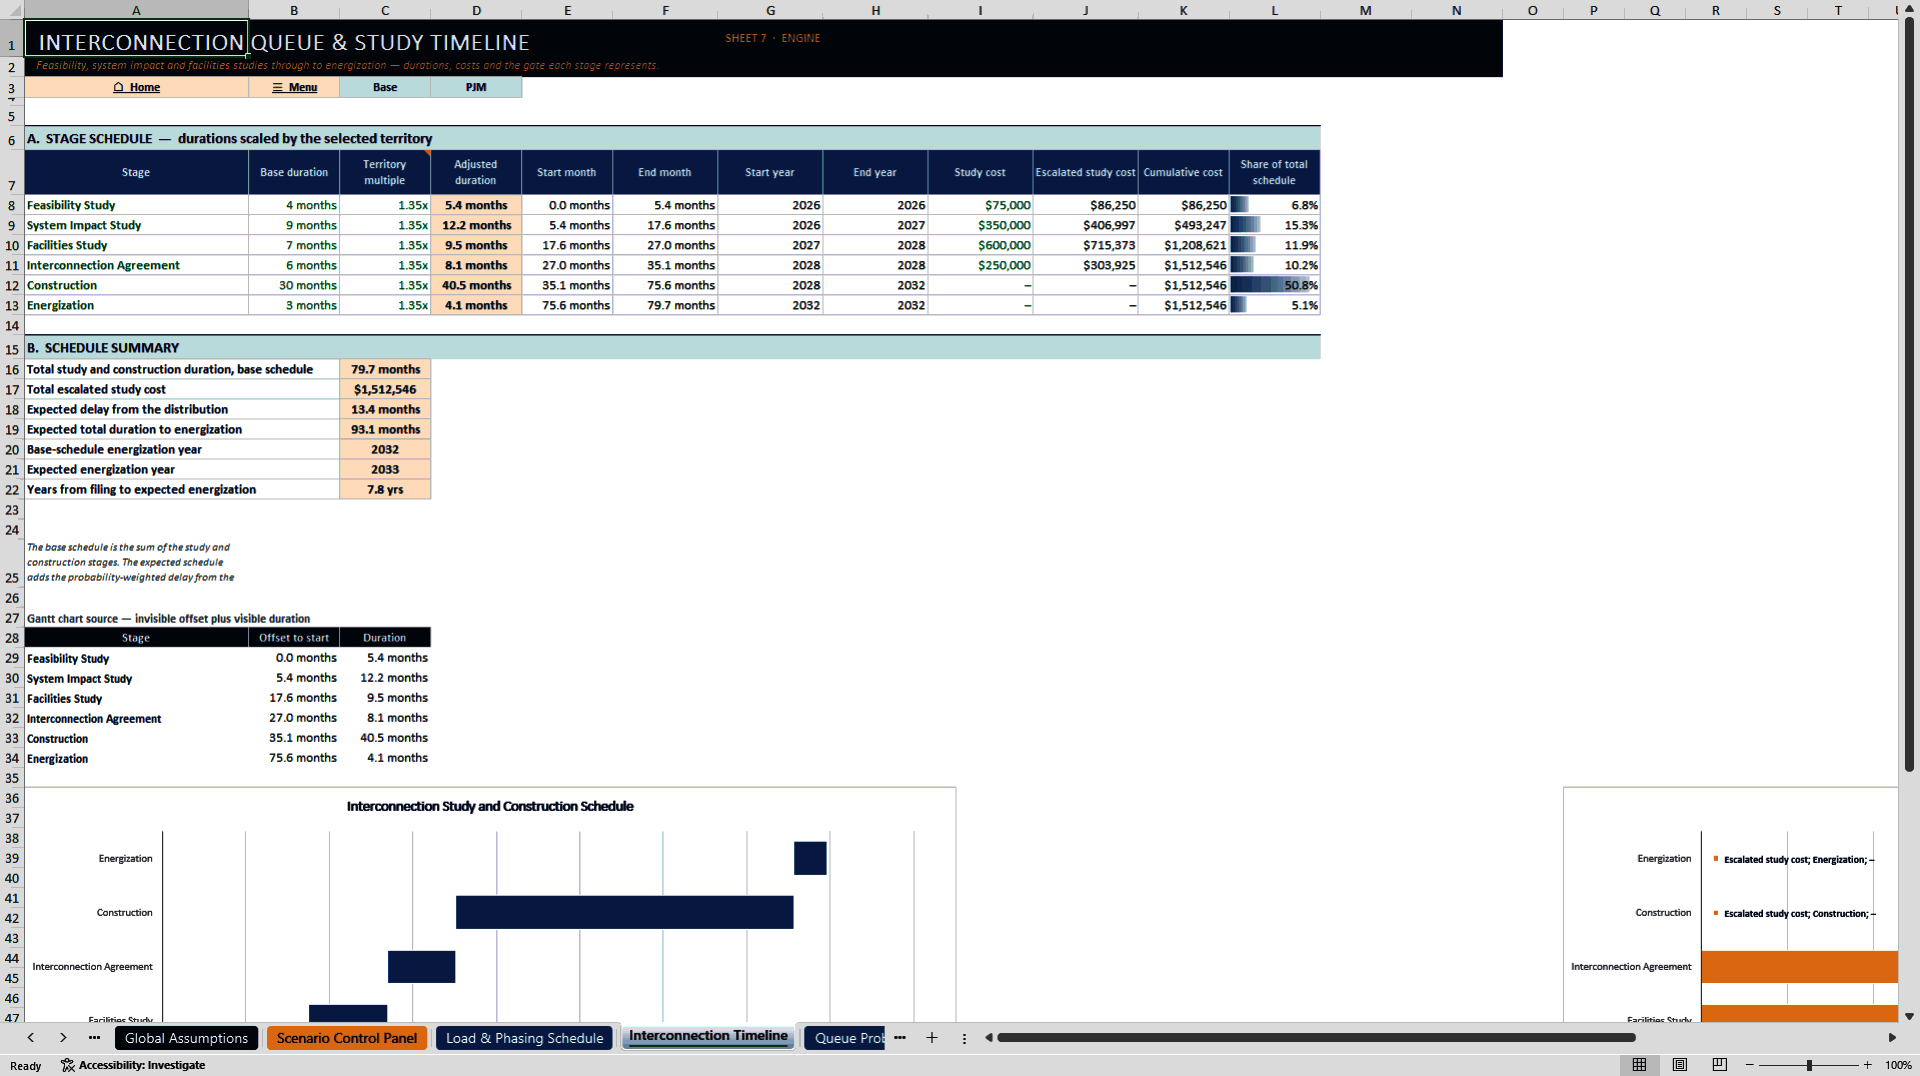
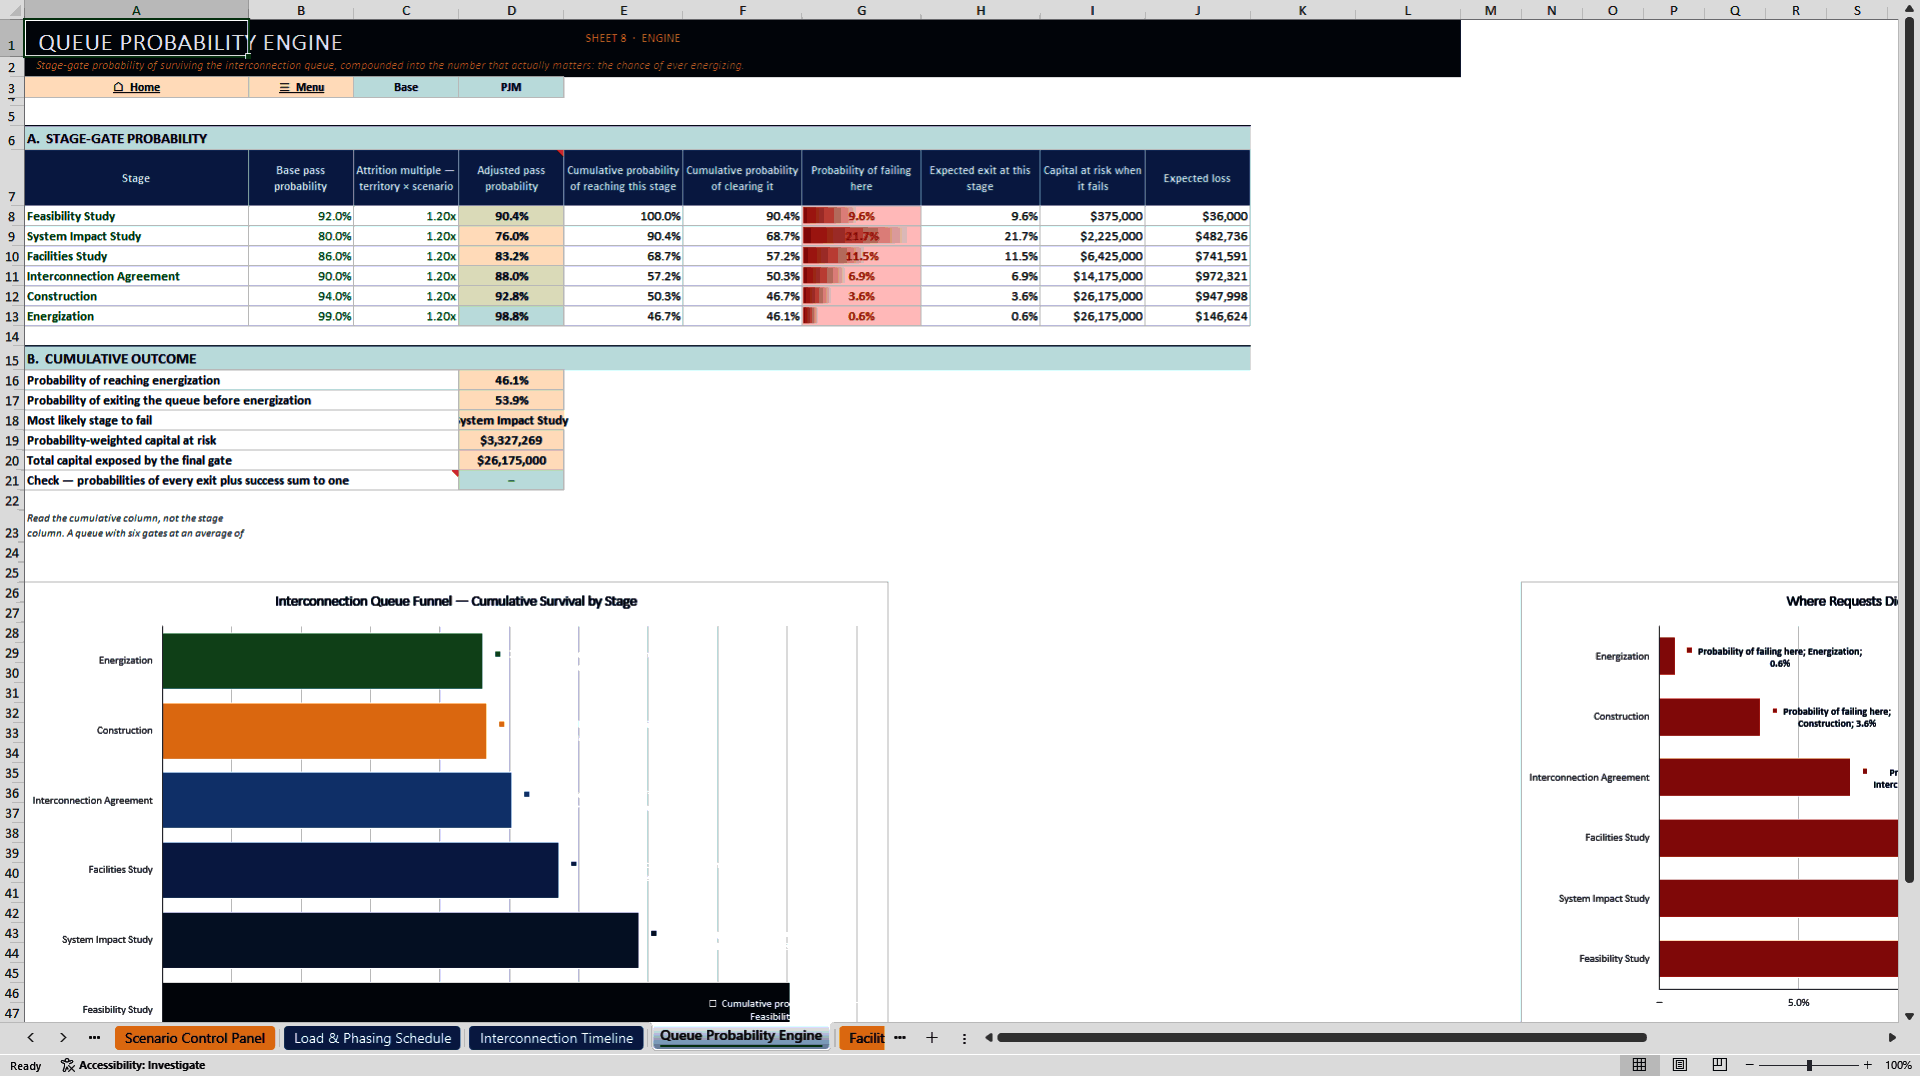
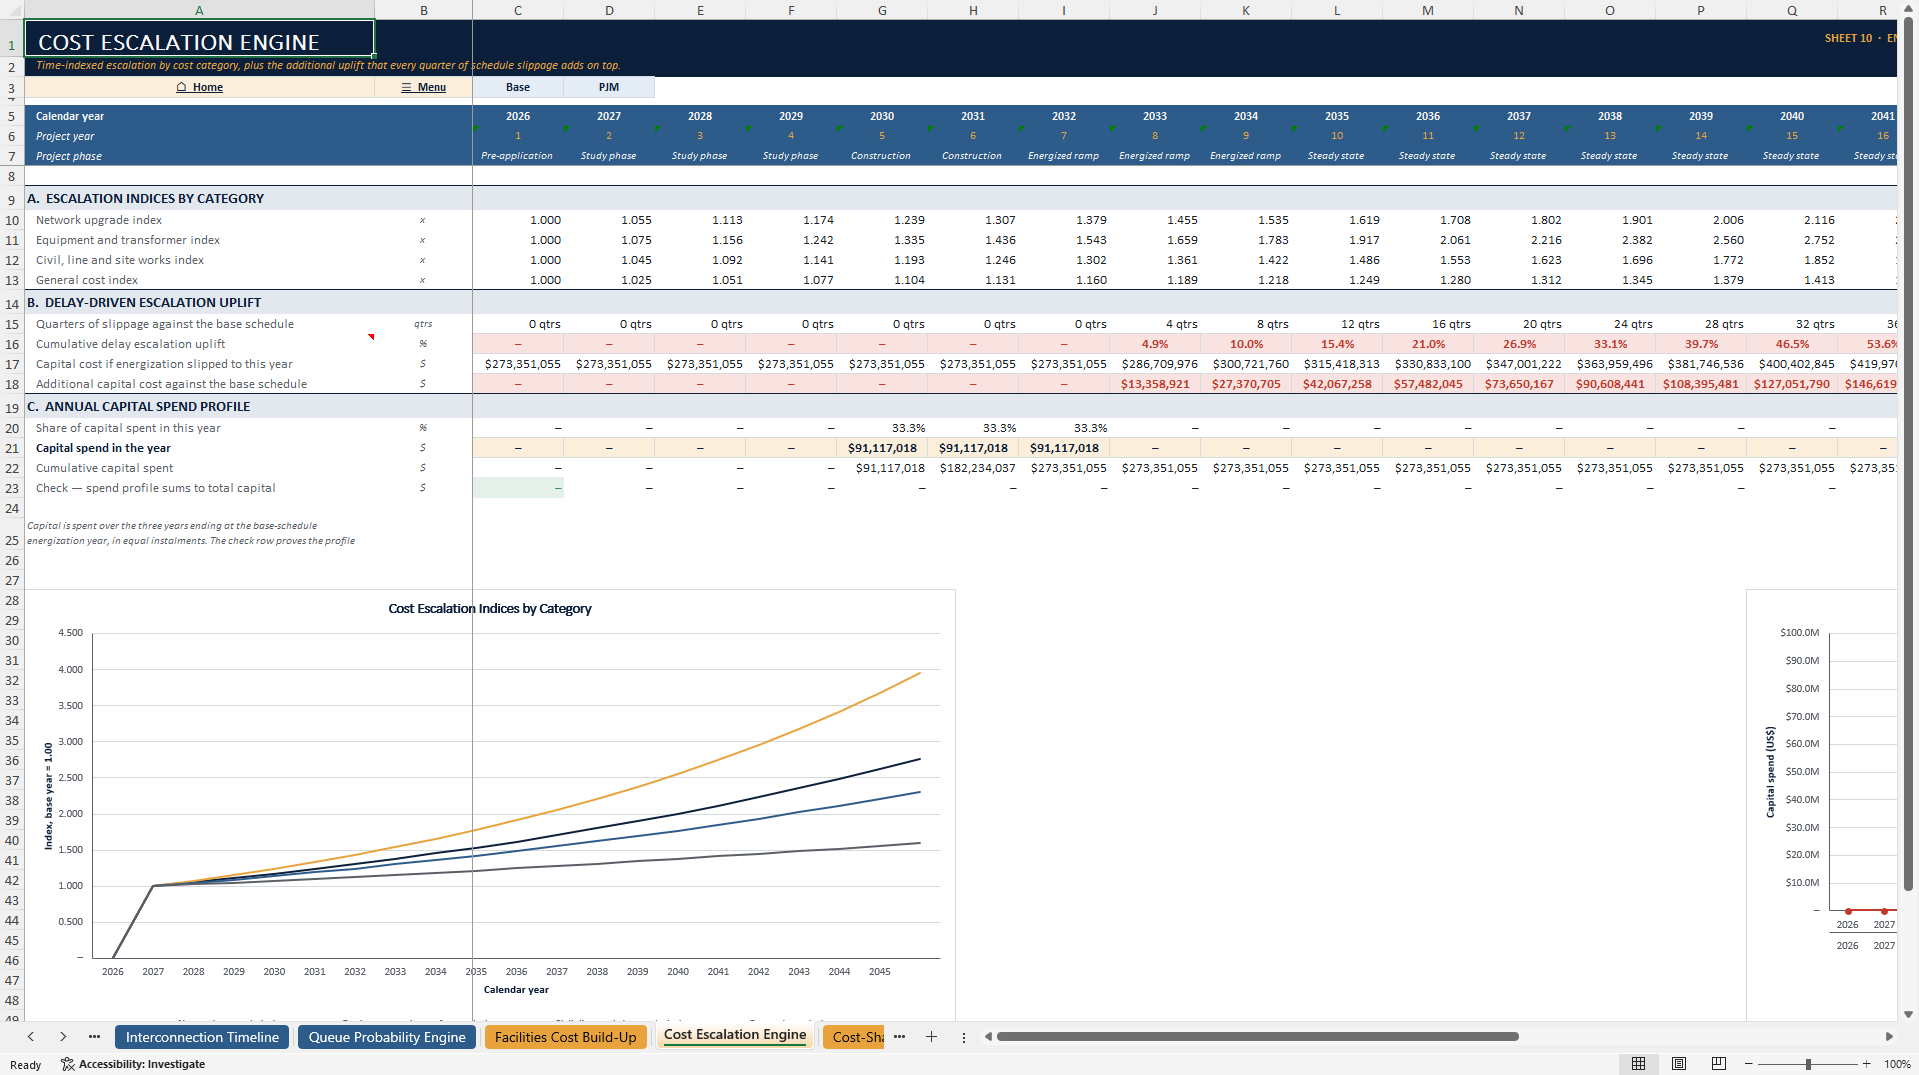
The workbook then models the load and phasing schedule, interconnection study timeline, stage-gate queue survival, energization probability, facilities and network cost build-up, category-specific escalation, funding structures, security deposits, milestone and delay risk, cancellation risk, bridge-power economics, and revenue at risk from late energization. The financing and cash-flow engine connects revenue, power cost, demand charges, operating expenditure, interconnection capital, deposits, refunds, debt, interest, depreciation, tax, project free cash flow, and equity cash flow.
Valuation outputs include project NPV, project IRR, equity IRR, payback, peak funding requirement, NPV by candidate energization year, and IRR/NPV across five queue outcomes. The sensitivity module ranks the drivers that move project NPV and includes a two-way capital-cost-versus-delay surface.
Four decision dashboards summarize the model. The Executive Dashboard presents requested load, capital cost, net cost to the load, NPV, IRR, and probability of energization. The Risk Dashboard focuses on delay, cancellation, revenue loss, capital at risk, and sensitivity. The Cost Dashboard compares the capital stack and funding structures. The Go / No-Go Dashboard applies six threshold tests and identifies the binding constraint behind the recommendation.
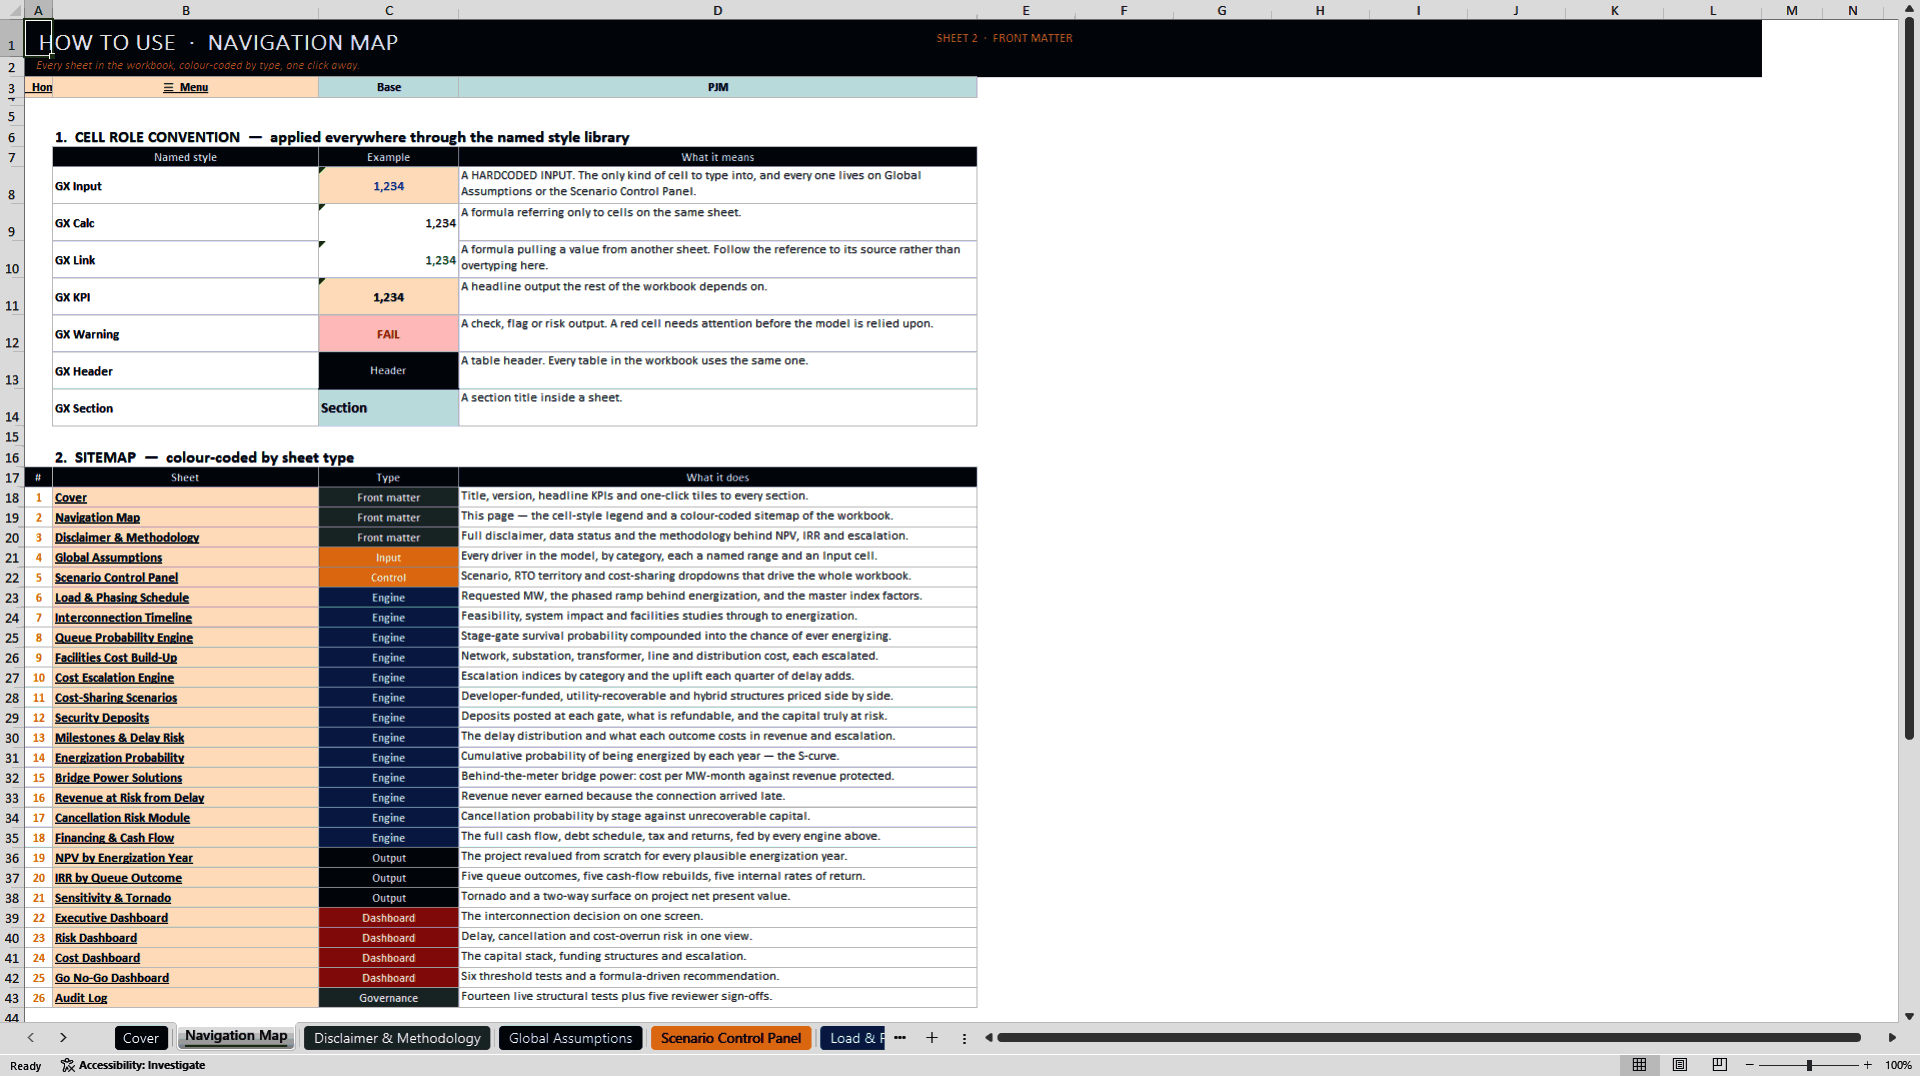
The workbook contains 26 worksheets and 57 embedded charts. It is delivered in .xlsx format and uses native Excel formulas without VBA or ActiveX. A 26-page PDF preview is supplied as the secondary document so prospective users can review the full workbook structure before use.
Got a question about the product? Email us at support@flevy.com or ask the author directly by using the "Ask the Author a Question" form. If you cannot view the preview above this document description, go here to view the large preview instead.
Source: Best Practices in Financial Modeling, Energy Industry Excel: Grid Interconnection & Transmission Upgrade Financial Model Excel (XLSX) Spreadsheet, PDMM Financial Models
ABOUT THE AUTHOR

PDMM Financial Models develops professional, decision-ready Excel models for business owners, entrepreneurs, investors, consultants, analysts, and finance teams. Our objective is to transform complex business assumptions into clear, structured analysis that supports better planning and investment decisions.
Our models cover business planning, forecasting, budgeting, feasibility analysis,
... [read more]
Ask the Author a Question
You must be logged in to contact the author.




























